
 Login Sign Up


| |||||
 |  | ||||

| 12Stocks.com Market Intelligence |
Best S&P 500 Stocks
|
On this page, you will find the most comprehensive analysis of S&P 500 stocks and ETFs - from latest trends to performances to charts ➞. First, here are the year-to-date (YTD) performances of the most requested S&P 500 stocks at 12Stocks.com (click stock for review):
| NVIDIA 54% | ||
| Caterpillar 20% | ||
| Merck 15% | ||
| Amazon.com 15% | ||
| Walmart 13% | ||
| Google 10% | ||
| JPMorgan Chase 9% | ||
| Chevron 7% | ||
| Microsoft 6% | ||
| Goldman Sachs 5% | ||
| Johnson & Johnson -6% | ||
| McDonald s -8% | ||
| Starbucks -9% | ||
| Apple -14% | ||
| Gilead -18% | ||
| Intel -32% | ||
| Boeing -35% | ||
| Quick: S&P 500 Stocks Lists: Performances & Trends, S&P 500 Stock Charts
Sort S&P 500 stocks: Daily, Weekly, Year-to-Date, Market Cap & Trends. Filter S&P 500 stocks list by sector: Show all, Tech, Finance, Energy, Staples, Retail, Industrial, Materials, Utilities and HealthCare |
| 12Stocks.com S&P 500 Stocks Performances & Trends Daily Report | |||||||||
|
| 
The overall Smart Investing & Trading Score is 26 (0-bearish to 100-bullish) which puts S&P 500 index in short term bearish to neutral trend. The Smart Investing & Trading Score from previous trading session is 36 and hence a deterioration of trend. | ||||||||
Here are the Smart Investing & Trading Scores of the most requested S&P 500 stocks at 12Stocks.com (click stock name for detailed review):
|


| 12Stocks.com: Top Performing S&P 500 Index Stocks | ||||||||||||||||||||||||||||||||||||||||||||||||
 The top performing S&P 500 Index stocks year to date are
Now, more recently, over last week, the top performing S&P 500 Index stocks on the move are


|
||||||||||||||||||||||||||||||||||||||||||||||||
| 12Stocks.com: Investing in S&P 500 Index with Stocks | |
|
The following table helps investors and traders sort through current performance and trends (as measured by Smart Investing & Trading Score) of various
stocks in the S&P 500 Index. Quick View: Move mouse or cursor over stock symbol (ticker) to view short-term technical chart and over stock name to view long term chart. Click on  to add stock symbol to your watchlist and to add stock symbol to your watchlist and  to view watchlist. Click on any ticker or stock name for detailed market intelligence report for that stock. to view watchlist. Click on any ticker or stock name for detailed market intelligence report for that stock. |
12Stocks.com Performance of Stocks in S&P 500 Index
| Ticker | Stock Name | Watchlist | Category | Recent Price | Smart Investing & Trading Score | Change % | Weekly Change% |
| UAL | United Airlines |   | Transports | 51.38 | 100 | -0.08% | 22.92% |
| UNH | UnitedHealth | | Health Care | 501.13 | 74 | 1.61% | 14.10% |
| GL | Globe Life | | Financials | 66.74 | 32 | 2.68% | 12.95% |
| GPC | Genuine Parts | | Services & Goods | 162.39 | 100 | 1.35% | 11.70% |
| SPXU | ProShares UltraPro | | Utilities | 38.33 | 74 | 2.68% | 9.95% |
| AAL | American Airlines | | Transports | 14.11 | 42 | 0.64% | 7.30% |
| WFC | Wells Fargo | | Financials | 60.35 | 100 | 2.74% | 6.87% |
| LUV | Southwest Airlines | | Transports | 29.38 | 67 | 1.10% | 6.68% |
| MTB | M&T Bank | | Financials | 143.38 | 85 | 2.93% | 6.55% |
| GIS | General Mills | | Consumer Staples | 70.42 | 93 | 1.93% | 6.37% |
| CNC | Centene | | Health Care | 75.15 | 67 | 1.90% | 6.25% |
| VFC | V.F | | Consumer Staples | 12.83 | 47 | 1.26% | 5.95% |
| AXP | American Express | | Financials | 231.04 | 95 | 6.23% | 5.88% |
| BG | Bunge | | Consumer Staples | 109.52 | 100 | 2.83% | 5.54% |
| PM | Philip Morris | | Consumer Staples | 93.77 | 100 | 2.82% | 5.54% |
| PGR | Progressive | | Financials | 214.69 | 95 | 2.36% | 5.29% |
| MS | Morgan Stanley | | Financials | 90.66 | 73 | 0.44% | 5.19% |
| KHC | Kraft Heinz | | Consumer Staples | 37.78 | 100 | 1.81% | 5.12% |
| HUM | Humana | | Health Care | 328.33 | 49 | 1.08% | 5.04% |
| SO | Southern | | Utilities | 72.15 | 93 | 2.24% | 4.98% |
| LULU | Lululemon Athletica | | Consumer Staples | 352.47 | 42 | 1.43% | 4.86% |
| SCHW | Charles Schwab | | Financials | 73.42 | 93 | 0.67% | 4.84% |
| SJM | J. M. | | Consumer Staples | 114.76 | 42 | 3.29% | 4.70% |
| CAG | Conagra Brands | | Consumer Staples | 30.62 | 100 | 0.86% | 4.47% |
| CPB | Campbell Soup | | Consumer Staples | 44.20 | 60 | 1.12% | 4.47% |
| For chart view version of above stock list: Chart View ➞ 0 - 25 , 25 - 50 , 50 - 75 , 75 - 100 , 100 - 125 , 125 - 150 , 150 - 175 , 175 - 200 , 200 - 225 , 225 - 250 , 250 - 275 , 275 - 300 , 300 - 325 , 325 - 350 , 350 - 375 , 375 - 400 , 400 - 425 , 425 - 450 , 450 - 475 , 475 - 500 | ||
 | Click To Change The Sort Order: By Market Cap or Company Size Performance: Year-to-date, Week and Day |  |
|
Get the most comprehensive stock market coverage daily at 12Stocks.com ➞ Best Stocks Today ➞ Best Stocks Weekly ➞ Best Stocks Year-to-Date ➞ Best Stocks Trends ➞  Best Stocks Today 12Stocks.com Best Nasdaq Stocks ➞ Best S&P 500 Stocks ➞ Best Tech Stocks ➞ Best Biotech Stocks ➞ |
| Detailed Overview of S&P 500 Stocks |
| S&P 500 Technical Overview, Leaders & Laggards, Top S&P 500 ETF Funds & Detailed S&P 500 Stocks List, Charts, Trends & More |
| S&P 500: Technical Analysis, Trends & YTD Performance | |
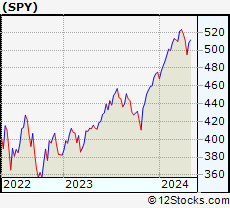
| S&P 500 index as represented by
SPY, an exchange-traded fund [ETF], holds basket of five hundred (mostly largecap) stocks from across all major sectors of the US stock market. The S&P 500 index (contains stocks like Apple and Exxon) is up by 4.18% and is currently outperforming the overall market by 0.8% year-to-date. Below is a quick view of technical charts and trends: | |
 SPY Weekly Chart |
|
| Long Term Trend: Good | |
| Medium Term Trend: Not Good | |
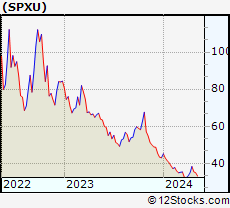
 SPY Daily Chart |
|
| Short Term Trend: Not Good | |
| Overall Trend Score: 26 | |
| YTD Performance: 4.18% | |
| **Trend Scores & Views Are Only For Educational Purposes And Not For Investing | |
| 12Stocks.com: Investing in S&P 500 Index using Exchange Traded Funds | |
|
The following table shows list of key exchange traded funds (ETF) that
help investors track S&P 500 index. The following list also includes leveraged ETF funds that track twice or thrice the daily returns of S&P 500 indices. Short or inverse ETF funds move in the opposite direction to the index they track and are useful during market pullbacks or during bear markets. Quick View: Move mouse or cursor over ETF symbol (ticker) to view short-term technical chart and over ETF name to view long term chart. Click on ticker or stock name for detailed view. Click on to add stock symbol to your watchlist and to view watchlist. |
12Stocks.com List of ETFs that track S&P 500 Index
| Ticker | ETF Name | Watchlist | Recent Price | Smart Investing & Trading Score | Change % | Week % | Year-to-date % |
| SPY | SPDR S&P 500 ETF | | 495.16 | 26 | -0.87 | -3.07 | 4.18% |
| IVV | iShares Core S&P 500 ETF | | 497.53 | 26 | -0.87 | -3.07 | 4.17% |
| VOO | Vanguard 500 ETF | | 455.10 | 26 | -0.84 | -3.08 | 4.19% |
| OEF | iShares S&P 100 | | 234.68 | 26 | -1.24 | -3.48 | 5.05% |
| SSO | ProShares Ultra S&P500 | | 69.11 | 26 | -1.73 | -6.18 | 6.21% |
| UPRO | ProShares UltraPro S&P500 | | 59.16 | 26 | -2.67 | -9.26 | 8.07% |
| SPXL | Direxion Daily S&P500 Bull 3X ETF | | 112.55 | 26 | -2.58 | -9.12 | 8.23% |
| SH | ProShares Short S&P500 | | 12.59 | 74 | 0.96 | 3.28 | -3.08% |
| SDS | ProShares UltraShort S&P500 | | 27.90 | 74 | 1.79 | 6.61 | -6.75% |
| SPXU | ProShares UltraPro Short S&P500 | | 38.33 | 74 | 2.68 | 9.95 | -10.86% |
| SPXS | Direxion Daily S&P 500 Bear 3X ETF | | 10.36 | 69 | 2.47 | 9.98 | -10.3% |
| 12Stocks.com: Charts, Trends, Fundamental Data and Performances of S&P 500 Stocks | |
|
We now take in-depth look at all S&P 500 stocks including charts, multi-period performances and overall trends (as measured by Smart Investing & Trading Score). One can sort S&P 500 stocks (click link to choose) by Daily, Weekly and by Year-to-Date performances. Also, one can sort by size of the company or by market capitalization. |
| Select Your Default Chart Type: | |||||
| |||||
| Click on stock symbol or name for detailed view. Click on to add stock symbol to your watchlist and to view watchlist. Quick View: Move mouse or cursor over "Daily" to quickly view daily technical stock chart and over "Weekly" to view weekly technical stock chart. | |||||

 | UAL United Airlines Holdings, Inc. |
| Sector: Transports | |
| SubSector: Major Airlines | |
| MarketCap: 8083.25 Millions | |
| Recent Price: 51.38 Smart Investing & Trading Score: 100 | |
| Day Percent Change: -0.08% Day Change: -0.04 | |
| Week Change: 22.92% Year-to-date Change: 24.5% | |
| UAL Links: Profile News Message Board | |
| Charts:- Daily , Weekly | |
| Add UAL to Watchlist: View: Get UAL Trend Analysis ➞ | |
 | UNH UnitedHealth Group Incorporated |
| Sector: Health Care | |
| SubSector: Health Care Plans | |
| MarketCap: 217384 Millions | |
| Recent Price: 501.13 Smart Investing & Trading Score: 74 | |
| Day Percent Change: 1.61% Day Change: 7.95 | |
| Week Change: 14.1% Year-to-date Change: -4.8% | |
| UNH Links: Profile News Message Board | |
| Charts:- Daily , Weekly | |
| Add UNH to Watchlist: View: Get UNH Trend Analysis ➞ | |
 | GL Globe Life Inc. |
| Sector: Financials | |
| SubSector: Life Insurance | |
| MarketCap: 7596.46 Millions | |
| Recent Price: 66.74 Smart Investing & Trading Score: 32 | |
| Day Percent Change: 2.68% Day Change: 1.74 | |
| Week Change: 12.95% Year-to-date Change: -45.2% | |
| GL Links: Profile News Message Board | |
| Charts:- Daily , Weekly | |
| Add GL to Watchlist: View: Get GL Trend Analysis ➞ | |
 | GPC Genuine Parts Company |
| Sector: Services & Goods | |
| SubSector: Auto Parts Stores | |
| MarketCap: 8605.9 Millions | |
| Recent Price: 162.39 Smart Investing & Trading Score: 100 | |
| Day Percent Change: 1.35% Day Change: 2.16 | |
| Week Change: 11.7% Year-to-date Change: 17.3% | |
| GPC Links: Profile News Message Board | |
| Charts:- Daily , Weekly | |
| Add GPC to Watchlist: View: Get GPC Trend Analysis ➞ | |
 | SPXU ProShares UltraPro Short S&P500 |
| Sector: Utilities | |
| SubSector: Exchange Traded Fund | |
| MarketCap: 0 Millions | |
| Recent Price: 38.33 Smart Investing & Trading Score: 74 | |
| Day Percent Change: 2.68% Day Change: 1.00 | |
| Week Change: 9.95% Year-to-date Change: -10.9% | |
| SPXU Links: Profile News Message Board | |
| Charts:- Daily , Weekly | |
| Add SPXU to Watchlist: View: Get SPXU Trend Analysis ➞ | |
 | AAL American Airlines Group Inc. |
| Sector: Transports | |
| SubSector: Major Airlines | |
| MarketCap: 5346.45 Millions | |
| Recent Price: 14.11 Smart Investing & Trading Score: 42 | |
| Day Percent Change: 0.64% Day Change: 0.09 | |
| Week Change: 7.3% Year-to-date Change: 2.7% | |
| AAL Links: Profile News Message Board | |
| Charts:- Daily , Weekly | |
| Add AAL to Watchlist: View: Get AAL Trend Analysis ➞ | |
 | WFC Wells Fargo & Company |
| Sector: Financials | |
| SubSector: Money Center Banks | |
| MarketCap: 129138 Millions | |
| Recent Price: 60.35 Smart Investing & Trading Score: 100 | |
| Day Percent Change: 2.74% Day Change: 1.61 | |
| Week Change: 6.87% Year-to-date Change: 22.6% | |
| WFC Links: Profile News Message Board | |
| Charts:- Daily , Weekly | |
| Add WFC to Watchlist: View: Get WFC Trend Analysis ➞ | |
 | LUV Southwest Airlines Co. |
| Sector: Transports | |
| SubSector: Regional Airlines | |
| MarketCap: 19463.3 Millions | |
| Recent Price: 29.38 Smart Investing & Trading Score: 67 | |
| Day Percent Change: 1.10% Day Change: 0.32 | |
| Week Change: 6.68% Year-to-date Change: 1.7% | |
| LUV Links: Profile News Message Board | |
| Charts:- Daily , Weekly | |
| Add LUV to Watchlist: View: Get LUV Trend Analysis ➞ | |
 | MTB M&T Bank Corporation |
| Sector: Financials | |
| SubSector: Regional - Northeast Banks | |
| MarketCap: 13950.9 Millions | |
| Recent Price: 143.38 Smart Investing & Trading Score: 85 | |
| Day Percent Change: 2.93% Day Change: 4.08 | |
| Week Change: 6.55% Year-to-date Change: 4.6% | |
| MTB Links: Profile News Message Board | |
| Charts:- Daily , Weekly | |
| Add MTB to Watchlist: View: Get MTB Trend Analysis ➞ | |
 | GIS General Mills, Inc. |
| Sector: Consumer Staples | |
| SubSector: Processed & Packaged Goods | |
| MarketCap: 34131.7 Millions | |
| Recent Price: 70.42 Smart Investing & Trading Score: 93 | |
| Day Percent Change: 1.93% Day Change: 1.33 | |
| Week Change: 6.37% Year-to-date Change: 8.1% | |
| GIS Links: Profile News Message Board | |
| Charts:- Daily , Weekly | |
| Add GIS to Watchlist: View: Get GIS Trend Analysis ➞ | |
 | CNC Centene Corporation |
| Sector: Health Care | |
| SubSector: Health Care Plans | |
| MarketCap: 29075 Millions | |
| Recent Price: 75.15 Smart Investing & Trading Score: 67 | |
| Day Percent Change: 1.90% Day Change: 1.40 | |
| Week Change: 6.25% Year-to-date Change: 1.3% | |
| CNC Links: Profile News Message Board | |
| Charts:- Daily , Weekly | |
| Add CNC to Watchlist: View: Get CNC Trend Analysis ➞ | |
 | VFC V.F. Corporation |
| Sector: Consumer Staples | |
| SubSector: Textile - Apparel Clothing | |
| MarketCap: 23607.5 Millions | |
| Recent Price: 12.83 Smart Investing & Trading Score: 47 | |
| Day Percent Change: 1.26% Day Change: 0.16 | |
| Week Change: 5.95% Year-to-date Change: -31.8% | |
| VFC Links: Profile News Message Board | |
| Charts:- Daily , Weekly | |
| Add VFC to Watchlist: View: Get VFC Trend Analysis ➞ | |
 | AXP American Express Company |
| Sector: Financials | |
| SubSector: Credit Services | |
| MarketCap: 68388 Millions | |
| Recent Price: 231.04 Smart Investing & Trading Score: 95 | |
| Day Percent Change: 6.23% Day Change: 13.54 | |
| Week Change: 5.88% Year-to-date Change: 23.3% | |
| AXP Links: Profile News Message Board | |
| Charts:- Daily , Weekly | |
| Add AXP to Watchlist: View: Get AXP Trend Analysis ➞ | |
 | BG Bunge Limited |
| Sector: Consumer Staples | |
| SubSector: Farm Products | |
| MarketCap: 4975.77 Millions | |
| Recent Price: 109.52 Smart Investing & Trading Score: 100 | |
| Day Percent Change: 2.83% Day Change: 3.01 | |
| Week Change: 5.54% Year-to-date Change: 8.5% | |
| BG Links: Profile News Message Board | |
| Charts:- Daily , Weekly | |
| Add BG to Watchlist: View: Get BG Trend Analysis ➞ | |
 | PM Philip Morris International Inc. |
| Sector: Consumer Staples | |
| SubSector: Cigarettes | |
| MarketCap: 105035 Millions | |
| Recent Price: 93.77 Smart Investing & Trading Score: 100 | |
| Day Percent Change: 2.82% Day Change: 2.57 | |
| Week Change: 5.54% Year-to-date Change: -0.3% | |
| PM Links: Profile News Message Board | |
| Charts:- Daily , Weekly | |
| Add PM to Watchlist: View: Get PM Trend Analysis ➞ | |
 | PGR The Progressive Corporation |
| Sector: Financials | |
| SubSector: Property & Casualty Insurance | |
| MarketCap: 43112 Millions | |
| Recent Price: 214.69 Smart Investing & Trading Score: 95 | |
| Day Percent Change: 2.36% Day Change: 4.94 | |
| Week Change: 5.29% Year-to-date Change: 34.8% | |
| PGR Links: Profile News Message Board | |
| Charts:- Daily , Weekly | |
| Add PGR to Watchlist: View: Get PGR Trend Analysis ➞ | |
 | MS Morgan Stanley |
| Sector: Financials | |
| SubSector: Investment Brokerage - National | |
| MarketCap: 55876.7 Millions | |
| Recent Price: 90.66 Smart Investing & Trading Score: 73 | |
| Day Percent Change: 0.44% Day Change: 0.40 | |
| Week Change: 5.19% Year-to-date Change: -2.8% | |
| MS Links: Profile News Message Board | |
| Charts:- Daily , Weekly | |
| Add MS to Watchlist: View: Get MS Trend Analysis ➞ | |
 | KHC The Kraft Heinz Company |
| Sector: Consumer Staples | |
| SubSector: Food - Major Diversified | |
| MarketCap: 32096.3 Millions | |
| Recent Price: 37.78 Smart Investing & Trading Score: 100 | |
| Day Percent Change: 1.81% Day Change: 0.67 | |
| Week Change: 5.12% Year-to-date Change: 2.2% | |
| KHC Links: Profile News Message Board | |
| Charts:- Daily , Weekly | |
| Add KHC to Watchlist: View: Get KHC Trend Analysis ➞ | |
 | HUM Humana Inc. |
| Sector: Health Care | |
| SubSector: Health Care Plans | |
| MarketCap: 34125.6 Millions | |
| Recent Price: 328.33 Smart Investing & Trading Score: 49 | |
| Day Percent Change: 1.08% Day Change: 3.50 | |
| Week Change: 5.04% Year-to-date Change: -28.3% | |
| HUM Links: Profile News Message Board | |
| Charts:- Daily , Weekly | |
| Add HUM to Watchlist: View: Get HUM Trend Analysis ➞ | |
 | SO The Southern Company |
| Sector: Utilities | |
| SubSector: Electric Utilities | |
| MarketCap: 54483.6 Millions | |
| Recent Price: 72.15 Smart Investing & Trading Score: 93 | |
| Day Percent Change: 2.24% Day Change: 1.58 | |
| Week Change: 4.98% Year-to-date Change: 2.9% | |
| SO Links: Profile News Message Board | |
| Charts:- Daily , Weekly | |
| Add SO to Watchlist: View: Get SO Trend Analysis ➞ | |
 | LULU Lululemon Athletica Inc. |
| Sector: Consumer Staples | |
| SubSector: Textile - Apparel Clothing | |
| MarketCap: 24627.8 Millions | |
| Recent Price: 352.47 Smart Investing & Trading Score: 42 | |
| Day Percent Change: 1.43% Day Change: 4.96 | |
| Week Change: 4.86% Year-to-date Change: -31.1% | |
| LULU Links: Profile News Message Board | |
| Charts:- Daily , Weekly | |
| Add LULU to Watchlist: View: Get LULU Trend Analysis ➞ | |
 | SCHW The Charles Schwab Corporation |
| Sector: Financials | |
| SubSector: Investment Brokerage - National | |
| MarketCap: 45115.8 Millions | |
| Recent Price: 73.42 Smart Investing & Trading Score: 93 | |
| Day Percent Change: 0.67% Day Change: 0.49 | |
| Week Change: 4.84% Year-to-date Change: 6.7% | |
| SCHW Links: Profile News Message Board | |
| Charts:- Daily , Weekly | |
| Add SCHW to Watchlist: View: Get SCHW Trend Analysis ➞ | |
 | SJM The J. M. Smucker Company |
| Sector: Consumer Staples | |
| SubSector: Processed & Packaged Goods | |
| MarketCap: 12635.8 Millions | |
| Recent Price: 114.76 Smart Investing & Trading Score: 42 | |
| Day Percent Change: 3.29% Day Change: 3.66 | |
| Week Change: 4.7% Year-to-date Change: -9.2% | |
| SJM Links: Profile News Message Board | |
| Charts:- Daily , Weekly | |
| Add SJM to Watchlist: View: Get SJM Trend Analysis ➞ | |
 | CAG Conagra Brands, Inc. |
| Sector: Consumer Staples | |
| SubSector: Processed & Packaged Goods | |
| MarketCap: 14084.1 Millions | |
| Recent Price: 30.62 Smart Investing & Trading Score: 100 | |
| Day Percent Change: 0.86% Day Change: 0.26 | |
| Week Change: 4.47% Year-to-date Change: 6.8% | |
| CAG Links: Profile News Message Board | |
| Charts:- Daily , Weekly | |
| Add CAG to Watchlist: View: Get CAG Trend Analysis ➞ | |
 | CPB Campbell Soup Company |
| Sector: Consumer Staples | |
| SubSector: Processed & Packaged Goods | |
| MarketCap: 14468.8 Millions | |
| Recent Price: 44.20 Smart Investing & Trading Score: 60 | |
| Day Percent Change: 1.12% Day Change: 0.49 | |
| Week Change: 4.47% Year-to-date Change: 2.2% | |
| CPB Links: Profile News Message Board | |
| Charts:- Daily , Weekly | |
| Add CPB to Watchlist: View: Get CPB Trend Analysis ➞ | |
| For tabular summary view of above stock list: Summary View ➞ 0 - 25 , 25 - 50 , 50 - 75 , 75 - 100 , 100 - 125 , 125 - 150 , 150 - 175 , 175 - 200 , 200 - 225 , 225 - 250 , 250 - 275 , 275 - 300 , 300 - 325 , 325 - 350 , 350 - 375 , 375 - 400 , 400 - 425 , 425 - 450 , 450 - 475 , 475 - 500 | ||
| Click To Change The Sort Order: By Market Cap or Company Size Performance: Year-to-date, Week and Day | |
| Select Chart Type: | ||
|
Best Stocks Today 12Stocks.com |
© 2024 12Stocks.com Terms & Conditions Privacy Contact Us
All Information Provided Only For Education And Not To Be Used For Investing or Trading. See Terms & Conditions


One More Thing ... Get Best Stocks Delivered Daily!
Never Ever Miss A Move With Our Top Ten Stocks Lists
Find Best Stocks In Any Market - Bull or Bear Market
Take A Peek At Our Top Ten Stocks Lists: Daily, Weekly, Year-to-Date & Top Trends
Find Best Stocks In Any Market - Bull or Bear Market
Take A Peek At Our Top Ten Stocks Lists: Daily, Weekly, Year-to-Date & Top Trends
S&P 500 Stocks With Best Up Trends [0-bearish to 100-bullish]: Kinder Morgan[100], Entergy [100], Bunge [100], Philip Morris[100], Wells Fargo[100], Dominion [100], Duke [100], Tyson Foods[100], Kraft Heinz[100], Lockheed Martin[100], Genuine Parts[100]
Best S&P 500 Stocks Year-to-Date:
Constellation [54.47%], NVIDIA [53.87%], Meta Platforms[35.89%], NRG [35.34%], Progressive [34.79%], Marathon [32.37%], Targa Resources[29.99%], Diamondback [29.44%], Western Digital[26.12%], Valero [26.07%], Eaton [25.83%] Best S&P 500 Stocks This Week:
United Airlines[22.92%], UnitedHealth [14.1%], Globe Life[12.95%], Genuine Parts[11.7%], ProShares UltraPro[9.95%], American Airlines[7.3%], Wells Fargo[6.87%], Southwest Airlines[6.68%], M&T Bank[6.55%], General Mills[6.37%], Centene [6.25%] Best S&P 500 Stocks Daily:
American Express[6.23%], Fifth Third[5.93%], Walgreens Boots[3.70%], Kinder Morgan[3.46%], Bank of America[3.35%], Citizens Financial[3.31%], J. M.[3.29%], Truist Financial[3.05%], PNC Financial[2.98%], M&T Bank[2.93%], Entergy [2.91%]