
 Login Sign Up


| |||||
 |  | ||||

| 12Stocks.com Market Intelligence |
Best S&P 500 Stocks
|
On this page, you will find the most comprehensive analysis of S&P 500 stocks and ETFs - from latest trends to performances to charts ➞. First, here are the year-to-date (YTD) performances of the most requested S&P 500 stocks at 12Stocks.com (click stock for review):
| NVIDIA 82% | ||
| Amazon.com 24% | ||
| Google 22% | ||
| Merck 19% | ||
| Caterpillar 16% | ||
| Walmart 15% | ||
| Goldman Sachs 15% | ||
| JPMorgan Chase 13% | ||
| Microsoft 10% | ||
| Chevron 9% | ||
| Johnson & Johnson -5% | ||
| Apple -5% | ||
| McDonald s -10% | ||
| Gilead -19% | ||
| Starbucks -23% | ||
| Boeing -32% | ||
| Intel -41% | ||
| Quick: S&P 500 Stocks Lists: Performances & Trends, S&P 500 Stock Charts
Sort S&P 500 stocks: Daily, Weekly, Year-to-Date, Market Cap & Trends. Filter S&P 500 stocks list by sector: Show all, Tech, Finance, Energy, Staples, Retail, Industrial, Materials, Utilities and HealthCare |
| 12Stocks.com S&P 500 Stocks Performances & Trends Daily Report | |||||||||
|
| 
The overall Smart Investing & Trading Score is 88 (0-bearish to 100-bullish) which puts S&P 500 index in short term bullish trend. The Smart Investing & Trading Score from previous trading session is 95 and hence a deterioration of trend. | ||||||||
Here are the Smart Investing & Trading Scores of the most requested S&P 500 stocks at 12Stocks.com (click stock name for detailed review):
|


| 12Stocks.com: Top Performing S&P 500 Index Stocks | ||||||||||||||||||||||||||||||||||||||||||||||||
 The top performing S&P 500 Index stocks year to date are
Now, more recently, over last week, the top performing S&P 500 Index stocks on the move are


|
||||||||||||||||||||||||||||||||||||||||||||||||
| 12Stocks.com: Investing in S&P 500 Index with Stocks | |
|
The following table helps investors and traders sort through current performance and trends (as measured by Smart Investing & Trading Score) of various
stocks in the S&P 500 Index. Quick View: Move mouse or cursor over stock symbol (ticker) to view short-term technical chart and over stock name to view long term chart. Click on  to add stock symbol to your watchlist and to add stock symbol to your watchlist and  to view watchlist. Click on any ticker or stock name for detailed market intelligence report for that stock. to view watchlist. Click on any ticker or stock name for detailed market intelligence report for that stock. |
12Stocks.com Performance of Stocks in S&P 500 Index
| Ticker | Stock Name | Watchlist | Category | Recent Price | Smart Investing & Trading Score | Change % | Weekly Change% |
| DD | DuPont de |   | Materials | 78.85 | 88 | -0.55% | 1.52% |
| PKG | Packaging | | Consumer Staples | 178.89 | 57 | -0.15% | 1.49% |
| BKR | Baker Hughes | | Services & Goods | 32.40 | 51 | 0.86% | 1.49% |
| YUM | Yum! Brands | | Services & Goods | 136.31 | 25 | 0.29% | 1.47% |
| SO | Southern | | Utilities | 76.97 | 95 | 0.02% | 1.47% |
| XEL | Xcel | | Utilities | 55.03 | 93 | 0.03% | 1.45% |
| AMCR | Amcor | | Consumer Staples | 10.15 | 81 | 0.35% | 1.45% |
| HPE | Hewlett Packard | | Technology | 17.11 | 59 | 1.45% | 1.45% |
| GS | Goldman Sachs | | Financials | 444.47 | 83 | 0.15% | 1.44% |
| CB | Chubb | | Financials | 252.11 | 77 | 0.06% | 1.44% |
| ALB | Albemarle | | Materials | 129.95 | 57 | -1.22% | 1.44% |
| TDY | Teledyne Technologies | | Technology | 390.85 | 42 | -0.56% | 1.43% |
| PPL | PPL | | Utilities | 28.49 | 83 | 0.49% | 1.42% |
| BLK | BlackRock | | Financials | 774.79 | 57 | -0.78% | 1.42% |
| LIN | Linde | | Materials | 429.56 | 32 | -0.11% | 1.41% |
| BWA | BorgWarner | | Consumer Staples | 36.95 | 81 | 0.41% | 1.40% |
| ALL | Allstate | | Financials | 170.53 | 56 | 1.39% | 1.39% |
| FDS | FactSet Research | | Technology | 434.22 | 50 | -0.28% | 1.39% |
| FANG | Diamondback | | Energy | 204.29 | 83 | 0.30% | 1.38% |
| C | Citi | | Financials | 62.35 | 68 | 0.57% | 1.36% |
| NKE | NIKE | | Consumer Staples | 93.40 | 35 | -0.41% | 1.36% |
| L | Loews | | Financials | 77.44 | 83 | -0.48% | 1.36% |
| CVX | Chevron | | Energy | 162.42 | 76 | -0.15% | 1.35% |
| MAA | Mid-America Apartment | | Financials | 134.77 | 83 | -1.04% | 1.33% |
| MET | MetLife | | Financials | 71.45 | 64 | 0.27% | 1.32% |
| For chart view version of above stock list: Chart View ➞ 0 - 25 , 25 - 50 , 50 - 75 , 75 - 100 , 100 - 125 , 125 - 150 , 150 - 175 , 175 - 200 , 200 - 225 , 225 - 250 , 250 - 275 , 275 - 300 , 300 - 325 , 325 - 350 , 350 - 375 , 375 - 400 , 400 - 425 , 425 - 450 , 450 - 475 , 475 - 500 | ||
 | Click To Change The Sort Order: By Market Cap or Company Size Performance: Year-to-date, Week and Day |  |
|
Get the most comprehensive stock market coverage daily at 12Stocks.com ➞ Best Stocks Today ➞ Best Stocks Weekly ➞ Best Stocks Year-to-Date ➞ Best Stocks Trends ➞  Best Stocks Today 12Stocks.com Best Nasdaq Stocks ➞ Best S&P 500 Stocks ➞ Best Tech Stocks ➞ Best Biotech Stocks ➞ |
| Detailed Overview of S&P 500 Stocks |
| S&P 500 Technical Overview, Leaders & Laggards, Top S&P 500 ETF Funds & Detailed S&P 500 Stocks List, Charts, Trends & More |
| S&P 500: Technical Analysis, Trends & YTD Performance | |
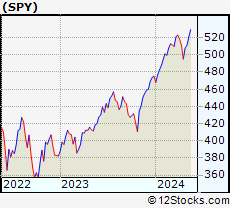
| S&P 500 index as represented by
SPY, an exchange-traded fund [ETF], holds basket of five hundred (mostly largecap) stocks from across all major sectors of the US stock market. The S&P 500 index (contains stocks like Apple and Exxon) is up by 8.8% and is currently outperforming the overall market by 0.71% year-to-date. Below is a quick view of technical charts and trends: | |
 SPY Weekly Chart |
|
| Long Term Trend: Good | |
| Medium Term Trend: Very Good | |
 SPY Daily Chart |
|
| Short Term Trend: Very Good | |
| Overall Trend Score: 88 | |
| YTD Performance: 8.8% | |
| **Trend Scores & Views Are Only For Educational Purposes And Not For Investing | |
| 12Stocks.com: Investing in S&P 500 Index using Exchange Traded Funds | |
|
The following table shows list of key exchange traded funds (ETF) that
help investors track S&P 500 index. The following list also includes leveraged ETF funds that track twice or thrice the daily returns of S&P 500 indices. Short or inverse ETF funds move in the opposite direction to the index they track and are useful during market pullbacks or during bear markets. Quick View: Move mouse or cursor over ETF symbol (ticker) to view short-term technical chart and over ETF name to view long term chart. Click on ticker or stock name for detailed view. Click on to add stock symbol to your watchlist and to view watchlist. |
12Stocks.com List of ETFs that track S&P 500 Index
| Ticker | ETF Name | Watchlist | Recent Price | Smart Investing & Trading Score | Change % | Week % | Year-to-date % |
| SPY | SPDR S&P 500 ETF | | 517.12 | 88 | 0.00 | 1.14 | 8.8% |
| IVV | iShares Core S&P 500 ETF | | 519.01 | 88 | -0.16 | 1.01 | 8.66% |
| VOO | Vanguard 500 ETF | | 474.53 | 88 | -0.18 | 0.97 | 8.64% |
| OEF | iShares S&P 100 | | 246.70 | 88 | 0.11 | 1.21 | 10.43% |
| SSO | ProShares Ultra S&P500 | | 75.14 | 88 | 0.05 | 2.29 | 15.48% |
| UPRO | ProShares UltraPro S&P500 | | 66.84 | 88 | -0.07 | 3.32 | 22.1% |
| SPXL | Direxion Daily S&P500 Bull 3X ETF | | 126.32 | 88 | -0.61 | 2.82 | 21.47% |
| SH | ProShares Short S&P500 | | 12.10 | 22 | 0.04 | -1.1 | -6.89% |
| SDS | ProShares UltraShort S&P500 | | 25.65 | 12 | -0.04 | -2.29 | -14.27% |
| SPXU | ProShares UltraPro Short S&P500 | | 33.78 | 12 | 0.15 | -3.18 | -21.44% |
| SPXS | Direxion Daily S&P 500 Bear 3X ETF | | 9.18 | 7 | 0.49 | -3.01 | -20.56% |
| 12Stocks.com: Charts, Trends, Fundamental Data and Performances of S&P 500 Stocks | |
|
We now take in-depth look at all S&P 500 stocks including charts, multi-period performances and overall trends (as measured by Smart Investing & Trading Score). One can sort S&P 500 stocks (click link to choose) by Daily, Weekly and by Year-to-Date performances. Also, one can sort by size of the company or by market capitalization. |
| Select Your Default Chart Type: | |||||
| |||||
| Click on stock symbol or name for detailed view. Click on to add stock symbol to your watchlist and to view watchlist. Quick View: Move mouse or cursor over "Daily" to quickly view daily technical stock chart and over "Weekly" to view weekly technical stock chart. | |||||

 | DD DuPont de Nemours, Inc. |
| Sector: Materials | |
| SubSector: Agricultural Chemicals | |
| MarketCap: 25631.6 Millions | |
| Recent Price: 78.85 Smart Investing & Trading Score: 88 | |
| Day Percent Change: -0.55% Day Change: -0.44 | |
| Week Change: 1.52% Year-to-date Change: 2.5% | |
| DD Links: Profile News Message Board | |
| Charts:- Daily , Weekly | |
| Add DD to Watchlist: View: Get DD Trend Analysis ➞ | |
 | PKG Packaging Corporation of America |
| Sector: Consumer Staples | |
| SubSector: Packaging & Containers | |
| MarketCap: 8963 Millions | |
| Recent Price: 178.89 Smart Investing & Trading Score: 57 | |
| Day Percent Change: -0.15% Day Change: -0.26 | |
| Week Change: 1.49% Year-to-date Change: 9.8% | |
| PKG Links: Profile News Message Board | |
| Charts:- Daily , Weekly | |
| Add PKG to Watchlist: View: Get PKG Trend Analysis ➞ | |
 | BKR Baker Hughes Company |
| Sector: Services & Goods | |
| SubSector: Technical Services | |
| MarketCap: 1330 Millions | |
| Recent Price: 32.40 Smart Investing & Trading Score: 51 | |
| Day Percent Change: 0.86% Day Change: 0.28 | |
| Week Change: 1.49% Year-to-date Change: -5.2% | |
| BKR Links: Profile News Message Board | |
| Charts:- Daily , Weekly | |
| Add BKR to Watchlist: View: Get BKR Trend Analysis ➞ | |
 | YUM Yum! Brands, Inc. |
| Sector: Services & Goods | |
| SubSector: Restaurants | |
| MarketCap: 18033.3 Millions | |
| Recent Price: 136.31 Smart Investing & Trading Score: 25 | |
| Day Percent Change: 0.29% Day Change: 0.40 | |
| Week Change: 1.47% Year-to-date Change: 4.3% | |
| YUM Links: Profile News Message Board | |
| Charts:- Daily , Weekly | |
| Add YUM to Watchlist: View: Get YUM Trend Analysis ➞ | |
 | SO The Southern Company |
| Sector: Utilities | |
| SubSector: Electric Utilities | |
| MarketCap: 54483.6 Millions | |
| Recent Price: 76.97 Smart Investing & Trading Score: 95 | |
| Day Percent Change: 0.02% Day Change: 0.02 | |
| Week Change: 1.47% Year-to-date Change: 9.8% | |
| SO Links: Profile News Message Board | |
| Charts:- Daily , Weekly | |
| Add SO to Watchlist: View: Get SO Trend Analysis ➞ | |
 | XEL Xcel Energy Inc. |
| Sector: Utilities | |
| SubSector: Electric Utilities | |
| MarketCap: 28960.8 Millions | |
| Recent Price: 55.03 Smart Investing & Trading Score: 93 | |
| Day Percent Change: 0.03% Day Change: 0.01 | |
| Week Change: 1.45% Year-to-date Change: -11.1% | |
| XEL Links: Profile News Message Board | |
| Charts:- Daily , Weekly | |
| Add XEL to Watchlist: View: Get XEL Trend Analysis ➞ | |
 | AMCR Amcor plc |
| Sector: Consumer Staples | |
| SubSector: Packaging & Containers | |
| MarketCap: 13964 Millions | |
| Recent Price: 10.15 Smart Investing & Trading Score: 81 | |
| Day Percent Change: 0.35% Day Change: 0.04 | |
| Week Change: 1.45% Year-to-date Change: 5.3% | |
| AMCR Links: Profile News Message Board | |
| Charts:- Daily , Weekly | |
| Add AMCR to Watchlist: View: Get AMCR Trend Analysis ➞ | |
 | HPE Hewlett Packard Enterprise Company |
| Sector: Technology | |
| SubSector: Communication Equipment | |
| MarketCap: 12886.1 Millions | |
| Recent Price: 17.11 Smart Investing & Trading Score: 59 | |
| Day Percent Change: 1.45% Day Change: 0.25 | |
| Week Change: 1.45% Year-to-date Change: 0.7% | |
| HPE Links: Profile News Message Board | |
| Charts:- Daily , Weekly | |
| Add HPE to Watchlist: View: Get HPE Trend Analysis ➞ | |
 | GS The Goldman Sachs Group, Inc. |
| Sector: Financials | |
| SubSector: Investment Brokerage - National | |
| MarketCap: 54579.3 Millions | |
| Recent Price: 444.47 Smart Investing & Trading Score: 83 | |
| Day Percent Change: 0.15% Day Change: 0.67 | |
| Week Change: 1.44% Year-to-date Change: 15.2% | |
| GS Links: Profile News Message Board | |
| Charts:- Daily , Weekly | |
| Add GS to Watchlist: View: Get GS Trend Analysis ➞ | |
 | CB Chubb Limited |
| Sector: Financials | |
| SubSector: Property & Casualty Insurance | |
| MarketCap: 51615.9 Millions | |
| Recent Price: 252.11 Smart Investing & Trading Score: 77 | |
| Day Percent Change: 0.06% Day Change: 0.16 | |
| Week Change: 1.44% Year-to-date Change: 11.6% | |
| CB Links: Profile News Message Board | |
| Charts:- Daily , Weekly | |
| Add CB to Watchlist: View: Get CB Trend Analysis ➞ | |
 | ALB Albemarle Corporation |
| Sector: Materials | |
| SubSector: Specialty Chemicals | |
| MarketCap: 6139.27 Millions | |
| Recent Price: 129.95 Smart Investing & Trading Score: 57 | |
| Day Percent Change: -1.22% Day Change: -1.60 | |
| Week Change: 1.44% Year-to-date Change: -10.1% | |
| ALB Links: Profile News Message Board | |
| Charts:- Daily , Weekly | |
| Add ALB to Watchlist: View: Get ALB Trend Analysis ➞ | |
 | TDY Teledyne Technologies Incorporated |
| Sector: Technology | |
| SubSector: Scientific & Technical Instruments | |
| MarketCap: 9360.43 Millions | |
| Recent Price: 390.85 Smart Investing & Trading Score: 42 | |
| Day Percent Change: -0.56% Day Change: -2.18 | |
| Week Change: 1.43% Year-to-date Change: -12.4% | |
| TDY Links: Profile News Message Board | |
| Charts:- Daily , Weekly | |
| Add TDY to Watchlist: View: Get TDY Trend Analysis ➞ | |
 | PPL PPL Corporation |
| Sector: Utilities | |
| SubSector: Electric Utilities | |
| MarketCap: 16588.8 Millions | |
| Recent Price: 28.49 Smart Investing & Trading Score: 83 | |
| Day Percent Change: 0.49% Day Change: 0.14 | |
| Week Change: 1.42% Year-to-date Change: 5.1% | |
| PPL Links: Profile News Message Board | |
| Charts:- Daily , Weekly | |
| Add PPL to Watchlist: View: Get PPL Trend Analysis ➞ | |
 | BLK BlackRock, Inc. |
| Sector: Financials | |
| SubSector: Asset Management | |
| MarketCap: 61284.9 Millions | |
| Recent Price: 774.79 Smart Investing & Trading Score: 57 | |
| Day Percent Change: -0.78% Day Change: -6.13 | |
| Week Change: 1.42% Year-to-date Change: -4.6% | |
| BLK Links: Profile News Message Board | |
| Charts:- Daily , Weekly | |
| Add BLK to Watchlist: View: Get BLK Trend Analysis ➞ | |
 | LIN Linde plc |
| Sector: Materials | |
| SubSector: Specialty Chemicals | |
| MarketCap: 88539.2 Millions | |
| Recent Price: 429.56 Smart Investing & Trading Score: 32 | |
| Day Percent Change: -0.11% Day Change: -0.48 | |
| Week Change: 1.41% Year-to-date Change: 4.6% | |
| LIN Links: Profile News Message Board | |
| Charts:- Daily , Weekly | |
| Add LIN to Watchlist: View: Get LIN Trend Analysis ➞ | |
 | BWA BorgWarner Inc. |
| Sector: Consumer Staples | |
| SubSector: Auto Parts | |
| MarketCap: 4604.09 Millions | |
| Recent Price: 36.95 Smart Investing & Trading Score: 81 | |
| Day Percent Change: 0.41% Day Change: 0.15 | |
| Week Change: 1.4% Year-to-date Change: 3.1% | |
| BWA Links: Profile News Message Board | |
| Charts:- Daily , Weekly | |
| Add BWA to Watchlist: View: Get BWA Trend Analysis ➞ | |
 | ALL The Allstate Corporation |
| Sector: Financials | |
| SubSector: Property & Casualty Insurance | |
| MarketCap: 25916.6 Millions | |
| Recent Price: 170.53 Smart Investing & Trading Score: 56 | |
| Day Percent Change: 1.39% Day Change: 2.34 | |
| Week Change: 1.39% Year-to-date Change: 21.8% | |
| ALL Links: Profile News Message Board | |
| Charts:- Daily , Weekly | |
| Add ALL to Watchlist: View: Get ALL Trend Analysis ➞ | |
 | FDS FactSet Research Systems Inc. |
| Sector: Technology | |
| SubSector: Information & Delivery Services | |
| MarketCap: 9024.37 Millions | |
| Recent Price: 434.22 Smart Investing & Trading Score: 50 | |
| Day Percent Change: -0.28% Day Change: -1.24 | |
| Week Change: 1.39% Year-to-date Change: -9.0% | |
| FDS Links: Profile News Message Board | |
| Charts:- Daily , Weekly | |
| Add FDS to Watchlist: View: Get FDS Trend Analysis ➞ | |
 | FANG Diamondback Energy, Inc. |
| Sector: Energy | |
| SubSector: Independent Oil & Gas | |
| MarketCap: 3009.13 Millions | |
| Recent Price: 204.29 Smart Investing & Trading Score: 83 | |
| Day Percent Change: 0.30% Day Change: 0.60 | |
| Week Change: 1.38% Year-to-date Change: 31.7% | |
| FANG Links: Profile News Message Board | |
| Charts:- Daily , Weekly | |
| Add FANG to Watchlist: View: Get FANG Trend Analysis ➞ | |
 | C Citigroup Inc. |
| Sector: Financials | |
| SubSector: Money Center Banks | |
| MarketCap: 94128 Millions | |
| Recent Price: 62.35 Smart Investing & Trading Score: 68 | |
| Day Percent Change: 0.57% Day Change: 0.35 | |
| Week Change: 1.36% Year-to-date Change: 21.2% | |
| C Links: Profile News Message Board | |
| Charts:- Daily , Weekly | |
| Add C to Watchlist: View: Get C Trend Analysis ➞ | |
 | NKE NIKE, Inc. |
| Sector: Consumer Staples | |
| SubSector: Textile - Apparel Footwear & Accessories | |
| MarketCap: 118918 Millions | |
| Recent Price: 93.40 Smart Investing & Trading Score: 35 | |
| Day Percent Change: -0.41% Day Change: -0.38 | |
| Week Change: 1.36% Year-to-date Change: -14.0% | |
| NKE Links: Profile News Message Board | |
| Charts:- Daily , Weekly | |
| Add NKE to Watchlist: View: Get NKE Trend Analysis ➞ | |
 | L Loews Corporation |
| Sector: Financials | |
| SubSector: Property & Casualty Insurance | |
| MarketCap: 10768.2 Millions | |
| Recent Price: 77.44 Smart Investing & Trading Score: 83 | |
| Day Percent Change: -0.48% Day Change: -0.37 | |
| Week Change: 1.36% Year-to-date Change: 11.3% | |
| L Links: Profile News Message Board | |
| Charts:- Daily , Weekly | |
| Add L to Watchlist: View: Get L Trend Analysis ➞ | |
 | CVX Chevron Corporation |
| Sector: Energy | |
| SubSector: Major Integrated Oil & Gas | |
| MarketCap: 121521 Millions | |
| Recent Price: 162.42 Smart Investing & Trading Score: 76 | |
| Day Percent Change: -0.15% Day Change: -0.25 | |
| Week Change: 1.35% Year-to-date Change: 8.9% | |
| CVX Links: Profile News Message Board | |
| Charts:- Daily , Weekly | |
| Add CVX to Watchlist: View: Get CVX Trend Analysis ➞ | |
 | MAA Mid-America Apartment Communities, Inc. |
| Sector: Financials | |
| SubSector: REIT - Residential | |
| MarketCap: 11385.5 Millions | |
| Recent Price: 134.77 Smart Investing & Trading Score: 83 | |
| Day Percent Change: -1.04% Day Change: -1.42 | |
| Week Change: 1.33% Year-to-date Change: 0.2% | |
| MAA Links: Profile News Message Board | |
| Charts:- Daily , Weekly | |
| Add MAA to Watchlist: View: Get MAA Trend Analysis ➞ | |
 | MET MetLife, Inc. |
| Sector: Financials | |
| SubSector: Life Insurance | |
| MarketCap: 26272.9 Millions | |
| Recent Price: 71.45 Smart Investing & Trading Score: 64 | |
| Day Percent Change: 0.27% Day Change: 0.19 | |
| Week Change: 1.32% Year-to-date Change: 8.0% | |
| MET Links: Profile News Message Board | |
| Charts:- Daily , Weekly | |
| Add MET to Watchlist: View: Get MET Trend Analysis ➞ | |
| For tabular summary view of above stock list: Summary View ➞ 0 - 25 , 25 - 50 , 50 - 75 , 75 - 100 , 100 - 125 , 125 - 150 , 150 - 175 , 175 - 200 , 200 - 225 , 225 - 250 , 250 - 275 , 275 - 300 , 300 - 325 , 325 - 350 , 350 - 375 , 375 - 400 , 400 - 425 , 425 - 450 , 450 - 475 , 475 - 500 | ||
| Click To Change The Sort Order: By Market Cap or Company Size Performance: Year-to-date, Week and Day | |
| Select Chart Type: | ||
|
Best Stocks Today 12Stocks.com |
© 2024 12Stocks.com Terms & Conditions Privacy Contact Us
All Information Provided Only For Education And Not To Be Used For Investing or Trading. See Terms & Conditions


One More Thing ... Get Best Stocks Delivered Daily!
Never Ever Miss A Move With Our Top Ten Stocks Lists
Find Best Stocks In Any Market - Bull or Bear Market
Take A Peek At Our Top Ten Stocks Lists: Daily, Weekly, Year-to-Date & Top Trends
Find Best Stocks In Any Market - Bull or Bear Market
Take A Peek At Our Top Ten Stocks Lists: Daily, Weekly, Year-to-Date & Top Trends
S&P 500 Stocks With Best Up Trends [0-bearish to 100-bullish]: Flavors[100], Fox [100], HP [100], Twenty-First Century[100], Arch Capital[100], NetApp [100], Agilent Technologies[100], Dow [100], Progressive [100], Motorola Solutions[100], Principal Financial[100]
Best S&P 500 Stocks Year-to-Date:
NVIDIA [82.42%], Constellation [74.89%], NRG [47.83%], Micron [40.24%], Chipotle Mexican[40.11%], Eaton [37.91%], Western Digital[37.16%], Progressive [36.45%], Meta Platforms[33.86%], Leidos Holdings[33.78%], Arch Capital[33.71%] Best S&P 500 Stocks This Week:
Globe Life[12.71%], Flavors[11.87%], Henry Schein[7.53%], Paper[7.17%], FMC [7.03%], Kenvue [6.88%], Arista Networks[6.55%], Netflix [6.3%], Vertex [5.87%], Charter [5.66%], Eli Lilly[5.39%] Best S&P 500 Stocks Daily:
Arista Networks[6.71%], Charter [4.85%], NRG [4.13%], Vertex [3.51%], Comcast [3.20%], Emerson Electric[2.93%], Flavors[2.75%], Globe Life[2.64%], Henry Schein[2.37%], Norwegian Cruise[2.31%], Kenvue [2.19%]