
 Login Sign Up


| |||||
 |  | ||||

| 12Stocks.com Market Intelligence |
Best S&P 500 Stocks
|
On this page, you will find the most comprehensive analysis of S&P 500 stocks and ETFs - from latest trends to performances to charts ➞. First, here are the year-to-date (YTD) performances of the most requested S&P 500 stocks at 12Stocks.com (click stock for review):
| NVIDIA 66% | ||
| Caterpillar 23% | ||
| Amazon.com 17% | ||
| Merck 17% | ||
| Google 13% | ||
| JPMorgan Chase 13% | ||
| Walmart 12% | ||
| Goldman Sachs 9% | ||
| Chevron 8% | ||
| Microsoft 8% | ||
| Johnson & Johnson -5% | ||
| McDonald s -7% | ||
| Starbucks -8% | ||
| Apple -13% | ||
| Gilead -17% | ||
| Intel -31% | ||
| Boeing -35% | ||
| Quick: S&P 500 Stocks Lists: Performances & Trends, S&P 500 Stock Charts
Sort S&P 500 stocks: Daily, Weekly, Year-to-Date, Market Cap & Trends. Filter S&P 500 stocks list by sector: Show all, Tech, Finance, Energy, Staples, Retail, Industrial, Materials, Utilities and HealthCare |
| 12Stocks.com S&P 500 Stocks Performances & Trends Daily Report | |||||||||
|
| 
The overall Smart Investing & Trading Score is 58 (0-bearish to 100-bullish) which puts S&P 500 index in short term neutral trend. The Smart Investing & Trading Score from previous trading session is 51 and hence an improvement of trend. | ||||||||
Here are the Smart Investing & Trading Scores of the most requested S&P 500 stocks at 12Stocks.com (click stock name for detailed review):
|


| 12Stocks.com: Top Performing S&P 500 Index Stocks | ||||||||||||||||||||||||||||||||||||||||||||||||
 The top performing S&P 500 Index stocks year to date are
Now, more recently, over last week, the top performing S&P 500 Index stocks on the move are


|
||||||||||||||||||||||||||||||||||||||||||||||||
| 12Stocks.com: Investing in S&P 500 Index with Stocks | |
|
The following table helps investors and traders sort through current performance and trends (as measured by Smart Investing & Trading Score) of various
stocks in the S&P 500 Index. Quick View: Move mouse or cursor over stock symbol (ticker) to view short-term technical chart and over stock name to view long term chart. Click on  to add stock symbol to your watchlist and to add stock symbol to your watchlist and  to view watchlist. Click on any ticker or stock name for detailed market intelligence report for that stock. to view watchlist. Click on any ticker or stock name for detailed market intelligence report for that stock. |
12Stocks.com Performance of Stocks in S&P 500 Index
| Ticker | Stock Name | Watchlist | Category | Recent Price | Smart Investing & Trading Score | Change % | Weekly Change% |
| BLK | BlackRock |   | Financials | 766.10 | 32 | 0.79% | 2.15% |
| RJF | Raymond James | | Financials | 126.25 | 75 | 0.61% | 2.14% |
| IT | Gartner | | Technology | 449.82 | 25 | 1.53% | 2.14% |
| D | Dominion | | Utilities | 50.90 | 100 | 0.53% | 2.13% |
| IRM | Iron Mountain | | Technology | 76.66 | 70 | 1.07% | 2.08% |
| LVS | Las Vegas | | Services & Goods | 46.40 | 32 | -0.34% | 2.07% |
| CHD | Church & Dwight Co | | Consumer Staples | 106.51 | 100 | 0.52% | 2.07% |
| CL | Colgate-Palmolive | | Consumer Staples | 88.94 | 90 | 0.68% | 2.07% |
| SRE | Sempra | | Utilities | 71.53 | 82 | 0.56% | 2.07% |
| CZR | Caesars Entertainment | | Services & Goods | 38.99 | 32 | 1.48% | 2.07% |
| WHR | Whirlpool | | Consumer Staples | 106.82 | 42 | 1.31% | 2.05% |
| WFC | Wells Fargo | | Financials | 61.59 | 100 | 0.79% | 2.05% |
| TXT | Textron | | Industrials | 95.21 | 75 | 1.54% | 2.05% |
| CPRT | Copart | | Services & Goods | 53.95 | 58 | 1.21% | 2.01% |
| AOS | A. O. | | Industrials | 87.77 | 83 | 1.00% | 1.97% |
| FTNT | Fortinet | | Technology | 64.65 | 55 | 1.51% | 1.97% |
| NVR | NVR | | Industrials | 7836.01 | 63 | 0.37% | 1.96% |
| PG | Procter & Gamble | | Consumer Staples | 161.23 | 100 | 0.43% | 1.95% |
| LLY | Eli Lilly | | Health Care | 740.37 | 43 | 1.24% | 1.94% |
| FITB | Fifth Third | | Financials | 36.95 | 100 | 1.09% | 1.93% |
| CMI | Cummins | | Industrials | 293.12 | 61 | 0.94% | 1.93% |
| WY | Weyerhaeuser | | Industrials | 32.08 | 32 | 1.92% | 1.92% |
| ABBV | AbbVie | | Health Care | 169.57 | 73 | 1.00% | 1.90% |
| TDY | Teledyne Technologies | | Technology | 408.93 | 49 | 1.20% | 1.89% |
| XYL | Xylem | | Industrials | 130.26 | 90 | 0.99% | 1.89% |
| For chart view version of above stock list: Chart View ➞ 0 - 25 , 25 - 50 , 50 - 75 , 75 - 100 , 100 - 125 , 125 - 150 , 150 - 175 , 175 - 200 , 200 - 225 , 225 - 250 , 250 - 275 , 275 - 300 , 300 - 325 , 325 - 350 , 350 - 375 , 375 - 400 , 400 - 425 , 425 - 450 , 450 - 475 | ||
 | Click To Change The Sort Order: By Market Cap or Company Size Performance: Year-to-date, Week and Day |  |
|
Get the most comprehensive stock market coverage daily at 12Stocks.com ➞ Best Stocks Today ➞ Best Stocks Weekly ➞ Best Stocks Year-to-Date ➞ Best Stocks Trends ➞  Best Stocks Today 12Stocks.com Best Nasdaq Stocks ➞ Best S&P 500 Stocks ➞ Best Tech Stocks ➞ Best Biotech Stocks ➞ |
| Detailed Overview of S&P 500 Stocks |
| S&P 500 Technical Overview, Leaders & Laggards, Top S&P 500 ETF Funds & Detailed S&P 500 Stocks List, Charts, Trends & More |
| S&P 500: Technical Analysis, Trends & YTD Performance | |
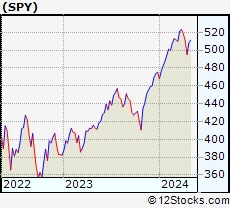
| S&P 500 index as represented by
SPY, an exchange-traded fund [ETF], holds basket of five hundred (mostly largecap) stocks from across all major sectors of the US stock market. The S&P 500 index (contains stocks like Apple and Exxon) is up by 6.12% and is currently outperforming the overall market by 0.63% year-to-date. Below is a quick view of technical charts and trends: | |
 SPY Weekly Chart |
|
| Long Term Trend: Good | |
| Medium Term Trend: Not Good | |
 SPY Daily Chart |
|
| Short Term Trend: Very Good | |
| Overall Trend Score: 58 | |
| YTD Performance: 6.12% | |
| **Trend Scores & Views Are Only For Educational Purposes And Not For Investing | |
| 12Stocks.com: Investing in S&P 500 Index using Exchange Traded Funds | |
|
The following table shows list of key exchange traded funds (ETF) that
help investors track S&P 500 index. The following list also includes leveraged ETF funds that track twice or thrice the daily returns of S&P 500 indices. Short or inverse ETF funds move in the opposite direction to the index they track and are useful during market pullbacks or during bear markets. Quick View: Move mouse or cursor over ETF symbol (ticker) to view short-term technical chart and over ETF name to view long term chart. Click on ticker or stock name for detailed view. Click on to add stock symbol to your watchlist and to view watchlist. |
12Stocks.com List of ETFs that track S&P 500 Index
| Ticker | ETF Name | Watchlist | Recent Price | Smart Investing & Trading Score | Change % | Week % | Year-to-date % |
| SPY | SPDR S&P 500 ETF | | 504.40 | 58 | 0.94 | 1.87 | 6.12% |
| IVV | iShares Core S&P 500 ETF | | 506.60 | 58 | 1.69 | 1.82 | 6.06% |
| VOO | Vanguard 500 ETF | | 463.37 | 58 | 1.70 | 1.82 | 6.08% |
| OEF | iShares S&P 100 | | 239.30 | 51 | 1.05 | 1.97 | 7.12% |
| SSO | ProShares Ultra S&P500 | | 71.67 | 58 | 1.91 | 3.7 | 10.14% |
| UPRO | ProShares UltraPro S&P500 | | 62.46 | 58 | 2.81 | 5.58 | 14.1% |
| SPXL | Direxion Daily S&P500 Bull 3X ETF | | 118.62 | 58 | 2.75 | 5.39 | 14.07% |
| SH | ProShares Short S&P500 | | 12.35 | 42 | -1.12 | -1.91 | -4.93% |
| SDS | ProShares UltraShort S&P500 | | 26.81 | 37 | -2.19 | -3.91 | -10.39% |
| SPXU | ProShares UltraPro Short S&P500 | | 36.10 | 42 | -3.31 | -5.8 | -16.03% |
| SPXS | Direxion Daily S&P 500 Bear 3X ETF | | 9.82 | 32 | -4.75 | -5.21 | -14.98% |
| 12Stocks.com: Charts, Trends, Fundamental Data and Performances of S&P 500 Stocks | |
|
We now take in-depth look at all S&P 500 stocks including charts, multi-period performances and overall trends (as measured by Smart Investing & Trading Score). One can sort S&P 500 stocks (click link to choose) by Daily, Weekly and by Year-to-Date performances. Also, one can sort by size of the company or by market capitalization. |
| Select Your Default Chart Type: | |||||
| |||||
| Click on stock symbol or name for detailed view. Click on to add stock symbol to your watchlist and to view watchlist. Quick View: Move mouse or cursor over "Daily" to quickly view daily technical stock chart and over "Weekly" to view weekly technical stock chart. | |||||

 | BLK BlackRock, Inc. |
| Sector: Financials | |
| SubSector: Asset Management | |
| MarketCap: 61284.9 Millions | |
| Recent Price: 766.10 Smart Investing & Trading Score: 32 | |
| Day Percent Change: 0.79% Day Change: 5.99 | |
| Week Change: 2.15% Year-to-date Change: -5.6% | |
| BLK Links: Profile News Message Board | |
| Charts:- Daily , Weekly | |
| Add BLK to Watchlist: View: Get BLK Trend Analysis ➞ | |
 | RJF Raymond James Financial, Inc. |
| Sector: Financials | |
| SubSector: Investment Brokerage - Regional | |
| MarketCap: 9490.65 Millions | |
| Recent Price: 126.25 Smart Investing & Trading Score: 75 | |
| Day Percent Change: 0.61% Day Change: 0.77 | |
| Week Change: 2.14% Year-to-date Change: 13.2% | |
| RJF Links: Profile News Message Board | |
| Charts:- Daily , Weekly | |
| Add RJF to Watchlist: View: Get RJF Trend Analysis ➞ | |
 | IT Gartner, Inc. |
| Sector: Technology | |
| SubSector: Information Technology Services | |
| MarketCap: 7767.98 Millions | |
| Recent Price: 449.82 Smart Investing & Trading Score: 25 | |
| Day Percent Change: 1.53% Day Change: 6.76 | |
| Week Change: 2.14% Year-to-date Change: -0.3% | |
| IT Links: Profile News Message Board | |
| Charts:- Daily , Weekly | |
| Add IT to Watchlist: View: Get IT Trend Analysis ➞ | |
 | D Dominion Energy, Inc. |
| Sector: Utilities | |
| SubSector: Electric Utilities | |
| MarketCap: 62365.3 Millions | |
| Recent Price: 50.90 Smart Investing & Trading Score: 100 | |
| Day Percent Change: 0.53% Day Change: 0.27 | |
| Week Change: 2.13% Year-to-date Change: 8.3% | |
| D Links: Profile News Message Board | |
| Charts:- Daily , Weekly | |
| Add D to Watchlist: View: Get D Trend Analysis ➞ | |
 | IRM Iron Mountain Incorporated |
| Sector: Technology | |
| SubSector: Business Software & Services | |
| MarketCap: 7339.18 Millions | |
| Recent Price: 76.66 Smart Investing & Trading Score: 70 | |
| Day Percent Change: 1.07% Day Change: 0.81 | |
| Week Change: 2.08% Year-to-date Change: 9.6% | |
| IRM Links: Profile News Message Board | |
| Charts:- Daily , Weekly | |
| Add IRM to Watchlist: View: Get IRM Trend Analysis ➞ | |
 | LVS Las Vegas Sands Corp. |
| Sector: Services & Goods | |
| SubSector: Resorts & Casinos | |
| MarketCap: 36431.6 Millions | |
| Recent Price: 46.40 Smart Investing & Trading Score: 32 | |
| Day Percent Change: -0.34% Day Change: -0.16 | |
| Week Change: 2.07% Year-to-date Change: -5.7% | |
| LVS Links: Profile News Message Board | |
| Charts:- Daily , Weekly | |
| Add LVS to Watchlist: View: Get LVS Trend Analysis ➞ | |
 | CHD Church & Dwight Co., Inc. |
| Sector: Consumer Staples | |
| SubSector: Cleaning Products | |
| MarketCap: 17425.7 Millions | |
| Recent Price: 106.51 Smart Investing & Trading Score: 100 | |
| Day Percent Change: 0.52% Day Change: 0.55 | |
| Week Change: 2.07% Year-to-date Change: 12.6% | |
| CHD Links: Profile News Message Board | |
| Charts:- Daily , Weekly | |
| Add CHD to Watchlist: View: Get CHD Trend Analysis ➞ | |
 | CL Colgate-Palmolive Company |
| Sector: Consumer Staples | |
| SubSector: Personal Products | |
| MarketCap: 57242.7 Millions | |
| Recent Price: 88.94 Smart Investing & Trading Score: 90 | |
| Day Percent Change: 0.68% Day Change: 0.61 | |
| Week Change: 2.07% Year-to-date Change: 11.6% | |
| CL Links: Profile News Message Board | |
| Charts:- Daily , Weekly | |
| Add CL to Watchlist: View: Get CL Trend Analysis ➞ | |
 | SRE Sempra Energy |
| Sector: Utilities | |
| SubSector: Diversified Utilities | |
| MarketCap: 34339.9 Millions | |
| Recent Price: 71.53 Smart Investing & Trading Score: 82 | |
| Day Percent Change: 0.56% Day Change: 0.40 | |
| Week Change: 2.07% Year-to-date Change: -4.3% | |
| SRE Links: Profile News Message Board | |
| Charts:- Daily , Weekly | |
| Add SRE to Watchlist: View: Get SRE Trend Analysis ➞ | |
 | CZR Caesars Entertainment Corporation |
| Sector: Services & Goods | |
| SubSector: Resorts & Casinos | |
| MarketCap: 4618.44 Millions | |
| Recent Price: 38.99 Smart Investing & Trading Score: 32 | |
| Day Percent Change: 1.48% Day Change: 0.57 | |
| Week Change: 2.07% Year-to-date Change: -16.8% | |
| CZR Links: Profile News Message Board | |
| Charts:- Daily , Weekly | |
| Add CZR to Watchlist: View: Get CZR Trend Analysis ➞ | |
 | WHR Whirlpool Corporation |
| Sector: Consumer Staples | |
| SubSector: Appliances | |
| MarketCap: 5015.08 Millions | |
| Recent Price: 106.82 Smart Investing & Trading Score: 42 | |
| Day Percent Change: 1.31% Day Change: 1.38 | |
| Week Change: 2.05% Year-to-date Change: -12.3% | |
| WHR Links: Profile News Message Board | |
| Charts:- Daily , Weekly | |
| Add WHR to Watchlist: View: Get WHR Trend Analysis ➞ | |
 | WFC Wells Fargo & Company |
| Sector: Financials | |
| SubSector: Money Center Banks | |
| MarketCap: 129138 Millions | |
| Recent Price: 61.59 Smart Investing & Trading Score: 100 | |
| Day Percent Change: 0.79% Day Change: 0.48 | |
| Week Change: 2.05% Year-to-date Change: 25.1% | |
| WFC Links: Profile News Message Board | |
| Charts:- Daily , Weekly | |
| Add WFC to Watchlist: View: Get WFC Trend Analysis ➞ | |
 | TXT Textron Inc. |
| Sector: Industrials | |
| SubSector: Aerospace/Defense - Major Diversified | |
| MarketCap: 6123.09 Millions | |
| Recent Price: 95.21 Smart Investing & Trading Score: 75 | |
| Day Percent Change: 1.54% Day Change: 1.44 | |
| Week Change: 2.05% Year-to-date Change: 18.4% | |
| TXT Links: Profile News Message Board | |
| Charts:- Daily , Weekly | |
| Add TXT to Watchlist: View: Get TXT Trend Analysis ➞ | |
 | CPRT Copart, Inc. |
| Sector: Services & Goods | |
| SubSector: Auto Dealerships | |
| MarketCap: 15462.1 Millions | |
| Recent Price: 53.95 Smart Investing & Trading Score: 58 | |
| Day Percent Change: 1.21% Day Change: 0.65 | |
| Week Change: 2.01% Year-to-date Change: 10.1% | |
| CPRT Links: Profile News Message Board | |
| Charts:- Daily , Weekly | |
| Add CPRT to Watchlist: View: Get CPRT Trend Analysis ➞ | |
 | AOS A. O. Smith Corporation |
| Sector: Industrials | |
| SubSector: Industrial Electrical Equipment | |
| MarketCap: 5809.89 Millions | |
| Recent Price: 87.77 Smart Investing & Trading Score: 83 | |
| Day Percent Change: 1.00% Day Change: 0.86 | |
| Week Change: 1.97% Year-to-date Change: 6.5% | |
| AOS Links: Profile News Message Board | |
| Charts:- Daily , Weekly | |
| Add AOS to Watchlist: View: Get AOS Trend Analysis ➞ | |
 | FTNT Fortinet, Inc. |
| Sector: Technology | |
| SubSector: Application Software | |
| MarketCap: 16993.8 Millions | |
| Recent Price: 64.65 Smart Investing & Trading Score: 55 | |
| Day Percent Change: 1.51% Day Change: 0.96 | |
| Week Change: 1.97% Year-to-date Change: 10.5% | |
| FTNT Links: Profile News Message Board | |
| Charts:- Daily , Weekly | |
| Add FTNT to Watchlist: View: Get FTNT Trend Analysis ➞ | |
 | NVR NVR, Inc. |
| Sector: Industrials | |
| SubSector: Residential Construction | |
| MarketCap: 9912.56 Millions | |
| Recent Price: 7836.01 Smart Investing & Trading Score: 63 | |
| Day Percent Change: 0.37% Day Change: 29.22 | |
| Week Change: 1.96% Year-to-date Change: 11.9% | |
| NVR Links: Profile News Message Board | |
| Charts:- Daily , Weekly | |
| Add NVR to Watchlist: View: Get NVR Trend Analysis ➞ | |
 | PG The Procter & Gamble Company |
| Sector: Consumer Staples | |
| SubSector: Personal Products | |
| MarketCap: 277162 Millions | |
| Recent Price: 161.23 Smart Investing & Trading Score: 100 | |
| Day Percent Change: 0.43% Day Change: 0.69 | |
| Week Change: 1.95% Year-to-date Change: 10.0% | |
| PG Links: Profile News Message Board | |
| Charts:- Daily , Weekly | |
| Add PG to Watchlist: View: Get PG Trend Analysis ➞ | |
 | LLY Eli Lilly and Company |
| Sector: Health Care | |
| SubSector: Drug Manufacturers - Major | |
| MarketCap: 130066 Millions | |
| Recent Price: 740.37 Smart Investing & Trading Score: 43 | |
| Day Percent Change: 1.24% Day Change: 9.03 | |
| Week Change: 1.94% Year-to-date Change: 27.0% | |
| LLY Links: Profile News Message Board | |
| Charts:- Daily , Weekly | |
| Add LLY to Watchlist: View: Get LLY Trend Analysis ➞ | |
 | FITB Fifth Third Bancorp |
| Sector: Financials | |
| SubSector: Regional - Midwest Banks | |
| MarketCap: 10197 Millions | |
| Recent Price: 36.95 Smart Investing & Trading Score: 100 | |
| Day Percent Change: 1.09% Day Change: 0.40 | |
| Week Change: 1.93% Year-to-date Change: 7.1% | |
| FITB Links: Profile News Message Board | |
| Charts:- Daily , Weekly | |
| Add FITB to Watchlist: View: Get FITB Trend Analysis ➞ | |
 | CMI Cummins Inc. |
| Sector: Industrials | |
| SubSector: Diversified Machinery | |
| MarketCap: 19127.1 Millions | |
| Recent Price: 293.12 Smart Investing & Trading Score: 61 | |
| Day Percent Change: 0.94% Day Change: 2.72 | |
| Week Change: 1.93% Year-to-date Change: 22.4% | |
| CMI Links: Profile News Message Board | |
| Charts:- Daily , Weekly | |
| Add CMI to Watchlist: View: Get CMI Trend Analysis ➞ | |
 | WY Weyerhaeuser Company |
| Sector: Industrials | |
| SubSector: Lumber, Wood Production | |
| MarketCap: 13244.8 Millions | |
| Recent Price: 32.08 Smart Investing & Trading Score: 32 | |
| Day Percent Change: 1.92% Day Change: 0.61 | |
| Week Change: 1.92% Year-to-date Change: -7.8% | |
| WY Links: Profile News Message Board | |
| Charts:- Daily , Weekly | |
| Add WY to Watchlist: View: Get WY Trend Analysis ➞ | |
 | ABBV AbbVie Inc. |
| Sector: Health Care | |
| SubSector: Drug Manufacturers - Major | |
| MarketCap: 110080 Millions | |
| Recent Price: 169.57 Smart Investing & Trading Score: 73 | |
| Day Percent Change: 1.00% Day Change: 1.68 | |
| Week Change: 1.9% Year-to-date Change: 9.4% | |
| ABBV Links: Profile News Message Board | |
| Charts:- Daily , Weekly | |
| Add ABBV to Watchlist: View: Get ABBV Trend Analysis ➞ | |
 | TDY Teledyne Technologies Incorporated |
| Sector: Technology | |
| SubSector: Scientific & Technical Instruments | |
| MarketCap: 9360.43 Millions | |
| Recent Price: 408.93 Smart Investing & Trading Score: 49 | |
| Day Percent Change: 1.20% Day Change: 4.85 | |
| Week Change: 1.89% Year-to-date Change: -8.4% | |
| TDY Links: Profile News Message Board | |
| Charts:- Daily , Weekly | |
| Add TDY to Watchlist: View: Get TDY Trend Analysis ➞ | |
 | XYL Xylem Inc. |
| Sector: Industrials | |
| SubSector: Diversified Machinery | |
| MarketCap: 12195.1 Millions | |
| Recent Price: 130.26 Smart Investing & Trading Score: 90 | |
| Day Percent Change: 0.99% Day Change: 1.28 | |
| Week Change: 1.89% Year-to-date Change: 13.9% | |
| XYL Links: Profile News Message Board | |
| Charts:- Daily , Weekly | |
| Add XYL to Watchlist: View: Get XYL Trend Analysis ➞ | |
| For tabular summary view of above stock list: Summary View ➞ 0 - 25 , 25 - 50 , 50 - 75 , 75 - 100 , 100 - 125 , 125 - 150 , 150 - 175 , 175 - 200 , 200 - 225 , 225 - 250 , 250 - 275 , 275 - 300 , 300 - 325 , 325 - 350 , 350 - 375 , 375 - 400 , 400 - 425 , 425 - 450 , 450 - 475 | ||
| Click To Change The Sort Order: By Market Cap or Company Size Performance: Year-to-date, Week and Day | |
| Select Chart Type: | ||
|
Best Stocks Today 12Stocks.com |
© 2024 12Stocks.com Terms & Conditions Privacy Contact Us
All Information Provided Only For Education And Not To Be Used For Investing or Trading. See Terms & Conditions


One More Thing ... Get Best Stocks Delivered Daily!
Never Ever Miss A Move With Our Top Ten Stocks Lists
Find Best Stocks In Any Market - Bull or Bear Market
Take A Peek At Our Top Ten Stocks Lists: Daily, Weekly, Year-to-Date & Top Trends
Find Best Stocks In Any Market - Bull or Bear Market
Take A Peek At Our Top Ten Stocks Lists: Daily, Weekly, Year-to-Date & Top Trends
S&P 500 Stocks With Best Up Trends [0-bearish to 100-bullish]: Danaher [100], Kimberly-Clark [100], Quest Diagnostics[100], Philip Morris[100], NextEra [100], Generac Holdings[100], American Express[100], Equity Residential[100], Bank of America[100], EQT [100], Essex Property[100]
Best S&P 500 Stocks Year-to-Date:
NVIDIA [65.78%], Constellation [59.81%], Meta Platforms[38.84%], NRG [37.53%], Progressive [33.94%], Marathon [32.82%], Targa Resources[31.85%], Western Digital[31.75%], Micron [30.88%], United Airlines[30.85%], Diamondback [30.11%] Best S&P 500 Stocks This Week:
NVIDIA [7.74%], General Electric[7.36%], Enphase [7.28%], Kimberly-Clark [7.12%], Danaher [7.03%], General Motors[6.87%], Ford Motor[6.63%], Quest Diagnostics[6.08%], Pulte [5.96%], Charles River[5.72%], Illumina [5.69%] Best S&P 500 Stocks Daily:
Danaher [6.77%], General Electric[5.83%], Kimberly-Clark [5.38%], General Motors[4.79%], Quest Diagnostics[4.74%], United Rentals[4.51%], Waters [4.22%], Thermo Fisher[4.00%], Builders FirstSource[3.92%], Norwegian Cruise[3.75%], Bio-Rad [3.61%]