
 Login Sign Up


| |||||
 |  | ||||

| 12Stocks.com Market Intelligence |
Best S&P 500 Stocks
|
On this page, you will find the most comprehensive analysis of S&P 500 stocks and ETFs - from latest trends to performances to charts ➞. First, here are the year-to-date (YTD) performances of the most requested S&P 500 stocks at 12Stocks.com (click stock for review):
| NVIDIA 61% | ||
| Caterpillar 23% | ||
| Merck 16% | ||
| Amazon.com 16% | ||
| Walmart 14% | ||
| Google 14% | ||
| JPMorgan Chase 14% | ||
| Chevron 10% | ||
| Goldman Sachs 10% | ||
| Microsoft 9% | ||
| Johnson & Johnson -5% | ||
| McDonald s -7% | ||
| Starbucks -8% | ||
| Apple -12% | ||
| Gilead -17% | ||
| Intel -31% | ||
| Boeing -37% | ||
| Quick: S&P 500 Stocks Lists: Performances & Trends, S&P 500 Stock Charts
Sort S&P 500 stocks: Daily, Weekly, Year-to-Date, Market Cap & Trends. Filter S&P 500 stocks list by sector: Show all, Tech, Finance, Energy, Staples, Retail, Industrial, Materials, Utilities and HealthCare |
| 12Stocks.com S&P 500 Stocks Performances & Trends Daily Report | |||||||||
|
| 
The overall Smart Investing & Trading Score is 58 (0-bearish to 100-bullish) which puts S&P 500 index in short term neutral trend. The Smart Investing & Trading Score from previous trading session is 51 and an improvement of trend continues. | ||||||||
Here are the Smart Investing & Trading Scores of the most requested S&P 500 stocks at 12Stocks.com (click stock name for detailed review):
|


| 12Stocks.com: Top Performing S&P 500 Index Stocks | ||||||||||||||||||||||||||||||||||||||||||||||||
 The top performing S&P 500 Index stocks year to date are
Now, more recently, over last week, the top performing S&P 500 Index stocks on the move are


|
||||||||||||||||||||||||||||||||||||||||||||||||
| 12Stocks.com: Investing in S&P 500 Index with Stocks | |
|
The following table helps investors and traders sort through current performance and trends (as measured by Smart Investing & Trading Score) of various
stocks in the S&P 500 Index. Quick View: Move mouse or cursor over stock symbol (ticker) to view short-term technical chart and over stock name to view long term chart. Click on  to add stock symbol to your watchlist and to add stock symbol to your watchlist and  to view watchlist. Click on any ticker or stock name for detailed market intelligence report for that stock. to view watchlist. Click on any ticker or stock name for detailed market intelligence report for that stock. |
12Stocks.com Performance of Stocks in S&P 500 Index
| Ticker | Stock Name | Watchlist | Category | Recent Price | Smart Investing & Trading Score | Change % | Weekly Change% |
| ES | Eversource |   | Utilities | 60.84 | 93 | 0.81% | 1.93% |
| WMB | Williams | | Energy | 39.25 | 88 | 1.21% | 1.92% |
| NDAQ | Nasdaq | | Financials | 61.50 | 68 | 0.67% | 1.91% |
| VLO | Valero | | Energy | 167.00 | 68 | -0.32% | 1.90% |
| CNP | CenterPoint | | Utilities | 29.07 | 100 | 1.18% | 1.89% |
| PEP | PepsiCo | | Consumer Staples | 177.41 | 100 | 3.62% | 1.88% |
| AIZ | Assurant | | Financials | 177.05 | 65 | 0.42% | 1.85% |
| MAA | Mid-America Apartment | | Financials | 128.40 | 86 | 0.71% | 1.84% |
| T | AT&T | | Technology | 16.81 | 49 | 1.88% | 1.82% |
| EOG | EOG Resources | | Energy | 135.60 | 88 | 0.59% | 1.82% |
| ED | Consolidated Edison | | Utilities | 93.43 | 100 | 0.64% | 1.81% |
| KIM | Kimco Realty | | Financials | 18.53 | 50 | -0.54% | 1.81% |
| RHI | Robert Half | | Services & Goods | 71.50 | 42 | -0.04% | 1.81% |
| SNA | Snap-on | | Industrials | 273.59 | 32 | 0.83% | 1.78% |
| HOLX | Hologic | | Health Care | 76.71 | 68 | -0.62% | 1.76% |
| MCD | McDonald s | | Services & Goods | 276.75 | 57 | -0.05% | 1.75% |
| MCO | Moody s | | Services & Goods | 381.21 | 42 | -0.25% | 1.75% |
| VMC | Vulcan Materials | | Industrials | 256.40 | 58 | -1.13% | 1.72% |
| BLK | BlackRock | | Financials | 762.80 | 25 | -0.50% | 1.71% |
| GIS | General Mills | | Consumer Staples | 71.61 | 100 | 1.12% | 1.69% |
| SPG | Simon Property | | Financials | 142.81 | 51 | -0.67% | 1.69% |
| HSY | Hershey | | Consumer Staples | 188.14 | 49 | 0.57% | 1.69% |
| LRCX | Lam Research | | Technology | 884.89 | 58 | -0.29% | 1.68% |
| OKE | ONEOK | | Utilities | 80.95 | 90 | 0.75% | 1.66% |
| CMI | Cummins | | Industrials | 292.34 | 68 | -0.12% | 1.66% |
| For chart view version of above stock list: Chart View ➞ 0 - 25 , 25 - 50 , 50 - 75 , 75 - 100 , 100 - 125 , 125 - 150 , 150 - 175 , 175 - 200 , 200 - 225 , 225 - 250 , 250 - 275 , 275 - 300 , 300 - 325 , 325 - 350 , 350 - 375 , 375 - 400 , 400 - 425 , 425 - 450 , 450 - 475 , 475 - 500 | ||
 | Click To Change The Sort Order: By Market Cap or Company Size Performance: Year-to-date, Week and Day |  |
|
Get the most comprehensive stock market coverage daily at 12Stocks.com ➞ Best Stocks Today ➞ Best Stocks Weekly ➞ Best Stocks Year-to-Date ➞ Best Stocks Trends ➞  Best Stocks Today 12Stocks.com Best Nasdaq Stocks ➞ Best S&P 500 Stocks ➞ Best Tech Stocks ➞ Best Biotech Stocks ➞ |
| Detailed Overview of S&P 500 Stocks |
| S&P 500 Technical Overview, Leaders & Laggards, Top S&P 500 ETF Funds & Detailed S&P 500 Stocks List, Charts, Trends & More |
| S&P 500: Technical Analysis, Trends & YTD Performance | |
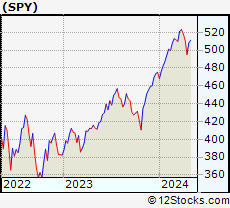
| S&P 500 index as represented by
SPY, an exchange-traded fund [ETF], holds basket of five hundred (mostly largecap) stocks from across all major sectors of the US stock market. The S&P 500 index (contains stocks like Apple and Exxon) is up by 6.33% and is currently outperforming the overall market by 0.67% year-to-date. Below is a quick view of technical charts and trends: | |
 SPY Weekly Chart |
|
| Long Term Trend: Good | |
| Medium Term Trend: Not Good | |
 SPY Daily Chart |
|
| Short Term Trend: Very Good | |
| Overall Trend Score: 58 | |
| YTD Performance: 6.33% | |
| **Trend Scores & Views Are Only For Educational Purposes And Not For Investing | |
| 12Stocks.com: Investing in S&P 500 Index using Exchange Traded Funds | |
|
The following table shows list of key exchange traded funds (ETF) that
help investors track S&P 500 index. The following list also includes leveraged ETF funds that track twice or thrice the daily returns of S&P 500 indices. Short or inverse ETF funds move in the opposite direction to the index they track and are useful during market pullbacks or during bear markets. Quick View: Move mouse or cursor over ETF symbol (ticker) to view short-term technical chart and over ETF name to view long term chart. Click on ticker or stock name for detailed view. Click on to add stock symbol to your watchlist and to view watchlist. |
12Stocks.com List of ETFs that track S&P 500 Index
| Ticker | ETF Name | Watchlist | Recent Price | Smart Investing & Trading Score | Change % | Week % | Year-to-date % |
| SPY | SPDR S&P 500 ETF | | 505.41 | 58 | -0.05 | 2.07 | 6.33% |
| IVV | iShares Core S&P 500 ETF | | 507.97 | 63 | -0.04 | 2.1 | 6.35% |
| VOO | Vanguard 500 ETF | | 464.50 | 63 | -0.07 | 2.07 | 6.34% |
| OEF | iShares S&P 100 | | 239.79 | 58 | -0.07 | 2.18 | 7.34% |
| SSO | ProShares Ultra S&P500 | | 71.95 | 58 | -0.12 | 4.11 | 10.57% |
| UPRO | ProShares UltraPro S&P500 | | 62.88 | 58 | -0.08 | 6.29 | 14.87% |
| SPXL | Direxion Daily S&P500 Bull 3X ETF | | 119.35 | 63 | -0.13 | 6.04 | 14.77% |
| SH | ProShares Short S&P500 | | 12.33 | 42 | -0.08 | -2.07 | -5.08% |
| SDS | ProShares UltraShort S&P500 | | 26.80 | 42 | 0.07 | -3.94 | -10.43% |
| SPXU | ProShares UltraPro Short S&P500 | | 36.04 | 42 | 0.14 | -5.97 | -16.19% |
| SPXS | Direxion Daily S&P 500 Bear 3X ETF | | 9.75 | 32 | 0.00 | -5.89 | -15.58% |
| 12Stocks.com: Charts, Trends, Fundamental Data and Performances of S&P 500 Stocks | |
|
We now take in-depth look at all S&P 500 stocks including charts, multi-period performances and overall trends (as measured by Smart Investing & Trading Score). One can sort S&P 500 stocks (click link to choose) by Daily, Weekly and by Year-to-Date performances. Also, one can sort by size of the company or by market capitalization. |
| Select Your Default Chart Type: | |||||
| |||||
| Click on stock symbol or name for detailed view. Click on to add stock symbol to your watchlist and to view watchlist. Quick View: Move mouse or cursor over "Daily" to quickly view daily technical stock chart and over "Weekly" to view weekly technical stock chart. | |||||

 | ES Eversource Energy |
| Sector: Utilities | |
| SubSector: Diversified Utilities | |
| MarketCap: 23963.4 Millions | |
| Recent Price: 60.84 Smart Investing & Trading Score: 93 | |
| Day Percent Change: 0.81% Day Change: 0.49 | |
| Week Change: 1.93% Year-to-date Change: -1.4% | |
| ES Links: Profile News Message Board | |
| Charts:- Daily , Weekly | |
| Add ES to Watchlist: View: Get ES Trend Analysis ➞ | |
 | WMB The Williams Companies, Inc. |
| Sector: Energy | |
| SubSector: Oil & Gas Pipelines | |
| MarketCap: 16851.5 Millions | |
| Recent Price: 39.25 Smart Investing & Trading Score: 88 | |
| Day Percent Change: 1.21% Day Change: 0.47 | |
| Week Change: 1.92% Year-to-date Change: 12.7% | |
| WMB Links: Profile News Message Board | |
| Charts:- Daily , Weekly | |
| Add WMB to Watchlist: View: Get WMB Trend Analysis ➞ | |
 | NDAQ Nasdaq, Inc. |
| Sector: Financials | |
| SubSector: Diversified Investments | |
| MarketCap: 14885.2 Millions | |
| Recent Price: 61.50 Smart Investing & Trading Score: 68 | |
| Day Percent Change: 0.67% Day Change: 0.41 | |
| Week Change: 1.91% Year-to-date Change: 5.8% | |
| NDAQ Links: Profile News Message Board | |
| Charts:- Daily , Weekly | |
| Add NDAQ to Watchlist: View: Get NDAQ Trend Analysis ➞ | |
 | VLO Valero Energy Corporation |
| Sector: Energy | |
| SubSector: Oil & Gas Refining & Marketing | |
| MarketCap: 19590.5 Millions | |
| Recent Price: 167.00 Smart Investing & Trading Score: 68 | |
| Day Percent Change: -0.32% Day Change: -0.54 | |
| Week Change: 1.9% Year-to-date Change: 28.5% | |
| VLO Links: Profile News Message Board | |
| Charts:- Daily , Weekly | |
| Add VLO to Watchlist: View: Get VLO Trend Analysis ➞ | |
 | CNP CenterPoint Energy, Inc. |
| Sector: Utilities | |
| SubSector: Gas Utilities | |
| MarketCap: 7444.07 Millions | |
| Recent Price: 29.07 Smart Investing & Trading Score: 100 | |
| Day Percent Change: 1.18% Day Change: 0.34 | |
| Week Change: 1.89% Year-to-date Change: 1.8% | |
| CNP Links: Profile News Message Board | |
| Charts:- Daily , Weekly | |
| Add CNP to Watchlist: View: Get CNP Trend Analysis ➞ | |
 | PEP PepsiCo, Inc. |
| Sector: Consumer Staples | |
| SubSector: Beverages - Soft Drinks | |
| MarketCap: 162458 Millions | |
| Recent Price: 177.41 Smart Investing & Trading Score: 100 | |
| Day Percent Change: 3.62% Day Change: 6.19 | |
| Week Change: 1.88% Year-to-date Change: 4.5% | |
| PEP Links: Profile News Message Board | |
| Charts:- Daily , Weekly | |
| Add PEP to Watchlist: View: Get PEP Trend Analysis ➞ | |
 | AIZ Assurant, Inc. |
| Sector: Financials | |
| SubSector: Accident & Health Insurance | |
| MarketCap: 6110.3 Millions | |
| Recent Price: 177.05 Smart Investing & Trading Score: 65 | |
| Day Percent Change: 0.42% Day Change: 0.74 | |
| Week Change: 1.85% Year-to-date Change: 5.1% | |
| AIZ Links: Profile News Message Board | |
| Charts:- Daily , Weekly | |
| Add AIZ to Watchlist: View: Get AIZ Trend Analysis ➞ | |
 | MAA Mid-America Apartment Communities, Inc. |
| Sector: Financials | |
| SubSector: REIT - Residential | |
| MarketCap: 11385.5 Millions | |
| Recent Price: 128.40 Smart Investing & Trading Score: 86 | |
| Day Percent Change: 0.71% Day Change: 0.91 | |
| Week Change: 1.84% Year-to-date Change: -4.5% | |
| MAA Links: Profile News Message Board | |
| Charts:- Daily , Weekly | |
| Add MAA to Watchlist: View: Get MAA Trend Analysis ➞ | |
 | T AT&T Inc. |
| Sector: Technology | |
| SubSector: Telecom Services - Domestic | |
| MarketCap: 224847 Millions | |
| Recent Price: 16.81 Smart Investing & Trading Score: 49 | |
| Day Percent Change: 1.88% Day Change: 0.31 | |
| Week Change: 1.82% Year-to-date Change: 0.2% | |
| T Links: Profile News Message Board | |
| Charts:- Daily , Weekly | |
| Add T to Watchlist: View: Get T Trend Analysis ➞ | |
 | EOG EOG Resources, Inc. |
| Sector: Energy | |
| SubSector: Independent Oil & Gas | |
| MarketCap: 24282.1 Millions | |
| Recent Price: 135.60 Smart Investing & Trading Score: 88 | |
| Day Percent Change: 0.59% Day Change: 0.80 | |
| Week Change: 1.82% Year-to-date Change: 12.1% | |
| EOG Links: Profile News Message Board | |
| Charts:- Daily , Weekly | |
| Add EOG to Watchlist: View: Get EOG Trend Analysis ➞ | |
 | ED Consolidated Edison, Inc. |
| Sector: Utilities | |
| SubSector: Electric Utilities | |
| MarketCap: 25012.3 Millions | |
| Recent Price: 93.43 Smart Investing & Trading Score: 100 | |
| Day Percent Change: 0.64% Day Change: 0.59 | |
| Week Change: 1.81% Year-to-date Change: 2.7% | |
| ED Links: Profile News Message Board | |
| Charts:- Daily , Weekly | |
| Add ED to Watchlist: View: Get ED Trend Analysis ➞ | |
 | KIM Kimco Realty Corporation |
| Sector: Financials | |
| SubSector: REIT - Retail | |
| MarketCap: 5358.64 Millions | |
| Recent Price: 18.53 Smart Investing & Trading Score: 50 | |
| Day Percent Change: -0.54% Day Change: -0.10 | |
| Week Change: 1.81% Year-to-date Change: -13.1% | |
| KIM Links: Profile News Message Board | |
| Charts:- Daily , Weekly | |
| Add KIM to Watchlist: View: Get KIM Trend Analysis ➞ | |
 | RHI Robert Half International Inc. |
| Sector: Services & Goods | |
| SubSector: Staffing & Outsourcing Services | |
| MarketCap: 4302 Millions | |
| Recent Price: 71.50 Smart Investing & Trading Score: 42 | |
| Day Percent Change: -0.04% Day Change: -0.03 | |
| Week Change: 1.81% Year-to-date Change: -18.7% | |
| RHI Links: Profile News Message Board | |
| Charts:- Daily , Weekly | |
| Add RHI to Watchlist: View: Get RHI Trend Analysis ➞ | |
 | SNA Snap-on Incorporated |
| Sector: Industrials | |
| SubSector: Small Tools & Accessories | |
| MarketCap: 5947.26 Millions | |
| Recent Price: 273.59 Smart Investing & Trading Score: 32 | |
| Day Percent Change: 0.83% Day Change: 2.25 | |
| Week Change: 1.78% Year-to-date Change: -5.3% | |
| SNA Links: Profile News Message Board | |
| Charts:- Daily , Weekly | |
| Add SNA to Watchlist: View: Get SNA Trend Analysis ➞ | |
 | HOLX Hologic, Inc. |
| Sector: Health Care | |
| SubSector: Medical Instruments & Supplies | |
| MarketCap: 9075.2 Millions | |
| Recent Price: 76.71 Smart Investing & Trading Score: 68 | |
| Day Percent Change: -0.62% Day Change: -0.48 | |
| Week Change: 1.76% Year-to-date Change: 7.4% | |
| HOLX Links: Profile News Message Board | |
| Charts:- Daily , Weekly | |
| Add HOLX to Watchlist: View: Get HOLX Trend Analysis ➞ | |
 | MCD McDonald s Corporation |
| Sector: Services & Goods | |
| SubSector: Restaurants | |
| MarketCap: 122481 Millions | |
| Recent Price: 276.75 Smart Investing & Trading Score: 57 | |
| Day Percent Change: -0.05% Day Change: -0.13 | |
| Week Change: 1.75% Year-to-date Change: -6.7% | |
| MCD Links: Profile News Message Board | |
| Charts:- Daily , Weekly | |
| Add MCD to Watchlist: View: Get MCD Trend Analysis ➞ | |
 | MCO Moody s Corporation |
| Sector: Services & Goods | |
| SubSector: Business Services | |
| MarketCap: 35998.5 Millions | |
| Recent Price: 381.21 Smart Investing & Trading Score: 42 | |
| Day Percent Change: -0.25% Day Change: -0.96 | |
| Week Change: 1.75% Year-to-date Change: -2.4% | |
| MCO Links: Profile News Message Board | |
| Charts:- Daily , Weekly | |
| Add MCO to Watchlist: View: Get MCO Trend Analysis ➞ | |
 | VMC Vulcan Materials Company |
| Sector: Industrials | |
| SubSector: General Building Materials | |
| MarketCap: 12304.7 Millions | |
| Recent Price: 256.40 Smart Investing & Trading Score: 58 | |
| Day Percent Change: -1.13% Day Change: -2.94 | |
| Week Change: 1.72% Year-to-date Change: 13.0% | |
| VMC Links: Profile News Message Board | |
| Charts:- Daily , Weekly | |
| Add VMC to Watchlist: View: Get VMC Trend Analysis ➞ | |
 | BLK BlackRock, Inc. |
| Sector: Financials | |
| SubSector: Asset Management | |
| MarketCap: 61284.9 Millions | |
| Recent Price: 762.80 Smart Investing & Trading Score: 25 | |
| Day Percent Change: -0.50% Day Change: -3.82 | |
| Week Change: 1.71% Year-to-date Change: -6.0% | |
| BLK Links: Profile News Message Board | |
| Charts:- Daily , Weekly | |
| Add BLK to Watchlist: View: Get BLK Trend Analysis ➞ | |
 | GIS General Mills, Inc. |
| Sector: Consumer Staples | |
| SubSector: Processed & Packaged Goods | |
| MarketCap: 34131.7 Millions | |
| Recent Price: 71.61 Smart Investing & Trading Score: 100 | |
| Day Percent Change: 1.12% Day Change: 0.79 | |
| Week Change: 1.69% Year-to-date Change: 9.9% | |
| GIS Links: Profile News Message Board | |
| Charts:- Daily , Weekly | |
| Add GIS to Watchlist: View: Get GIS Trend Analysis ➞ | |
 | SPG Simon Property Group, Inc. |
| Sector: Financials | |
| SubSector: REIT - Retail | |
| MarketCap: 17959.6 Millions | |
| Recent Price: 142.81 Smart Investing & Trading Score: 51 | |
| Day Percent Change: -0.67% Day Change: -0.97 | |
| Week Change: 1.69% Year-to-date Change: 0.1% | |
| SPG Links: Profile News Message Board | |
| Charts:- Daily , Weekly | |
| Add SPG to Watchlist: View: Get SPG Trend Analysis ➞ | |
 | HSY The Hershey Company |
| Sector: Consumer Staples | |
| SubSector: Confectioners | |
| MarketCap: 27648.8 Millions | |
| Recent Price: 188.14 Smart Investing & Trading Score: 49 | |
| Day Percent Change: 0.57% Day Change: 1.06 | |
| Week Change: 1.69% Year-to-date Change: 0.9% | |
| HSY Links: Profile News Message Board | |
| Charts:- Daily , Weekly | |
| Add HSY to Watchlist: View: Get HSY Trend Analysis ➞ | |
 | LRCX Lam Research Corporation |
| Sector: Technology | |
| SubSector: Semiconductor Equipment & Materials | |
| MarketCap: 31806 Millions | |
| Recent Price: 884.89 Smart Investing & Trading Score: 58 | |
| Day Percent Change: -0.29% Day Change: -2.53 | |
| Week Change: 1.68% Year-to-date Change: 13.0% | |
| LRCX Links: Profile News Message Board | |
| Charts:- Daily , Weekly | |
| Add LRCX to Watchlist: View: Get LRCX Trend Analysis ➞ | |
 | OKE ONEOK, Inc. |
| Sector: Utilities | |
| SubSector: Gas Utilities | |
| MarketCap: 10788.7 Millions | |
| Recent Price: 80.95 Smart Investing & Trading Score: 90 | |
| Day Percent Change: 0.75% Day Change: 0.60 | |
| Week Change: 1.66% Year-to-date Change: 15.3% | |
| OKE Links: Profile News Message Board | |
| Charts:- Daily , Weekly | |
| Add OKE to Watchlist: View: Get OKE Trend Analysis ➞ | |
 | CMI Cummins Inc. |
| Sector: Industrials | |
| SubSector: Diversified Machinery | |
| MarketCap: 19127.1 Millions | |
| Recent Price: 292.34 Smart Investing & Trading Score: 68 | |
| Day Percent Change: -0.12% Day Change: -0.36 | |
| Week Change: 1.66% Year-to-date Change: 22.0% | |
| CMI Links: Profile News Message Board | |
| Charts:- Daily , Weekly | |
| Add CMI to Watchlist: View: Get CMI Trend Analysis ➞ | |
| For tabular summary view of above stock list: Summary View ➞ 0 - 25 , 25 - 50 , 50 - 75 , 75 - 100 , 100 - 125 , 125 - 150 , 150 - 175 , 175 - 200 , 200 - 225 , 225 - 250 , 250 - 275 , 275 - 300 , 300 - 325 , 325 - 350 , 350 - 375 , 375 - 400 , 400 - 425 , 425 - 450 , 450 - 475 , 475 - 500 | ||
| Click To Change The Sort Order: By Market Cap or Company Size Performance: Year-to-date, Week and Day | |
| Select Chart Type: | ||
|
Best Stocks Today 12Stocks.com |
© 2024 12Stocks.com Terms & Conditions Privacy Contact Us
All Information Provided Only For Education And Not To Be Used For Investing or Trading. See Terms & Conditions


One More Thing ... Get Best Stocks Delivered Daily!
Never Ever Miss A Move With Our Top Ten Stocks Lists
Find Best Stocks In Any Market - Bull or Bear Market
Take A Peek At Our Top Ten Stocks Lists: Daily, Weekly, Year-to-Date & Top Trends
Find Best Stocks In Any Market - Bull or Bear Market
Take A Peek At Our Top Ten Stocks Lists: Daily, Weekly, Year-to-Date & Top Trends
S&P 500 Stocks With Best Up Trends [0-bearish to 100-bullish]: Hasbro [100], Wabtec [100], Boston Scientific[100], Texas Instruments[100], Microchip [100], Synchrony Financial[100], EQT [100], PepsiCo [100], Analog Devices[100], Equity Residential[100], Essex Property[100]
Best S&P 500 Stocks Year-to-Date:
NVIDIA [60.89%], Constellation [59.4%], NRG [40.44%], Meta Platforms[39.4%], Targa Resources[34.57%], Marathon [34.23%], Progressive [33.22%], Western Digital[32.81%], Eaton [32.38%], Diamondback [32.34%], Micron [30.98%] Best S&P 500 Stocks This Week:
Globe Life[17.77%], Hasbro [17.66%], Wabtec [13.32%], Microchip [11.02%], Tesla [10.26%], Texas Instruments[9.48%], NXP Semiconductors[9.26%], CoStar [9.13%], Kimberly-Clark [8.63%], Monolithic Power[8.57%], Synchrony Financial[8.3%] Best S&P 500 Stocks Daily:
Tesla [12.06%], Hasbro [11.85%], Wabtec [10.04%], CoStar [8.66%], ON Semiconductor[6.24%], Boston Scientific[5.68%], Texas Instruments[5.64%], Microchip [5.21%], Monolithic Power[5.04%], Synchrony Financial[5.04%], Biogen [4.56%]