
 Login Sign Up


| |||||
 |  | ||||

| 12Stocks.com Market Intelligence |
Best S&P 500 Stocks
|
On this page, you will find the most comprehensive analysis of S&P 500 stocks and ETFs - from latest trends to performances to charts ➞. First, here are the year-to-date (YTD) performances of the most requested S&P 500 stocks at 12Stocks.com (click stock for review):
| NVIDIA 91% | ||
| Google 23% | ||
| Amazon.com 22% | ||
| Caterpillar 22% | ||
| Merck 21% | ||
| Goldman Sachs 21% | ||
| JPMorgan Chase 19% | ||
| Walmart 14% | ||
| Microsoft 13% | ||
| Chevron 9% | ||
| Apple -1% | ||
| Johnson & Johnson -3% | ||
| McDonald s -8% | ||
| Gilead -17% | ||
| Starbucks -21% | ||
| Boeing -32% | ||
| Intel -38% | ||
| Quick: S&P 500 Stocks Lists: Performances & Trends, S&P 500 Stock Charts
Sort S&P 500 stocks: Daily, Weekly, Year-to-Date, Market Cap & Trends. Filter S&P 500 stocks list by sector: Show all, Tech, Finance, Energy, Staples, Retail, Industrial, Materials, Utilities and HealthCare |
| 12Stocks.com S&P 500 Stocks Performances & Trends Daily Report | |||||||||
|
| 
The overall Smart Investing & Trading Score is 100 (0-bearish to 100-bullish) which puts S&P 500 index in short term bullish trend. The Smart Investing & Trading Score from previous trading session is 83 and hence an improvement of trend. | ||||||||
Here are the Smart Investing & Trading Scores of the most requested S&P 500 stocks at 12Stocks.com (click stock name for detailed review):
|


| 12Stocks.com: Top Performing S&P 500 Index Stocks | ||||||||||||||||||||||||||||||||||||||||||||||||
 The top performing S&P 500 Index stocks year to date are
Now, more recently, over last week, the top performing S&P 500 Index stocks on the move are


|
||||||||||||||||||||||||||||||||||||||||||||||||
| 12Stocks.com: Investing in S&P 500 Index with Stocks | |
|
The following table helps investors and traders sort through current performance and trends (as measured by Smart Investing & Trading Score) of various
stocks in the S&P 500 Index. Quick View: Move mouse or cursor over stock symbol (ticker) to view short-term technical chart and over stock name to view long term chart. Click on  to add stock symbol to your watchlist and to add stock symbol to your watchlist and  to view watchlist. Click on any ticker or stock name for detailed market intelligence report for that stock. to view watchlist. Click on any ticker or stock name for detailed market intelligence report for that stock. |
12Stocks.com Performance of Stocks in S&P 500 Index
| Ticker | Stock Name | Watchlist | Category | Recent Price | Smart Investing & Trading Score | Change % | YTD Change% |
| CINF | Cincinnati Financial |   | Financials | 117.29 | 53 | -0.78% | 13.37% |
| HIG | Hartford Financial | | Financials | 100.61 | 53 | -0.71% | 25.17% |
| CB | Chubb | | Financials | 252.97 | 53 | -0.08% | 11.93% |
| GILD | Gilead | | Health Care | 67.01 | 52 | -0.95% | -17.28% |
| ILMN | Illumina | | Health Care | 115.01 | 52 | -0.49% | -17.40% |
| HLT | Hilton Worldwide | | Services & Goods | 204.57 | 52 | -0.36% | 12.35% |
| AIG | American | | Financials | 78.90 | 51 | -0.68% | 16.46% |
| HAL | Halliburton | | Energy | 37.36 | 51 | -0.53% | 3.35% |
| PSX | Phillips 66 | | Energy | 146.21 | 51 | 0.94% | 9.82% |
| HAS | Hasbro | | Consumer Staples | 60.51 | 51 | -2.69% | 18.51% |
| ADM | Archer-Daniels-Midland | | Consumer Staples | 60.08 | 51 | -2.58% | -16.81% |
| HOLX | Hologic | | Health Care | 74.86 | 51 | -1.04% | 4.77% |
| CMI | Cummins | | Industrials | 292.14 | 51 | -1.03% | 21.94% |
| LMT | Lockheed Martin | | Industrials | 464.08 | 51 | -0.66% | 2.39% |
| HD | Home Depot | | Services & Goods | 348.67 | 50 | 2.40% | 0.61% |
| ZBH | Zimmer Biomet | | Health Care | 120.98 | 50 | 0.84% | -0.59% |
| CCL | Carnival | | Services & Goods | 14.86 | 49 | 2.34% | -19.85% |
| DRI | Darden Restaurants | | Services & Goods | 151.78 | 49 | 1.91% | -7.62% |
| FFIV | F5 Networks | | Technology | 175.05 | 49 | 1.81% | -2.20% |
| EL | Estee Lauder | | Consumer Staples | 136.00 | 49 | 1.45% | -7.01% |
| MCD | McDonald s | | Services & Goods | 273.87 | 49 | 1.19% | -7.64% |
| FTNT | Fortinet | | Technology | 60.73 | 49 | 0.88% | 3.76% |
| IBM | Business | | Technology | 168.26 | 49 | 0.54% | 2.88% |
| DG | Dollar General | | Services & Goods | 141.06 | 49 | 0.53% | 3.76% |
| BEN | Franklin Resources | | Financials | 24.51 | 49 | 0.37% | -17.72% |
| For chart view version of above stock list: Chart View ➞ 0 - 25 , 25 - 50 , 50 - 75 , 75 - 100 , 100 - 125 , 125 - 150 , 150 - 175 , 175 - 200 , 200 - 225 , 225 - 250 , 250 - 275 , 275 - 300 , 300 - 325 , 325 - 350 , 350 - 375 , 375 - 400 , 400 - 425 , 425 - 450 , 450 - 475 , 475 - 500 | ||
 | Click To Change The Sort Order: By Market Cap or Company Size Performance: Year-to-date, Week and Day |  |
|
Get the most comprehensive stock market coverage daily at 12Stocks.com ➞ Best Stocks Today ➞ Best Stocks Weekly ➞ Best Stocks Year-to-Date ➞ Best Stocks Trends ➞  Best Stocks Today 12Stocks.com Best Nasdaq Stocks ➞ Best S&P 500 Stocks ➞ Best Tech Stocks ➞ Best Biotech Stocks ➞ |
| Detailed Overview of S&P 500 Stocks |
| S&P 500 Technical Overview, Leaders & Laggards, Top S&P 500 ETF Funds & Detailed S&P 500 Stocks List, Charts, Trends & More |
| S&P 500: Technical Analysis, Trends & YTD Performance | |
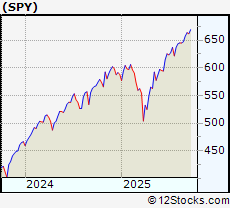
| S&P 500 index as represented by
SPY, an exchange-traded fund [ETF], holds basket of five hundred (mostly largecap) stocks from across all major sectors of the US stock market. The S&P 500 index (contains stocks like Apple and Exxon) is up by 11.46% and is currently outperforming the overall market by 0.74% year-to-date. Below is a quick view of technical charts and trends: | |
 SPY Weekly Chart |
|
| Long Term Trend: Very Good | |
| Medium Term Trend: Very Good | |
 SPY Daily Chart |
|
| Short Term Trend: Very Good | |
| Overall Trend Score: 100 | |
| YTD Performance: 11.46% | |
| **Trend Scores & Views Are Only For Educational Purposes And Not For Investing | |
| 12Stocks.com: Investing in S&P 500 Index using Exchange Traded Funds | |
|
The following table shows list of key exchange traded funds (ETF) that
help investors track S&P 500 index. The following list also includes leveraged ETF funds that track twice or thrice the daily returns of S&P 500 indices. Short or inverse ETF funds move in the opposite direction to the index they track and are useful during market pullbacks or during bear markets. Quick View: Move mouse or cursor over ETF symbol (ticker) to view short-term technical chart and over ETF name to view long term chart. Click on ticker or stock name for detailed view. Click on to add stock symbol to your watchlist and to view watchlist. |
12Stocks.com List of ETFs that track S&P 500 Index
| Ticker | ETF Name | Watchlist | Recent Price | Smart Investing & Trading Score | Change % | Week % | Year-to-date % |
| SPY | SPDR S&P 500 ETF | | 529.78 | 100 | 1.24 | 1.72 | 11.46% |
| IVV | iShares Core S&P 500 ETF | | 530.30 | 100 | 0.83 | 1.32 | 11.03% |
| VOO | Vanguard 500 ETF | | 484.99 | 100 | 0.82 | 1.31 | 11.03% |
| OEF | iShares S&P 100 | | 252.61 | 100 | 1.27 | 1.92 | 13.08% |
| SSO | ProShares Ultra S&P500 | | 78.67 | 95 | 2.46 | 3.34 | 20.9% |
| UPRO | ProShares UltraPro S&P500 | | 71.64 | 100 | 3.66 | 5 | 30.87% |
| SPXL | Direxion Daily S&P500 Bull 3X ETF | | 134.55 | 100 | 2.55 | 3.86 | 29.39% |
| SH | ProShares Short S&P500 | | 11.83 | 0 | -1.17 | -1.58 | -8.93% |
| SDS | ProShares UltraShort S&P500 | | 24.52 | 0 | -2.43 | -3.27 | -18.05% |
| SPXU | ProShares UltraPro Short S&P500 | | 31.49 | 0 | -3.64 | -4.89 | -26.77% |
| SPXS | Direxion Daily S&P 500 Bear 3X ETF | | 8.63 | 10 | -2.38 | -3.79 | -25.28% |
| 12Stocks.com: Charts, Trends, Fundamental Data and Performances of S&P 500 Stocks | |
|
We now take in-depth look at all S&P 500 stocks including charts, multi-period performances and overall trends (as measured by Smart Investing & Trading Score). One can sort S&P 500 stocks (click link to choose) by Daily, Weekly and by Year-to-Date performances. Also, one can sort by size of the company or by market capitalization. |
| Select Your Default Chart Type: | |||||
| |||||
| Click on stock symbol or name for detailed view. Click on to add stock symbol to your watchlist and to view watchlist. Quick View: Move mouse or cursor over "Daily" to quickly view daily technical stock chart and over "Weekly" to view weekly technical stock chart. | |||||

 | CINF Cincinnati Financial Corporation |
| Sector: Financials | |
| SubSector: Property & Casualty Insurance | |
| MarketCap: 13637 Millions | |
| Recent Price: 117.29 Smart Investing & Trading Score: 53 | |
| Day Percent Change: -0.78% Day Change: -0.92 | |
| Week Change: -1.33% Year-to-date Change: 13.4% | |
| CINF Links: Profile News Message Board | |
| Charts:- Daily , Weekly | |
| Add CINF to Watchlist: View: Get CINF Trend Analysis ➞ | |
 | HIG The Hartford Financial Services Group, Inc. |
| Sector: Financials | |
| SubSector: Property & Casualty Insurance | |
| MarketCap: 12582.8 Millions | |
| Recent Price: 100.61 Smart Investing & Trading Score: 53 | |
| Day Percent Change: -0.71% Day Change: -0.72 | |
| Week Change: -1.26% Year-to-date Change: 25.2% | |
| HIG Links: Profile News Message Board | |
| Charts:- Daily , Weekly | |
| Add HIG to Watchlist: View: Get HIG Trend Analysis ➞ | |
 | CB Chubb Limited |
| Sector: Financials | |
| SubSector: Property & Casualty Insurance | |
| MarketCap: 51615.9 Millions | |
| Recent Price: 252.97 Smart Investing & Trading Score: 53 | |
| Day Percent Change: -0.08% Day Change: -0.19 | |
| Week Change: -0.73% Year-to-date Change: 11.9% | |
| CB Links: Profile News Message Board | |
| Charts:- Daily , Weekly | |
| Add CB to Watchlist: View: Get CB Trend Analysis ➞ | |
 | GILD Gilead Sciences, Inc. |
| Sector: Health Care | |
| SubSector: Biotechnology | |
| MarketCap: 99485.6 Millions | |
| Recent Price: 67.01 Smart Investing & Trading Score: 52 | |
| Day Percent Change: -0.95% Day Change: -0.64 | |
| Week Change: 1.59% Year-to-date Change: -17.3% | |
| GILD Links: Profile News Message Board | |
| Charts:- Daily , Weekly | |
| Add GILD to Watchlist: View: Get GILD Trend Analysis ➞ | |
 | ILMN Illumina, Inc. |
| Sector: Health Care | |
| SubSector: Biotechnology | |
| MarketCap: 39194.3 Millions | |
| Recent Price: 115.01 Smart Investing & Trading Score: 52 | |
| Day Percent Change: -0.49% Day Change: -0.57 | |
| Week Change: 4.05% Year-to-date Change: -17.4% | |
| ILMN Links: Profile News Message Board | |
| Charts:- Daily , Weekly | |
| Add ILMN to Watchlist: View: Get ILMN Trend Analysis ➞ | |
 | HLT Hilton Worldwide Holdings Inc. |
| Sector: Services & Goods | |
| SubSector: Lodging | |
| MarketCap: 18064.6 Millions | |
| Recent Price: 204.57 Smart Investing & Trading Score: 52 | |
| Day Percent Change: -0.36% Day Change: -0.73 | |
| Week Change: -1.69% Year-to-date Change: 12.4% | |
| HLT Links: Profile News Message Board | |
| Charts:- Daily , Weekly | |
| Add HLT to Watchlist: View: Get HLT Trend Analysis ➞ | |
 | AIG American International Group, Inc. |
| Sector: Financials | |
| SubSector: Property & Casualty Insurance | |
| MarketCap: 21219 Millions | |
| Recent Price: 78.90 Smart Investing & Trading Score: 51 | |
| Day Percent Change: -0.68% Day Change: -0.54 | |
| Week Change: -1.51% Year-to-date Change: 16.5% | |
| AIG Links: Profile News Message Board | |
| Charts:- Daily , Weekly | |
| Add AIG to Watchlist: View: Get AIG Trend Analysis ➞ | |
 | HAL Halliburton Company |
| Sector: Energy | |
| SubSector: Oil & Gas Equipment & Services | |
| MarketCap: 5419.41 Millions | |
| Recent Price: 37.36 Smart Investing & Trading Score: 51 | |
| Day Percent Change: -0.53% Day Change: -0.20 | |
| Week Change: 0.78% Year-to-date Change: 3.4% | |
| HAL Links: Profile News Message Board | |
| Charts:- Daily , Weekly | |
| Add HAL to Watchlist: View: Get HAL Trend Analysis ➞ | |
 | PSX Phillips 66 |
| Sector: Energy | |
| SubSector: Oil & Gas Refining & Marketing | |
| MarketCap: 25253.6 Millions | |
| Recent Price: 146.21 Smart Investing & Trading Score: 51 | |
| Day Percent Change: 0.94% Day Change: 1.36 | |
| Week Change: 0.42% Year-to-date Change: 9.8% | |
| PSX Links: Profile News Message Board | |
| Charts:- Daily , Weekly | |
| Add PSX to Watchlist: View: Get PSX Trend Analysis ➞ | |
 | HAS Hasbro, Inc. |
| Sector: Consumer Staples | |
| SubSector: Toys & Games | |
| MarketCap: 7389.5 Millions | |
| Recent Price: 60.51 Smart Investing & Trading Score: 51 | |
| Day Percent Change: -2.69% Day Change: -1.67 | |
| Week Change: 0.7% Year-to-date Change: 18.5% | |
| HAS Links: Profile News Message Board | |
| Charts:- Daily , Weekly | |
| Add HAS to Watchlist: View: Get HAS Trend Analysis ➞ | |
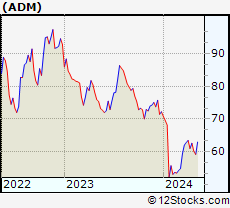 | ADM Archer-Daniels-Midland Company |
| Sector: Consumer Staples | |
| SubSector: Farm Products | |
| MarketCap: 18988.7 Millions | |
| Recent Price: 60.08 Smart Investing & Trading Score: 51 | |
| Day Percent Change: -2.58% Day Change: -1.59 | |
| Week Change: -4.6% Year-to-date Change: -16.8% | |
| ADM Links: Profile News Message Board | |
| Charts:- Daily , Weekly | |
| Add ADM to Watchlist: View: Get ADM Trend Analysis ➞ | |
 | HOLX Hologic, Inc. |
| Sector: Health Care | |
| SubSector: Medical Instruments & Supplies | |
| MarketCap: 9075.2 Millions | |
| Recent Price: 74.86 Smart Investing & Trading Score: 51 | |
| Day Percent Change: -1.04% Day Change: -0.79 | |
| Week Change: -0.37% Year-to-date Change: 4.8% | |
| HOLX Links: Profile News Message Board | |
| Charts:- Daily , Weekly | |
| Add HOLX to Watchlist: View: Get HOLX Trend Analysis ➞ | |
 | CMI Cummins Inc. |
| Sector: Industrials | |
| SubSector: Diversified Machinery | |
| MarketCap: 19127.1 Millions | |
| Recent Price: 292.14 Smart Investing & Trading Score: 51 | |
| Day Percent Change: -1.03% Day Change: -3.04 | |
| Week Change: -2.17% Year-to-date Change: 21.9% | |
| CMI Links: Profile News Message Board | |
| Charts:- Daily , Weekly | |
| Add CMI to Watchlist: View: Get CMI Trend Analysis ➞ | |
 | LMT Lockheed Martin Corporation |
| Sector: Industrials | |
| SubSector: Aerospace/Defense Products & Services | |
| MarketCap: 94116.4 Millions | |
| Recent Price: 464.08 Smart Investing & Trading Score: 51 | |
| Day Percent Change: -0.66% Day Change: -3.10 | |
| Week Change: -1.02% Year-to-date Change: 2.4% | |
| LMT Links: Profile News Message Board | |
| Charts:- Daily , Weekly | |
| Add LMT to Watchlist: View: Get LMT Trend Analysis ➞ | |
 | HD The Home Depot, Inc. |
| Sector: Services & Goods | |
| SubSector: Home Improvement Stores | |
| MarketCap: 185389 Millions | |
| Recent Price: 348.67 Smart Investing & Trading Score: 50 | |
| Day Percent Change: 2.40% Day Change: 8.17 | |
| Week Change: 0.65% Year-to-date Change: 0.6% | |
| HD Links: Profile News Message Board | |
| Charts:- Daily , Weekly | |
| Add HD to Watchlist: View: Get HD Trend Analysis ➞ | |
 | ZBH Zimmer Biomet Holdings, Inc. |
| Sector: Health Care | |
| SubSector: Medical Appliances & Equipment | |
| MarketCap: 19339.4 Millions | |
| Recent Price: 120.98 Smart Investing & Trading Score: 50 | |
| Day Percent Change: 0.84% Day Change: 1.01 | |
| Week Change: -0.27% Year-to-date Change: -0.6% | |
| ZBH Links: Profile News Message Board | |
| Charts:- Daily , Weekly | |
| Add ZBH to Watchlist: View: Get ZBH Trend Analysis ➞ | |
 | CCL Carnival Corporation & Plc |
| Sector: Services & Goods | |
| SubSector: Resorts & Casinos | |
| MarketCap: 11725.4 Millions | |
| Recent Price: 14.86 Smart Investing & Trading Score: 49 | |
| Day Percent Change: 2.34% Day Change: 0.34 | |
| Week Change: 2.98% Year-to-date Change: -19.9% | |
| CCL Links: Profile News Message Board | |
| Charts:- Daily , Weekly | |
| Add CCL to Watchlist: View: Get CCL Trend Analysis ➞ | |
 | DRI Darden Restaurants, Inc. |
| Sector: Services & Goods | |
| SubSector: Restaurants | |
| MarketCap: 5623.1 Millions | |
| Recent Price: 151.78 Smart Investing & Trading Score: 49 | |
| Day Percent Change: 1.91% Day Change: 2.84 | |
| Week Change: 2.38% Year-to-date Change: -7.6% | |
| DRI Links: Profile News Message Board | |
| Charts:- Daily , Weekly | |
| Add DRI to Watchlist: View: Get DRI Trend Analysis ➞ | |
 | FFIV F5 Networks, Inc. |
| Sector: Technology | |
| SubSector: Business Software & Services | |
| MarketCap: 6675.38 Millions | |
| Recent Price: 175.05 Smart Investing & Trading Score: 49 | |
| Day Percent Change: 1.81% Day Change: 3.12 | |
| Week Change: 2% Year-to-date Change: -2.2% | |
| FFIV Links: Profile News Message Board | |
| Charts:- Daily , Weekly | |
| Add FFIV to Watchlist: View: Get FFIV Trend Analysis ➞ | |
 | EL The Estee Lauder Companies Inc. |
| Sector: Consumer Staples | |
| SubSector: Personal Products | |
| MarketCap: 59521.1 Millions | |
| Recent Price: 136.00 Smart Investing & Trading Score: 49 | |
| Day Percent Change: 1.45% Day Change: 1.94 | |
| Week Change: 3.03% Year-to-date Change: -7.0% | |
| EL Links: Profile News Message Board | |
| Charts:- Daily , Weekly | |
| Add EL to Watchlist: View: Get EL Trend Analysis ➞ | |
 | MCD McDonald s Corporation |
| Sector: Services & Goods | |
| SubSector: Restaurants | |
| MarketCap: 122481 Millions | |
| Recent Price: 273.87 Smart Investing & Trading Score: 49 | |
| Day Percent Change: 1.19% Day Change: 3.21 | |
| Week Change: -0.41% Year-to-date Change: -7.6% | |
| MCD Links: Profile News Message Board | |
| Charts:- Daily , Weekly | |
| Add MCD to Watchlist: View: Get MCD Trend Analysis ➞ | |
 | FTNT Fortinet, Inc. |
| Sector: Technology | |
| SubSector: Application Software | |
| MarketCap: 16993.8 Millions | |
| Recent Price: 60.73 Smart Investing & Trading Score: 49 | |
| Day Percent Change: 0.88% Day Change: 0.53 | |
| Week Change: 4.42% Year-to-date Change: 3.8% | |
| FTNT Links: Profile News Message Board | |
| Charts:- Daily , Weekly | |
| Add FTNT to Watchlist: View: Get FTNT Trend Analysis ➞ | |
 | IBM International Business Machines Corporation |
| Sector: Technology | |
| SubSector: Information Technology Services | |
| MarketCap: 97241.6 Millions | |
| Recent Price: 168.26 Smart Investing & Trading Score: 49 | |
| Day Percent Change: 0.54% Day Change: 0.90 | |
| Week Change: 0.66% Year-to-date Change: 2.9% | |
| IBM Links: Profile News Message Board | |
| Charts:- Daily , Weekly | |
| Add IBM to Watchlist: View: Get IBM Trend Analysis ➞ | |
 | DG Dollar General Corporation |
| Sector: Services & Goods | |
| SubSector: Discount, Variety Stores | |
| MarketCap: 39611.9 Millions | |
| Recent Price: 141.06 Smart Investing & Trading Score: 49 | |
| Day Percent Change: 0.53% Day Change: 0.75 | |
| Week Change: 0.08% Year-to-date Change: 3.8% | |
| DG Links: Profile News Message Board | |
| Charts:- Daily , Weekly | |
| Add DG to Watchlist: View: Get DG Trend Analysis ➞ | |
 | BEN Franklin Resources, Inc. |
| Sector: Financials | |
| SubSector: Asset Management | |
| MarketCap: 9419.73 Millions | |
| Recent Price: 24.51 Smart Investing & Trading Score: 49 | |
| Day Percent Change: 0.37% Day Change: 0.09 | |
| Week Change: 3.24% Year-to-date Change: -17.7% | |
| BEN Links: Profile News Message Board | |
| Charts:- Daily , Weekly | |
| Add BEN to Watchlist: View: Get BEN Trend Analysis ➞ | |
| For tabular summary view of above stock list: Summary View ➞ 0 - 25 , 25 - 50 , 50 - 75 , 75 - 100 , 100 - 125 , 125 - 150 , 150 - 175 , 175 - 200 , 200 - 225 , 225 - 250 , 250 - 275 , 275 - 300 , 300 - 325 , 325 - 350 , 350 - 375 , 375 - 400 , 400 - 425 , 425 - 450 , 450 - 475 , 475 - 500 | ||
| Click To Change The Sort Order: By Market Cap or Company Size Performance: Year-to-date, Week and Day | |
| Select Chart Type: | ||
|
Best Stocks Today 12Stocks.com |
© 2024 12Stocks.com Terms & Conditions Privacy Contact Us
All Information Provided Only For Education And Not To Be Used For Investing or Trading. See Terms & Conditions


One More Thing ... Get Best Stocks Delivered Daily!
Never Ever Miss A Move With Our Top Ten Stocks Lists
Find Best Stocks In Any Market - Bull or Bear Market
Take A Peek At Our Top Ten Stocks Lists: Daily, Weekly, Year-to-Date & Top Trends
Find Best Stocks In Any Market - Bull or Bear Market
Take A Peek At Our Top Ten Stocks Lists: Daily, Weekly, Year-to-Date & Top Trends
S&P 500 Stocks With Best Up Trends [0-bearish to 100-bullish]: MarketAxess Holdings[100], Edwards Life[100], KLA [100], AES [100], Arista Networks[100], Monolithic Power[100], Teradyne [100], Biogen [100], Applied Materials[100], ProShares UltraPro[100], KeyCorp [100]
Best S&P 500 Stocks Year-to-Date:
NVIDIA [91.09%], Constellation [90.68%], NRG [63.42%], Micron [49.77%], Western Digital[44.53%], Eaton [40.34%], Chipotle Mexican[38.54%], Arista Networks[38.44%], Leidos Holdings[36.04%], Meta Platforms[36.02%], Eli Lilly[35.01%] Best S&P 500 Stocks This Week:
Insulet [8.84%], Moderna [8.02%], Teleflex [7.78%], Broadcom [7.76%], IDEXX [7.59%], Incyte [7.52%], Teradyne [7.35%], QUALCOMM [6.88%], Equinix [6.86%], Tapestry [6.8%], Bio-Rad [6.73%] Best S&P 500 Stocks Daily:
D.R. Horton[6.47%], MarketAxess Holdings[6.11%], ServiceNow [5.40%], IDEXX [5.26%], Lennar [5.25%], Pulte [5.07%], Insulet [4.81%], Edwards Life[4.28%], Advanced Micro[4.25%], Blackstone [4.24%], KLA [4.08%]