
 Login Sign Up


| |||||
 |  | ||||

| 12Stocks.com Market Intelligence |
Best S&P 500 Stocks
|
On this page, you will find the most comprehensive analysis of S&P 500 stocks and ETFs - from latest trends to performances to charts ➞. First, here are the year-to-date (YTD) performances of the most requested S&P 500 stocks at 12Stocks.com (click stock for review):
| NVIDIA 91% | ||
| Google 23% | ||
| Amazon.com 22% | ||
| Caterpillar 22% | ||
| Merck 21% | ||
| Goldman Sachs 21% | ||
| JPMorgan Chase 19% | ||
| Walmart 14% | ||
| Microsoft 13% | ||
| Chevron 9% | ||
| Apple -1% | ||
| Johnson & Johnson -3% | ||
| McDonald s -8% | ||
| Gilead -17% | ||
| Starbucks -21% | ||
| Boeing -32% | ||
| Intel -38% | ||
| Quick: S&P 500 Stocks Lists: Performances & Trends, S&P 500 Stock Charts
Sort S&P 500 stocks: Daily, Weekly, Year-to-Date, Market Cap & Trends. Filter S&P 500 stocks list by sector: Show all, Tech, Finance, Energy, Staples, Retail, Industrial, Materials, Utilities and HealthCare |
| 12Stocks.com S&P 500 Stocks Performances & Trends Daily Report | |||||||||
|
| 
The overall Smart Investing & Trading Score is 100 (0-bearish to 100-bullish) which puts S&P 500 index in short term bullish trend. The Smart Investing & Trading Score from previous trading session is 83 and hence an improvement of trend. | ||||||||
Here are the Smart Investing & Trading Scores of the most requested S&P 500 stocks at 12Stocks.com (click stock name for detailed review):
|


| 12Stocks.com: Top Performing S&P 500 Index Stocks | ||||||||||||||||||||||||||||||||||||||||||||||||
 The top performing S&P 500 Index stocks year to date are
Now, more recently, over last week, the top performing S&P 500 Index stocks on the move are


|
||||||||||||||||||||||||||||||||||||||||||||||||
| 12Stocks.com: Investing in S&P 500 Index with Stocks | |
|
The following table helps investors and traders sort through current performance and trends (as measured by Smart Investing & Trading Score) of various
stocks in the S&P 500 Index. Quick View: Move mouse or cursor over stock symbol (ticker) to view short-term technical chart and over stock name to view long term chart. Click on  to add stock symbol to your watchlist and to add stock symbol to your watchlist and  to view watchlist. Click on any ticker or stock name for detailed market intelligence report for that stock. to view watchlist. Click on any ticker or stock name for detailed market intelligence report for that stock. |
12Stocks.com Performance of Stocks in S&P 500 Index
| Ticker | Stock Name | Watchlist | Category | Recent Price | Smart Investing & Trading Score | Change % | YTD Change% |
| MOH | Molina Healthcare |   | Health Care | 345.84 | 32 | -1.18% | -4.28% |
| MNST | Monster Beverage | | Consumer Staples | 54.24 | 32 | -0.44% | -5.85% |
| JBHT | J.B. Hunt | | Transports | 167.59 | 32 | -0.34% | -16.10% |
| CDW | CDW | | Technology | 223.44 | 32 | 0.84% | -1.71% |
| CME | CME | | Financials | 208.26 | 32 | -1.20% | -1.11% |
| SYF | Synchrony Financial | | Financials | 44.14 | 31 | -2.30% | 15.58% |
| TGT | Target | | Services & Goods | 157.51 | 31 | -0.91% | 10.60% |
| FANG | Diamondback | | Energy | 196.74 | 31 | -0.66% | 26.86% |
| SLB | Schlumberger | | Energy | 48.31 | 31 | -0.64% | -7.17% |
| ACN | Accenture | | Technology | 308.52 | 30 | 0.51% | -12.08% |
| CZR | Caesars Entertainment | | Services & Goods | 36.27 | 30 | -1.20% | -22.63% |
| ABT | Abbott | | Health Care | 104.59 | 28 | 0.56% | -4.98% |
| VRSN | VeriSign | | Technology | 169.25 | 27 | -0.28% | -17.82% |
| IEX | IDEX | | Industrials | 224.20 | 27 | -0.20% | 3.27% |
| CSGP | CoStar | | Financials | 88.48 | 26 | 0.80% | 1.25% |
| ALL | Allstate | | Financials | 166.27 | 26 | -1.66% | 18.78% |
| CI | Cigna | | Health Care | 343.28 | 26 | -0.91% | 14.64% |
| STZ | Constellation Brands | | Consumer Staples | 252.29 | 26 | -0.67% | 4.36% |
| RSG | Republic Services | | Industrials | 186.97 | 26 | -0.20% | 13.38% |
| EPAM | EPAM Systems | | Technology | 190.48 | 25 | 1.83% | -35.94% |
| JNPR | Juniper Networks | | Technology | 34.58 | 25 | 0.41% | 17.30% |
| CTLT | Catalent | | Health Care | 55.61 | 25 | 0.16% | 23.77% |
| LVS | Las Vegas | | Services & Goods | 46.11 | 25 | -0.45% | -6.30% |
| UBER | Uber Technologies | | Technology | 66.62 | 25 | 1.99% | 8.20% |
| AME | AMETEK | | Industrials | 169.63 | 25 | 0.65% | 2.87% |
| For chart view version of above stock list: Chart View ➞ 0 - 25 , 25 - 50 , 50 - 75 , 75 - 100 , 100 - 125 , 125 - 150 , 150 - 175 , 175 - 200 , 200 - 225 , 225 - 250 , 250 - 275 , 275 - 300 , 300 - 325 , 325 - 350 , 350 - 375 , 375 - 400 , 400 - 425 , 425 - 450 , 450 - 475 , 475 - 500 | ||
 | Click To Change The Sort Order: By Market Cap or Company Size Performance: Year-to-date, Week and Day |  |
|
Get the most comprehensive stock market coverage daily at 12Stocks.com ➞ Best Stocks Today ➞ Best Stocks Weekly ➞ Best Stocks Year-to-Date ➞ Best Stocks Trends ➞  Best Stocks Today 12Stocks.com Best Nasdaq Stocks ➞ Best S&P 500 Stocks ➞ Best Tech Stocks ➞ Best Biotech Stocks ➞ |
| Detailed Overview of S&P 500 Stocks |
| S&P 500 Technical Overview, Leaders & Laggards, Top S&P 500 ETF Funds & Detailed S&P 500 Stocks List, Charts, Trends & More |
| S&P 500: Technical Analysis, Trends & YTD Performance | |
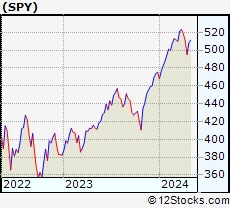
| S&P 500 index as represented by
SPY, an exchange-traded fund [ETF], holds basket of five hundred (mostly largecap) stocks from across all major sectors of the US stock market. The S&P 500 index (contains stocks like Apple and Exxon) is up by 11.46% and is currently outperforming the overall market by 0.74% year-to-date. Below is a quick view of technical charts and trends: | |
 SPY Weekly Chart |
|
| Long Term Trend: Very Good | |
| Medium Term Trend: Very Good | |
 SPY Daily Chart |
|
| Short Term Trend: Very Good | |
| Overall Trend Score: 100 | |
| YTD Performance: 11.46% | |
| **Trend Scores & Views Are Only For Educational Purposes And Not For Investing | |
| 12Stocks.com: Investing in S&P 500 Index using Exchange Traded Funds | |
|
The following table shows list of key exchange traded funds (ETF) that
help investors track S&P 500 index. The following list also includes leveraged ETF funds that track twice or thrice the daily returns of S&P 500 indices. Short or inverse ETF funds move in the opposite direction to the index they track and are useful during market pullbacks or during bear markets. Quick View: Move mouse or cursor over ETF symbol (ticker) to view short-term technical chart and over ETF name to view long term chart. Click on ticker or stock name for detailed view. Click on to add stock symbol to your watchlist and to view watchlist. |
12Stocks.com List of ETFs that track S&P 500 Index
| Ticker | ETF Name | Watchlist | Recent Price | Smart Investing & Trading Score | Change % | Week % | Year-to-date % |
| SPY | SPDR S&P 500 ETF | | 529.78 | 100 | 1.24 | 1.72 | 11.46% |
| IVV | iShares Core S&P 500 ETF | | 530.30 | 100 | 0.83 | 1.32 | 11.03% |
| VOO | Vanguard 500 ETF | | 484.99 | 100 | 0.82 | 1.31 | 11.03% |
| OEF | iShares S&P 100 | | 252.61 | 100 | 1.27 | 1.92 | 13.08% |
| SSO | ProShares Ultra S&P500 | | 78.67 | 95 | 2.46 | 3.34 | 20.9% |
| UPRO | ProShares UltraPro S&P500 | | 71.64 | 100 | 3.66 | 5 | 30.87% |
| SPXL | Direxion Daily S&P500 Bull 3X ETF | | 134.55 | 100 | 2.55 | 3.86 | 29.39% |
| SH | ProShares Short S&P500 | | 11.83 | 0 | -1.17 | -1.58 | -8.93% |
| SDS | ProShares UltraShort S&P500 | | 24.52 | 0 | -2.43 | -3.27 | -18.05% |
| SPXU | ProShares UltraPro Short S&P500 | | 31.49 | 0 | -3.64 | -4.89 | -26.77% |
| SPXS | Direxion Daily S&P 500 Bear 3X ETF | | 8.63 | 10 | -2.38 | -3.79 | -25.28% |
| 12Stocks.com: Charts, Trends, Fundamental Data and Performances of S&P 500 Stocks | |
|
We now take in-depth look at all S&P 500 stocks including charts, multi-period performances and overall trends (as measured by Smart Investing & Trading Score). One can sort S&P 500 stocks (click link to choose) by Daily, Weekly and by Year-to-Date performances. Also, one can sort by size of the company or by market capitalization. |
| Select Your Default Chart Type: | |||||
| |||||
| Click on stock symbol or name for detailed view. Click on to add stock symbol to your watchlist and to view watchlist. Quick View: Move mouse or cursor over "Daily" to quickly view daily technical stock chart and over "Weekly" to view weekly technical stock chart. | |||||

 | MOH Molina Healthcare, Inc. |
| Sector: Health Care | |
| SubSector: Health Care Plans | |
| MarketCap: 7235.6 Millions | |
| Recent Price: 345.84 Smart Investing & Trading Score: 32 | |
| Day Percent Change: -1.18% Day Change: -4.13 | |
| Week Change: -2.47% Year-to-date Change: -4.3% | |
| MOH Links: Profile News Message Board | |
| Charts:- Daily , Weekly | |
| Add MOH to Watchlist: View: Get MOH Trend Analysis ➞ | |
 | MNST Monster Beverage Corporation |
| Sector: Consumer Staples | |
| SubSector: Beverages - Soft Drinks | |
| MarketCap: 30126.8 Millions | |
| Recent Price: 54.24 Smart Investing & Trading Score: 32 | |
| Day Percent Change: -0.44% Day Change: -0.24 | |
| Week Change: -2.2% Year-to-date Change: -5.9% | |
| MNST Links: Profile News Message Board | |
| Charts:- Daily , Weekly | |
| Add MNST to Watchlist: View: Get MNST Trend Analysis ➞ | |
 | JBHT J.B. Hunt Transport Services, Inc. |
| Sector: Transports | |
| SubSector: Trucking | |
| MarketCap: 9074 Millions | |
| Recent Price: 167.59 Smart Investing & Trading Score: 32 | |
| Day Percent Change: -0.34% Day Change: -0.57 | |
| Week Change: -1.76% Year-to-date Change: -16.1% | |
| JBHT Links: Profile News Message Board | |
| Charts:- Daily , Weekly | |
| Add JBHT to Watchlist: View: Get JBHT Trend Analysis ➞ | |
 | CDW CDW Corporation |
| Sector: Technology | |
| SubSector: Information Technology Services | |
| MarketCap: 12775 Millions | |
| Recent Price: 223.44 Smart Investing & Trading Score: 32 | |
| Day Percent Change: 0.84% Day Change: 1.86 | |
| Week Change: 0.44% Year-to-date Change: -1.7% | |
| CDW Links: Profile News Message Board | |
| Charts:- Daily , Weekly | |
| Add CDW to Watchlist: View: Get CDW Trend Analysis ➞ | |
 | CME CME Group Inc. |
| Sector: Financials | |
| SubSector: Investment Brokerage - National | |
| MarketCap: 64145 Millions | |
| Recent Price: 208.26 Smart Investing & Trading Score: 32 | |
| Day Percent Change: -1.20% Day Change: -2.54 | |
| Week Change: -0.1% Year-to-date Change: -1.1% | |
| CME Links: Profile News Message Board | |
| Charts:- Daily , Weekly | |
| Add CME to Watchlist: View: Get CME Trend Analysis ➞ | |
 | SYF Synchrony Financial |
| Sector: Financials | |
| SubSector: Credit Services | |
| MarketCap: 9297.28 Millions | |
| Recent Price: 44.14 Smart Investing & Trading Score: 31 | |
| Day Percent Change: -2.30% Day Change: -1.04 | |
| Week Change: -3.48% Year-to-date Change: 15.6% | |
| SYF Links: Profile News Message Board | |
| Charts:- Daily , Weekly | |
| Add SYF to Watchlist: View: Get SYF Trend Analysis ➞ | |
 | TGT Target Corporation |
| Sector: Services & Goods | |
| SubSector: Discount, Variety Stores | |
| MarketCap: 55980.6 Millions | |
| Recent Price: 157.51 Smart Investing & Trading Score: 31 | |
| Day Percent Change: -0.91% Day Change: -1.45 | |
| Week Change: -3.45% Year-to-date Change: 10.6% | |
| TGT Links: Profile News Message Board | |
| Charts:- Daily , Weekly | |
| Add TGT to Watchlist: View: Get TGT Trend Analysis ➞ | |
 | FANG Diamondback Energy, Inc. |
| Sector: Energy | |
| SubSector: Independent Oil & Gas | |
| MarketCap: 3009.13 Millions | |
| Recent Price: 196.74 Smart Investing & Trading Score: 31 | |
| Day Percent Change: -0.66% Day Change: -1.31 | |
| Week Change: -2.7% Year-to-date Change: 26.9% | |
| FANG Links: Profile News Message Board | |
| Charts:- Daily , Weekly | |
| Add FANG to Watchlist: View: Get FANG Trend Analysis ➞ | |
 | SLB Schlumberger Limited |
| Sector: Energy | |
| SubSector: Oil & Gas Equipment & Services | |
| MarketCap: 23892 Millions | |
| Recent Price: 48.31 Smart Investing & Trading Score: 31 | |
| Day Percent Change: -0.64% Day Change: -0.31 | |
| Week Change: -0.39% Year-to-date Change: -7.2% | |
| SLB Links: Profile News Message Board | |
| Charts:- Daily , Weekly | |
| Add SLB to Watchlist: View: Get SLB Trend Analysis ➞ | |
 | ACN Accenture plc |
| Sector: Technology | |
| SubSector: Information Technology Services | |
| MarketCap: 106627 Millions | |
| Recent Price: 308.52 Smart Investing & Trading Score: 30 | |
| Day Percent Change: 0.51% Day Change: 1.57 | |
| Week Change: 0.71% Year-to-date Change: -12.1% | |
| ACN Links: Profile News Message Board | |
| Charts:- Daily , Weekly | |
| Add ACN to Watchlist: View: Get ACN Trend Analysis ➞ | |
 | CZR Caesars Entertainment Corporation |
| Sector: Services & Goods | |
| SubSector: Resorts & Casinos | |
| MarketCap: 4618.44 Millions | |
| Recent Price: 36.27 Smart Investing & Trading Score: 30 | |
| Day Percent Change: -1.20% Day Change: -0.44 | |
| Week Change: 0.25% Year-to-date Change: -22.6% | |
| CZR Links: Profile News Message Board | |
| Charts:- Daily , Weekly | |
| Add CZR to Watchlist: View: Get CZR Trend Analysis ➞ | |
 | ABT Abbott Laboratories |
| Sector: Health Care | |
| SubSector: Medical Appliances & Equipment | |
| MarketCap: 125288 Millions | |
| Recent Price: 104.59 Smart Investing & Trading Score: 28 | |
| Day Percent Change: 0.56% Day Change: 0.58 | |
| Week Change: -0.14% Year-to-date Change: -5.0% | |
| ABT Links: Profile News Message Board | |
| Charts:- Daily , Weekly | |
| Add ABT to Watchlist: View: Get ABT Trend Analysis ➞ | |
 | VRSN VeriSign, Inc. |
| Sector: Technology | |
| SubSector: Internet Information Providers | |
| MarketCap: 19657 Millions | |
| Recent Price: 169.25 Smart Investing & Trading Score: 27 | |
| Day Percent Change: -0.28% Day Change: -0.48 | |
| Week Change: -1.16% Year-to-date Change: -17.8% | |
| VRSN Links: Profile News Message Board | |
| Charts:- Daily , Weekly | |
| Add VRSN to Watchlist: View: Get VRSN Trend Analysis ➞ | |
 | IEX IDEX Corporation |
| Sector: Industrials | |
| SubSector: Diversified Machinery | |
| MarketCap: 9721.46 Millions | |
| Recent Price: 224.20 Smart Investing & Trading Score: 27 | |
| Day Percent Change: -0.20% Day Change: -0.46 | |
| Week Change: -0.87% Year-to-date Change: 3.3% | |
| IEX Links: Profile News Message Board | |
| Charts:- Daily , Weekly | |
| Add IEX to Watchlist: View: Get IEX Trend Analysis ➞ | |
 | CSGP CoStar Group, Inc. |
| Sector: Financials | |
| SubSector: Property Management | |
| MarketCap: 21454.4 Millions | |
| Recent Price: 88.48 Smart Investing & Trading Score: 26 | |
| Day Percent Change: 0.80% Day Change: 0.70 | |
| Week Change: -1.56% Year-to-date Change: 1.3% | |
| CSGP Links: Profile News Message Board | |
| Charts:- Daily , Weekly | |
| Add CSGP to Watchlist: View: Get CSGP Trend Analysis ➞ | |
 | ALL The Allstate Corporation |
| Sector: Financials | |
| SubSector: Property & Casualty Insurance | |
| MarketCap: 25916.6 Millions | |
| Recent Price: 166.27 Smart Investing & Trading Score: 26 | |
| Day Percent Change: -1.66% Day Change: -2.81 | |
| Week Change: -3.73% Year-to-date Change: 18.8% | |
| ALL Links: Profile News Message Board | |
| Charts:- Daily , Weekly | |
| Add ALL to Watchlist: View: Get ALL Trend Analysis ➞ | |
 | CI Cigna Corporation |
| Sector: Health Care | |
| SubSector: Health Care Plans | |
| MarketCap: 60251.8 Millions | |
| Recent Price: 343.28 Smart Investing & Trading Score: 26 | |
| Day Percent Change: -0.91% Day Change: -3.14 | |
| Week Change: -1.47% Year-to-date Change: 14.6% | |
| CI Links: Profile News Message Board | |
| Charts:- Daily , Weekly | |
| Add CI to Watchlist: View: Get CI Trend Analysis ➞ | |
 | STZ Constellation Brands, Inc. |
| Sector: Consumer Staples | |
| SubSector: Beverages - Wineries & Distillers | |
| MarketCap: 27394.5 Millions | |
| Recent Price: 252.29 Smart Investing & Trading Score: 26 | |
| Day Percent Change: -0.67% Day Change: -1.70 | |
| Week Change: -3.69% Year-to-date Change: 4.4% | |
| STZ Links: Profile News Message Board | |
| Charts:- Daily , Weekly | |
| Add STZ to Watchlist: View: Get STZ Trend Analysis ➞ | |
 | RSG Republic Services, Inc. |
| Sector: Industrials | |
| SubSector: Waste Management | |
| MarketCap: 26178.6 Millions | |
| Recent Price: 186.97 Smart Investing & Trading Score: 26 | |
| Day Percent Change: -0.20% Day Change: -0.37 | |
| Week Change: -1.2% Year-to-date Change: 13.4% | |
| RSG Links: Profile News Message Board | |
| Charts:- Daily , Weekly | |
| Add RSG to Watchlist: View: Get RSG Trend Analysis ➞ | |
 | EPAM EPAM Systems, Inc. |
| Sector: Technology | |
| SubSector: Information Technology Services | |
| MarketCap: 11519.6 Millions | |
| Recent Price: 190.48 Smart Investing & Trading Score: 25 | |
| Day Percent Change: 1.83% Day Change: 3.43 | |
| Week Change: 3.86% Year-to-date Change: -35.9% | |
| EPAM Links: Profile News Message Board | |
| Charts:- Daily , Weekly | |
| Add EPAM to Watchlist: View: Get EPAM Trend Analysis ➞ | |
 | JNPR Juniper Networks, Inc. |
| Sector: Technology | |
| SubSector: Communication Equipment | |
| MarketCap: 6161.49 Millions | |
| Recent Price: 34.58 Smart Investing & Trading Score: 25 | |
| Day Percent Change: 0.41% Day Change: 0.14 | |
| Week Change: -0.17% Year-to-date Change: 17.3% | |
| JNPR Links: Profile News Message Board | |
| Charts:- Daily , Weekly | |
| Add JNPR to Watchlist: View: Get JNPR Trend Analysis ➞ | |
 | CTLT Catalent, Inc. |
| Sector: Health Care | |
| SubSector: Drugs - Generic | |
| MarketCap: 6351.95 Millions | |
| Recent Price: 55.61 Smart Investing & Trading Score: 25 | |
| Day Percent Change: 0.16% Day Change: 0.09 | |
| Week Change: -0.36% Year-to-date Change: 23.8% | |
| CTLT Links: Profile News Message Board | |
| Charts:- Daily , Weekly | |
| Add CTLT to Watchlist: View: Get CTLT Trend Analysis ➞ | |
 | LVS Las Vegas Sands Corp. |
| Sector: Services & Goods | |
| SubSector: Resorts & Casinos | |
| MarketCap: 36431.6 Millions | |
| Recent Price: 46.11 Smart Investing & Trading Score: 25 | |
| Day Percent Change: -0.45% Day Change: -0.21 | |
| Week Change: -0.92% Year-to-date Change: -6.3% | |
| LVS Links: Profile News Message Board | |
| Charts:- Daily , Weekly | |
| Add LVS to Watchlist: View: Get LVS Trend Analysis ➞ | |
 | UBER Uber Technologies, Inc. |
| Sector: Technology | |
| SubSector: Application Software | |
| MarketCap: 42671.2 Millions | |
| Recent Price: 66.62 Smart Investing & Trading Score: 25 | |
| Day Percent Change: 1.99% Day Change: 1.30 | |
| Week Change: -0.39% Year-to-date Change: 8.2% | |
| UBER Links: Profile News Message Board | |
| Charts:- Daily , Weekly | |
| Add UBER to Watchlist: View: Get UBER Trend Analysis ➞ | |
 | AME AMETEK, Inc. |
| Sector: Industrials | |
| SubSector: Diversified Machinery | |
| MarketCap: 16611.8 Millions | |
| Recent Price: 169.63 Smart Investing & Trading Score: 25 | |
| Day Percent Change: 0.65% Day Change: 1.10 | |
| Week Change: -0.69% Year-to-date Change: 2.9% | |
| AME Links: Profile News Message Board | |
| Charts:- Daily , Weekly | |
| Add AME to Watchlist: View: Get AME Trend Analysis ➞ | |
| For tabular summary view of above stock list: Summary View ➞ 0 - 25 , 25 - 50 , 50 - 75 , 75 - 100 , 100 - 125 , 125 - 150 , 150 - 175 , 175 - 200 , 200 - 225 , 225 - 250 , 250 - 275 , 275 - 300 , 300 - 325 , 325 - 350 , 350 - 375 , 375 - 400 , 400 - 425 , 425 - 450 , 450 - 475 , 475 - 500 | ||
| Click To Change The Sort Order: By Market Cap or Company Size Performance: Year-to-date, Week and Day | |
| Select Chart Type: | ||
|
Best Stocks Today 12Stocks.com |
© 2024 12Stocks.com Terms & Conditions Privacy Contact Us
All Information Provided Only For Education And Not To Be Used For Investing or Trading. See Terms & Conditions


One More Thing ... Get Best Stocks Delivered Daily!
Never Ever Miss A Move With Our Top Ten Stocks Lists
Find Best Stocks In Any Market - Bull or Bear Market
Take A Peek At Our Top Ten Stocks Lists: Daily, Weekly, Year-to-Date & Top Trends
Find Best Stocks In Any Market - Bull or Bear Market
Take A Peek At Our Top Ten Stocks Lists: Daily, Weekly, Year-to-Date & Top Trends
S&P 500 Stocks With Best Up Trends [0-bearish to 100-bullish]: MarketAxess Holdings[100], Edwards Life[100], KLA [100], AES [100], Arista Networks[100], Monolithic Power[100], Teradyne [100], Biogen [100], Applied Materials[100], ProShares UltraPro[100], KeyCorp [100]
Best S&P 500 Stocks Year-to-Date:
NVIDIA [91.09%], Constellation [90.68%], NRG [63.42%], Micron [49.77%], Western Digital[44.53%], Eaton [40.34%], Chipotle Mexican[38.54%], Arista Networks[38.44%], Leidos Holdings[36.04%], Meta Platforms[36.02%], Eli Lilly[35.01%] Best S&P 500 Stocks This Week:
Insulet [8.84%], Moderna [8.02%], Teleflex [7.78%], Broadcom [7.76%], IDEXX [7.59%], Incyte [7.52%], Teradyne [7.35%], QUALCOMM [6.88%], Equinix [6.86%], Tapestry [6.8%], Bio-Rad [6.73%] Best S&P 500 Stocks Daily:
D.R. Horton[6.47%], MarketAxess Holdings[6.11%], ServiceNow [5.40%], IDEXX [5.26%], Lennar [5.25%], Pulte [5.07%], Insulet [4.81%], Edwards Life[4.28%], Advanced Micro[4.25%], Blackstone [4.24%], KLA [4.08%]