
 Login Sign Up


| |||||
 |  | ||||

| 12Stocks.com Market Intelligence |
Best S&P 500 Stocks
|
On this page, you will find the most comprehensive analysis of S&P 500 stocks and ETFs - from latest trends to performances to charts ➞. First, here are the year-to-date (YTD) performances of the most requested S&P 500 stocks at 12Stocks.com (click stock for review):
| NVIDIA 91% | ||
| Google 23% | ||
| Amazon.com 22% | ||
| Caterpillar 22% | ||
| Merck 21% | ||
| Goldman Sachs 21% | ||
| JPMorgan Chase 19% | ||
| Walmart 14% | ||
| Microsoft 13% | ||
| Chevron 9% | ||
| Apple -1% | ||
| Johnson & Johnson -3% | ||
| McDonald s -8% | ||
| Gilead -17% | ||
| Starbucks -21% | ||
| Boeing -32% | ||
| Intel -38% | ||
| Quick: S&P 500 Stocks Lists: Performances & Trends, S&P 500 Stock Charts
Sort S&P 500 stocks: Daily, Weekly, Year-to-Date, Market Cap & Trends. Filter S&P 500 stocks list by sector: Show all, Tech, Finance, Energy, Staples, Retail, Industrial, Materials, Utilities and HealthCare |
| 12Stocks.com S&P 500 Stocks Performances & Trends Daily Report | |||||||||
|
| 
The overall Smart Investing & Trading Score is 100 (0-bearish to 100-bullish) which puts S&P 500 index in short term bullish trend. The Smart Investing & Trading Score from previous trading session is 83 and hence an improvement of trend. | ||||||||
Here are the Smart Investing & Trading Scores of the most requested S&P 500 stocks at 12Stocks.com (click stock name for detailed review):
|


| 12Stocks.com: Top Performing S&P 500 Index Stocks | ||||||||||||||||||||||||||||||||||||||||||||||||
 The top performing S&P 500 Index stocks year to date are
Now, more recently, over last week, the top performing S&P 500 Index stocks on the move are


|
||||||||||||||||||||||||||||||||||||||||||||||||
| 12Stocks.com: Investing in S&P 500 Index with Stocks | |
|
The following table helps investors and traders sort through current performance and trends (as measured by Smart Investing & Trading Score) of various
stocks in the S&P 500 Index. Quick View: Move mouse or cursor over stock symbol (ticker) to view short-term technical chart and over stock name to view long term chart. Click on  to add stock symbol to your watchlist and to add stock symbol to your watchlist and  to view watchlist. Click on any ticker or stock name for detailed market intelligence report for that stock. to view watchlist. Click on any ticker or stock name for detailed market intelligence report for that stock. |
12Stocks.com Performance of Stocks in S&P 500 Index
| Ticker | Stock Name | Watchlist | Category | Recent Price | Smart Investing & Trading Score | Change % | YTD Change% |
| MKTX | MarketAxess Holdings |   | Financials | 216.91 | 100 | 6.11% | -25.93% |
| EW | Edwards Life | | Health Care | 90.16 | 100 | 4.28% | 18.24% |
| KLAC | KLA | | Technology | 759.72 | 100 | 4.08% | 30.69% |
| AES | AES | | Utilities | 21.13 | 100 | 3.99% | 9.77% |
| ANET | Arista Networks | | Technology | 326.03 | 100 | 3.94% | 38.44% |
| MPWR | Monolithic Power | | Technology | 741.34 | 100 | 3.87% | 17.53% |
| TER | Teradyne | | Technology | 131.95 | 100 | 3.81% | 21.59% |
| BIIB | Biogen | | Health Care | 235.32 | 100 | 3.72% | -9.06% |
| AMAT | Applied Materials | | Technology | 217.49 | 100 | 3.66% | 34.20% |
| UPRO | ProShares UltraPro | | Utilities | 71.64 | 100 | 3.66% | 30.87% |
| KEY | KeyCorp | | Financials | 15.57 | 100 | 3.04% | 8.13% |
| QCOM | QUALCOMM | | Technology | 194.61 | 100 | 2.98% | 34.56% |
| NRG | NRG | | Utilities | 84.49 | 100 | 2.94% | 63.42% |
| WDC | Western Digital | | Technology | 75.69 | 100 | 2.92% | 44.53% |
| KEYS | Keysight Technologies | | Technology | 155.70 | 100 | 2.77% | -2.13% |
| APH | Amphenol | | Technology | 131.96 | 100 | 2.64% | 33.12% |
| STX | Seagate | | Technology | 98.72 | 100 | 2.60% | 15.64% |
| CEG | Constellation | | Utilities | 223.31 | 100 | 2.56% | 90.68% |
| PSA | Public Storage | | Financials | 286.65 | 100 | 2.44% | -6.02% |
| MU | Micron | | Technology | 127.81 | 100 | 2.40% | 49.77% |
| WRK | WestRock | | Consumer Staples | 52.88 | 100 | 2.36% | 27.36% |
| EXR | Extra Space | | Financials | 152.08 | 100 | 2.31% | -5.15% |
| TXN | Texas Instruments | | Technology | 195.53 | 100 | 2.30% | 14.71% |
| ETN | Eaton | | Industrials | 337.96 | 100 | 2.27% | 40.34% |
| IRM | Iron Mountain | | Technology | 82.34 | 100 | 2.25% | 17.66% |
| For chart view version of above stock list: Chart View ➞ 0 - 25 , 25 - 50 , 50 - 75 , 75 - 100 , 100 - 125 , 125 - 150 , 150 - 175 , 175 - 200 , 200 - 225 , 225 - 250 , 250 - 275 , 275 - 300 , 300 - 325 , 325 - 350 , 350 - 375 , 375 - 400 , 400 - 425 , 425 - 450 , 450 - 475 , 475 - 500 | ||
 | Click To Change The Sort Order: By Market Cap or Company Size Performance: Year-to-date, Week and Day |  |
|
Get the most comprehensive stock market coverage daily at 12Stocks.com ➞ Best Stocks Today ➞ Best Stocks Weekly ➞ Best Stocks Year-to-Date ➞ Best Stocks Trends ➞  Best Stocks Today 12Stocks.com Best Nasdaq Stocks ➞ Best S&P 500 Stocks ➞ Best Tech Stocks ➞ Best Biotech Stocks ➞ |
| Detailed Overview of S&P 500 Stocks |
| S&P 500 Technical Overview, Leaders & Laggards, Top S&P 500 ETF Funds & Detailed S&P 500 Stocks List, Charts, Trends & More |
| S&P 500: Technical Analysis, Trends & YTD Performance | |
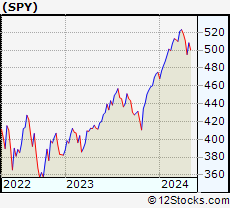
| S&P 500 index as represented by
SPY, an exchange-traded fund [ETF], holds basket of five hundred (mostly largecap) stocks from across all major sectors of the US stock market. The S&P 500 index (contains stocks like Apple and Exxon) is up by 11.46% and is currently outperforming the overall market by 0.74% year-to-date. Below is a quick view of technical charts and trends: | |
 SPY Weekly Chart |
|
| Long Term Trend: Very Good | |
| Medium Term Trend: Very Good | |
 SPY Daily Chart |
|
| Short Term Trend: Very Good | |
| Overall Trend Score: 100 | |
| YTD Performance: 11.46% | |
| **Trend Scores & Views Are Only For Educational Purposes And Not For Investing | |
| 12Stocks.com: Investing in S&P 500 Index using Exchange Traded Funds | |
|
The following table shows list of key exchange traded funds (ETF) that
help investors track S&P 500 index. The following list also includes leveraged ETF funds that track twice or thrice the daily returns of S&P 500 indices. Short or inverse ETF funds move in the opposite direction to the index they track and are useful during market pullbacks or during bear markets. Quick View: Move mouse or cursor over ETF symbol (ticker) to view short-term technical chart and over ETF name to view long term chart. Click on ticker or stock name for detailed view. Click on to add stock symbol to your watchlist and to view watchlist. |
12Stocks.com List of ETFs that track S&P 500 Index
| Ticker | ETF Name | Watchlist | Recent Price | Smart Investing & Trading Score | Change % | Week % | Year-to-date % |
| SPY | SPDR S&P 500 ETF | | 529.78 | 100 | 1.24 | 1.72 | 11.46% |
| IVV | iShares Core S&P 500 ETF | | 530.30 | 100 | 0.83 | 1.32 | 11.03% |
| VOO | Vanguard 500 ETF | | 484.99 | 100 | 0.82 | 1.31 | 11.03% |
| OEF | iShares S&P 100 | | 252.61 | 100 | 1.27 | 1.92 | 13.08% |
| SSO | ProShares Ultra S&P500 | | 78.67 | 95 | 2.46 | 3.34 | 20.9% |
| UPRO | ProShares UltraPro S&P500 | | 71.64 | 100 | 3.66 | 5 | 30.87% |
| SPXL | Direxion Daily S&P500 Bull 3X ETF | | 134.55 | 100 | 2.55 | 3.86 | 29.39% |
| SH | ProShares Short S&P500 | | 11.83 | 0 | -1.17 | -1.58 | -8.93% |
| SDS | ProShares UltraShort S&P500 | | 24.52 | 0 | -2.43 | -3.27 | -18.05% |
| SPXU | ProShares UltraPro Short S&P500 | | 31.49 | 0 | -3.64 | -4.89 | -26.77% |
| SPXS | Direxion Daily S&P 500 Bear 3X ETF | | 8.63 | 10 | -2.38 | -3.79 | -25.28% |
| 12Stocks.com: Charts, Trends, Fundamental Data and Performances of S&P 500 Stocks | |
|
We now take in-depth look at all S&P 500 stocks including charts, multi-period performances and overall trends (as measured by Smart Investing & Trading Score). One can sort S&P 500 stocks (click link to choose) by Daily, Weekly and by Year-to-Date performances. Also, one can sort by size of the company or by market capitalization. |
| Select Your Default Chart Type: | |||||
| |||||
| Click on stock symbol or name for detailed view. Click on to add stock symbol to your watchlist and to view watchlist. Quick View: Move mouse or cursor over "Daily" to quickly view daily technical stock chart and over "Weekly" to view weekly technical stock chart. | |||||

 | MKTX MarketAxess Holdings Inc. |
| Sector: Financials | |
| SubSector: Investment Brokerage - National | |
| MarketCap: 12431.5 Millions | |
| Recent Price: 216.91 Smart Investing & Trading Score: 100 | |
| Day Percent Change: 6.11% Day Change: 12.49 | |
| Week Change: 5.24% Year-to-date Change: -25.9% | |
| MKTX Links: Profile News Message Board | |
| Charts:- Daily , Weekly | |
| Add MKTX to Watchlist: View: Get MKTX Trend Analysis ➞ | |
 | EW Edwards Lifesciences Corporation |
| Sector: Health Care | |
| SubSector: Medical Appliances & Equipment | |
| MarketCap: 36735.5 Millions | |
| Recent Price: 90.16 Smart Investing & Trading Score: 100 | |
| Day Percent Change: 4.28% Day Change: 3.70 | |
| Week Change: 3.97% Year-to-date Change: 18.2% | |
| EW Links: Profile News Message Board | |
| Charts:- Daily , Weekly | |
| Add EW to Watchlist: View: Get EW Trend Analysis ➞ | |
 | KLAC KLA Corporation |
| Sector: Technology | |
| SubSector: Semiconductor Equipment & Materials | |
| MarketCap: 20663.8 Millions | |
| Recent Price: 759.72 Smart Investing & Trading Score: 100 | |
| Day Percent Change: 4.08% Day Change: 29.80 | |
| Week Change: 5.77% Year-to-date Change: 30.7% | |
| KLAC Links: Profile News Message Board | |
| Charts:- Daily , Weekly | |
| Add KLAC to Watchlist: View: Get KLAC Trend Analysis ➞ | |
 | AES The AES Corporation |
| Sector: Utilities | |
| SubSector: Electric Utilities | |
| MarketCap: 9173.44 Millions | |
| Recent Price: 21.13 Smart Investing & Trading Score: 100 | |
| Day Percent Change: 3.99% Day Change: 0.81 | |
| Week Change: 5.97% Year-to-date Change: 9.8% | |
| AES Links: Profile News Message Board | |
| Charts:- Daily , Weekly | |
| Add AES to Watchlist: View: Get AES Trend Analysis ➞ | |
 | ANET Arista Networks, Inc. |
| Sector: Technology | |
| SubSector: Diversified Computer Systems | |
| MarketCap: 14071.2 Millions | |
| Recent Price: 326.03 Smart Investing & Trading Score: 100 | |
| Day Percent Change: 3.94% Day Change: 12.37 | |
| Week Change: 3.82% Year-to-date Change: 38.4% | |
| ANET Links: Profile News Message Board | |
| Charts:- Daily , Weekly | |
| Add ANET to Watchlist: View: Get ANET Trend Analysis ➞ | |
 | MPWR Monolithic Power Systems, Inc. |
| Sector: Technology | |
| SubSector: Semiconductor - Specialized | |
| MarketCap: 6436.4 Millions | |
| Recent Price: 741.34 Smart Investing & Trading Score: 100 | |
| Day Percent Change: 3.87% Day Change: 27.63 | |
| Week Change: 5.52% Year-to-date Change: 17.5% | |
| MPWR Links: Profile News Message Board | |
| Charts:- Daily , Weekly | |
| Add MPWR to Watchlist: View: Get MPWR Trend Analysis ➞ | |
 | TER Teradyne, Inc. |
| Sector: Technology | |
| SubSector: Semiconductor Equipment & Materials | |
| MarketCap: 8135.68 Millions | |
| Recent Price: 131.95 Smart Investing & Trading Score: 100 | |
| Day Percent Change: 3.81% Day Change: 4.84 | |
| Week Change: 7.35% Year-to-date Change: 21.6% | |
| TER Links: Profile News Message Board | |
| Charts:- Daily , Weekly | |
| Add TER to Watchlist: View: Get TER Trend Analysis ➞ | |
 | BIIB Biogen Inc. |
| Sector: Health Care | |
| SubSector: Biotechnology | |
| MarketCap: 53102.6 Millions | |
| Recent Price: 235.32 Smart Investing & Trading Score: 100 | |
| Day Percent Change: 3.72% Day Change: 8.44 | |
| Week Change: 6.24% Year-to-date Change: -9.1% | |
| BIIB Links: Profile News Message Board | |
| Charts:- Daily , Weekly | |
| Add BIIB to Watchlist: View: Get BIIB Trend Analysis ➞ | |
 | AMAT Applied Materials, Inc. |
| Sector: Technology | |
| SubSector: Semiconductor Equipment & Materials | |
| MarketCap: 40593.8 Millions | |
| Recent Price: 217.49 Smart Investing & Trading Score: 100 | |
| Day Percent Change: 3.66% Day Change: 7.67 | |
| Week Change: 3.7% Year-to-date Change: 34.2% | |
| AMAT Links: Profile News Message Board | |
| Charts:- Daily , Weekly | |
| Add AMAT to Watchlist: View: Get AMAT Trend Analysis ➞ | |
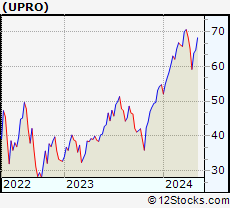 | UPRO ProShares UltraPro S&P500 |
| Sector: Utilities | |
| SubSector: Exchange Traded Fund | |
| MarketCap: 0 Millions | |
| Recent Price: 71.64 Smart Investing & Trading Score: 100 | |
| Day Percent Change: 3.66% Day Change: 2.53 | |
| Week Change: 5% Year-to-date Change: 30.9% | |
| UPRO Links: Profile News Message Board | |
| Charts:- Daily , Weekly | |
| Add UPRO to Watchlist: View: Get UPRO Trend Analysis ➞ | |
 | KEY KeyCorp |
| Sector: Financials | |
| SubSector: Regional - Midwest Banks | |
| MarketCap: 10045 Millions | |
| Recent Price: 15.57 Smart Investing & Trading Score: 100 | |
| Day Percent Change: 3.04% Day Change: 0.46 | |
| Week Change: 3.25% Year-to-date Change: 8.1% | |
| KEY Links: Profile News Message Board | |
| Charts:- Daily , Weekly | |
| Add KEY to Watchlist: View: Get KEY Trend Analysis ➞ | |
 | QCOM QUALCOMM Incorporated |
| Sector: Technology | |
| SubSector: Communication Equipment | |
| MarketCap: 77517.7 Millions | |
| Recent Price: 194.61 Smart Investing & Trading Score: 100 | |
| Day Percent Change: 2.98% Day Change: 5.64 | |
| Week Change: 6.88% Year-to-date Change: 34.6% | |
| QCOM Links: Profile News Message Board | |
| Charts:- Daily , Weekly | |
| Add QCOM to Watchlist: View: Get QCOM Trend Analysis ➞ | |
 | NRG NRG Energy, Inc. |
| Sector: Utilities | |
| SubSector: Diversified Utilities | |
| MarketCap: 6510.7 Millions | |
| Recent Price: 84.49 Smart Investing & Trading Score: 100 | |
| Day Percent Change: 2.94% Day Change: 2.41 | |
| Week Change: 1% Year-to-date Change: 63.4% | |
| NRG Links: Profile News Message Board | |
| Charts:- Daily , Weekly | |
| Add NRG to Watchlist: View: Get NRG Trend Analysis ➞ | |
 | WDC Western Digital Corporation |
| Sector: Technology | |
| SubSector: Data Storage Devices | |
| MarketCap: 10712.9 Millions | |
| Recent Price: 75.69 Smart Investing & Trading Score: 100 | |
| Day Percent Change: 2.92% Day Change: 2.15 | |
| Week Change: 5.71% Year-to-date Change: 44.5% | |
| WDC Links: Profile News Message Board | |
| Charts:- Daily , Weekly | |
| Add WDC to Watchlist: View: Get WDC Trend Analysis ➞ | |
 | KEYS Keysight Technologies, Inc. |
| Sector: Technology | |
| SubSector: Scientific & Technical Instruments | |
| MarketCap: 17355.1 Millions | |
| Recent Price: 155.70 Smart Investing & Trading Score: 100 | |
| Day Percent Change: 2.77% Day Change: 4.20 | |
| Week Change: 3.65% Year-to-date Change: -2.1% | |
| KEYS Links: Profile News Message Board | |
| Charts:- Daily , Weekly | |
| Add KEYS to Watchlist: View: Get KEYS Trend Analysis ➞ | |
 | APH Amphenol Corporation |
| Sector: Technology | |
| SubSector: Diversified Electronics | |
| MarketCap: 23422 Millions | |
| Recent Price: 131.96 Smart Investing & Trading Score: 100 | |
| Day Percent Change: 2.64% Day Change: 3.40 | |
| Week Change: 3.44% Year-to-date Change: 33.1% | |
| APH Links: Profile News Message Board | |
| Charts:- Daily , Weekly | |
| Add APH to Watchlist: View: Get APH Trend Analysis ➞ | |
 | STX Seagate Technology plc |
| Sector: Technology | |
| SubSector: Data Storage Devices | |
| MarketCap: 10814.7 Millions | |
| Recent Price: 98.72 Smart Investing & Trading Score: 100 | |
| Day Percent Change: 2.60% Day Change: 2.50 | |
| Week Change: 5.01% Year-to-date Change: 15.6% | |
| STX Links: Profile News Message Board | |
| Charts:- Daily , Weekly | |
| Add STX to Watchlist: View: Get STX Trend Analysis ➞ | |
 | CEG Constellation Energy Corporation |
| Sector: Utilities | |
| SubSector: Utilities - Renewable | |
| MarketCap: 29600 Millions | |
| Recent Price: 223.31 Smart Investing & Trading Score: 100 | |
| Day Percent Change: 2.56% Day Change: 5.57 | |
| Week Change: 3.9% Year-to-date Change: 90.7% | |
| CEG Links: Profile News Message Board | |
| Charts:- Daily , Weekly | |
| Add CEG to Watchlist: View: Get CEG Trend Analysis ➞ | |
 | PSA Public Storage |
| Sector: Financials | |
| SubSector: REIT - Industrial | |
| MarketCap: 32733.9 Millions | |
| Recent Price: 286.65 Smart Investing & Trading Score: 100 | |
| Day Percent Change: 2.44% Day Change: 6.82 | |
| Week Change: 3.88% Year-to-date Change: -6.0% | |
| PSA Links: Profile News Message Board | |
| Charts:- Daily , Weekly | |
| Add PSA to Watchlist: View: Get PSA Trend Analysis ➞ | |
 | MU Micron Technology, Inc. |
| Sector: Technology | |
| SubSector: Semiconductor- Memory Chips | |
| MarketCap: 45188.4 Millions | |
| Recent Price: 127.81 Smart Investing & Trading Score: 100 | |
| Day Percent Change: 2.40% Day Change: 3.00 | |
| Week Change: 5.42% Year-to-date Change: 49.8% | |
| MU Links: Profile News Message Board | |
| Charts:- Daily , Weekly | |
| Add MU to Watchlist: View: Get MU Trend Analysis ➞ | |
 | WRK WestRock Company |
| Sector: Consumer Staples | |
| SubSector: Packaging & Containers | |
| MarketCap: 7835.43 Millions | |
| Recent Price: 52.88 Smart Investing & Trading Score: 100 | |
| Day Percent Change: 2.36% Day Change: 1.22 | |
| Week Change: 2.4% Year-to-date Change: 27.4% | |
| WRK Links: Profile News Message Board | |
| Charts:- Daily , Weekly | |
| Add WRK to Watchlist: View: Get WRK Trend Analysis ➞ | |
 | EXR Extra Space Storage Inc. |
| Sector: Financials | |
| SubSector: REIT - Industrial | |
| MarketCap: 11203.9 Millions | |
| Recent Price: 152.08 Smart Investing & Trading Score: 100 | |
| Day Percent Change: 2.31% Day Change: 3.43 | |
| Week Change: 3.69% Year-to-date Change: -5.2% | |
| EXR Links: Profile News Message Board | |
| Charts:- Daily , Weekly | |
| Add EXR to Watchlist: View: Get EXR Trend Analysis ➞ | |
 | TXN Texas Instruments Incorporated |
| Sector: Technology | |
| SubSector: Semiconductor - Broad Line | |
| MarketCap: 99509.1 Millions | |
| Recent Price: 195.53 Smart Investing & Trading Score: 100 | |
| Day Percent Change: 2.30% Day Change: 4.40 | |
| Week Change: 4.53% Year-to-date Change: 14.7% | |
| TXN Links: Profile News Message Board | |
| Charts:- Daily , Weekly | |
| Add TXN to Watchlist: View: Get TXN Trend Analysis ➞ | |
 | ETN Eaton Corporation plc |
| Sector: Industrials | |
| SubSector: Diversified Machinery | |
| MarketCap: 29829.4 Millions | |
| Recent Price: 337.96 Smart Investing & Trading Score: 100 | |
| Day Percent Change: 2.27% Day Change: 7.51 | |
| Week Change: 2.24% Year-to-date Change: 40.3% | |
| ETN Links: Profile News Message Board | |
| Charts:- Daily , Weekly | |
| Add ETN to Watchlist: View: Get ETN Trend Analysis ➞ | |
 | IRM Iron Mountain Incorporated |
| Sector: Technology | |
| SubSector: Business Software & Services | |
| MarketCap: 7339.18 Millions | |
| Recent Price: 82.34 Smart Investing & Trading Score: 100 | |
| Day Percent Change: 2.25% Day Change: 1.81 | |
| Week Change: 3.22% Year-to-date Change: 17.7% | |
| IRM Links: Profile News Message Board | |
| Charts:- Daily , Weekly | |
| Add IRM to Watchlist: View: Get IRM Trend Analysis ➞ | |
| For tabular summary view of above stock list: Summary View ➞ 0 - 25 , 25 - 50 , 50 - 75 , 75 - 100 , 100 - 125 , 125 - 150 , 150 - 175 , 175 - 200 , 200 - 225 , 225 - 250 , 250 - 275 , 275 - 300 , 300 - 325 , 325 - 350 , 350 - 375 , 375 - 400 , 400 - 425 , 425 - 450 , 450 - 475 , 475 - 500 | ||
| Click To Change The Sort Order: By Market Cap or Company Size Performance: Year-to-date, Week and Day | |
| Select Chart Type: | ||
|
Best Stocks Today 12Stocks.com |
© 2024 12Stocks.com Terms & Conditions Privacy Contact Us
All Information Provided Only For Education And Not To Be Used For Investing or Trading. See Terms & Conditions


One More Thing ... Get Best Stocks Delivered Daily!
Never Ever Miss A Move With Our Top Ten Stocks Lists
Find Best Stocks In Any Market - Bull or Bear Market
Take A Peek At Our Top Ten Stocks Lists: Daily, Weekly, Year-to-Date & Top Trends
Find Best Stocks In Any Market - Bull or Bear Market
Take A Peek At Our Top Ten Stocks Lists: Daily, Weekly, Year-to-Date & Top Trends
S&P 500 Stocks With Best Up Trends [0-bearish to 100-bullish]: MarketAxess Holdings[100], Edwards Life[100], KLA [100], AES [100], Arista Networks[100], Monolithic Power[100], Teradyne [100], Biogen [100], Applied Materials[100], ProShares UltraPro[100], KeyCorp [100]
Best S&P 500 Stocks Year-to-Date:
NVIDIA [91.09%], Constellation [90.68%], NRG [63.42%], Micron [49.77%], Western Digital[44.53%], Eaton [40.34%], Chipotle Mexican[38.54%], Arista Networks[38.44%], Leidos Holdings[36.04%], Meta Platforms[36.02%], Eli Lilly[35.01%] Best S&P 500 Stocks This Week:
Insulet [8.84%], Moderna [8.02%], Teleflex [7.78%], Broadcom [7.76%], IDEXX [7.59%], Incyte [7.52%], Teradyne [7.35%], QUALCOMM [6.88%], Equinix [6.86%], Tapestry [6.8%], Bio-Rad [6.73%] Best S&P 500 Stocks Daily:
D.R. Horton[6.47%], MarketAxess Holdings[6.11%], ServiceNow [5.40%], IDEXX [5.26%], Lennar [5.25%], Pulte [5.07%], Insulet [4.81%], Edwards Life[4.28%], Advanced Micro[4.25%], Blackstone [4.24%], KLA [4.08%]