
 Login Sign Up


| |||||
 |  | ||||

| 12Stocks.com Market Intelligence |
Best S&P 500 Stocks
|
On this page, you will find the most comprehensive analysis of S&P 500 stocks and ETFs - from latest trends to performances to charts ➞. First, here are the year-to-date (YTD) performances of the most requested S&P 500 stocks at 12Stocks.com (click stock for review):
| NVIDIA 93% | ||
| Google 25% | ||
| Amazon.com 23% | ||
| Goldman Sachs 21% | ||
| Walmart 21% | ||
| Caterpillar 20% | ||
| Merck 20% | ||
| JPMorgan Chase 20% | ||
| Microsoft 13% | ||
| Chevron 8% | ||
| Apple -1% | ||
| Johnson & Johnson -2% | ||
| McDonald s -7% | ||
| Gilead -17% | ||
| Starbucks -22% | ||
| Boeing -30% | ||
| Intel -37% | ||
| Quick: S&P 500 Stocks Lists: Performances & Trends, S&P 500 Stock Charts
Sort S&P 500 stocks: Daily, Weekly, Year-to-Date, Market Cap & Trends. Filter S&P 500 stocks list by sector: Show all, Tech, Finance, Energy, Staples, Retail, Industrial, Materials, Utilities and HealthCare |
| 12Stocks.com S&P 500 Stocks Performances & Trends Daily Report | |||||||||
|
| 
The overall Smart Investing & Trading Score is 95 (0-bearish to 100-bullish) which puts S&P 500 index in short term bullish trend. The Smart Investing & Trading Score from previous trading session is 100 and hence a deterioration of trend. | ||||||||
Here are the Smart Investing & Trading Scores of the most requested S&P 500 stocks at 12Stocks.com (click stock name for detailed review):
|


| 12Stocks.com: Top Performing S&P 500 Index Stocks | ||||||||||||||||||||||||||||||||||||||||||||||||
 The top performing S&P 500 Index stocks year to date are
Now, more recently, over last week, the top performing S&P 500 Index stocks on the move are


|
||||||||||||||||||||||||||||||||||||||||||||||||
| 12Stocks.com: Investing in S&P 500 Index with Stocks | |
|
The following table helps investors and traders sort through current performance and trends (as measured by Smart Investing & Trading Score) of various
stocks in the S&P 500 Index. Quick View: Move mouse or cursor over stock symbol (ticker) to view short-term technical chart and over stock name to view long term chart. Click on  to add stock symbol to your watchlist and to add stock symbol to your watchlist and  to view watchlist. Click on any ticker or stock name for detailed market intelligence report for that stock. to view watchlist. Click on any ticker or stock name for detailed market intelligence report for that stock. |
12Stocks.com Performance of Stocks in S&P 500 Index
| Ticker | Stock Name | Watchlist | Category | Recent Price | Smart Investing & Trading Score | Change % | YTD Change% |
| CMS | CMS |   | Utilities | 63.27 | 83 | 0.44% | 8.95% |
| MTB | M&T Bank | | Financials | 154.91 | 83 | 0.21% | 13.01% |
| CL | Colgate-Palmolive | | Consumer Staples | 94.57 | 83 | 0.04% | 18.64% |
| REGN | Regeneron | | Health Care | 976.88 | 83 | -0.14% | 11.23% |
| AWK | American Water | | Utilities | 133.62 | 83 | -0.10% | 1.23% |
| HUM | Humana | | Health Care | 355.29 | 82 | 2.34% | -22.39% |
| CBRE | CBRE | | Financials | 93.33 | 82 | 1.16% | 0.26% |
| ICE | Intercontinental Exchange | | Financials | 138.28 | 82 | 0.29% | 7.67% |
| FSLR | First Solar | | Technology | 192.04 | 81 | 0.06% | 11.47% |
| HON | Honeywell | | Industrials | 206.63 | 81 | 0.77% | -1.47% |
| CSCO | Cisco Systems | | Technology | 48.74 | 81 | -1.87% | -3.52% |
| PWR | Quanta Services | | Industrials | 268.49 | 80 | -0.85% | 24.42% |
| WFC | Wells Fargo | | Financials | 62.20 | 80 | -0.23% | 26.36% |
| DXCM | DexCom | | Health Care | 131.18 | 78 | 1.13% | 5.71% |
| PNR | Pentair | | Industrials | 84.33 | 78 | -0.88% | 15.99% |
| TSCO | Tractor Supply | | Services & Goods | 277.27 | 78 | 0.47% | 28.94% |
| NFLX | Netflix | | Technology | 615.63 | 78 | 0.34% | 26.44% |
| ECL | Ecolab | | Materials | 232.69 | 78 | -0.11% | 17.31% |
| PANW | Palo Alto | | Technology | 314.70 | 77 | 0.76% | 6.72% |
| BR | Broadridge Financial | | Technology | 202.70 | 77 | 0.29% | -1.48% |
| PTC | PTC | | Technology | 182.95 | 77 | -0.49% | 4.57% |
| BLK | BlackRock | | Financials | 812.16 | 77 | -0.43% | 0.04% |
| AOS | A. O. | | Industrials | 87.12 | 76 | 0.40% | 5.68% |
| EVRG | Evergy | | Utilities | 55.85 | 76 | 0.38% | 6.99% |
| NTRS | Northern Trust | | Financials | 86.70 | 76 | 0.29% | 2.75% |
| For chart view version of above stock list: Chart View ➞ 0 - 25 , 25 - 50 , 50 - 75 , 75 - 100 , 100 - 125 , 125 - 150 , 150 - 175 , 175 - 200 , 200 - 225 , 225 - 250 , 250 - 275 , 275 - 300 , 300 - 325 , 325 - 350 , 350 - 375 , 375 - 400 , 400 - 425 , 425 - 450 , 450 - 475 , 475 - 500 | ||
 | Click To Change The Sort Order: By Market Cap or Company Size Performance: Year-to-date, Week and Day |  |
|
Get the most comprehensive stock market coverage daily at 12Stocks.com ➞ Best Stocks Today ➞ Best Stocks Weekly ➞ Best Stocks Year-to-Date ➞ Best Stocks Trends ➞  Best Stocks Today 12Stocks.com Best Nasdaq Stocks ➞ Best S&P 500 Stocks ➞ Best Tech Stocks ➞ Best Biotech Stocks ➞ |
| Detailed Overview of S&P 500 Stocks |
| S&P 500 Technical Overview, Leaders & Laggards, Top S&P 500 ETF Funds & Detailed S&P 500 Stocks List, Charts, Trends & More |
| S&P 500: Technical Analysis, Trends & YTD Performance | |
| S&P 500 index as represented by
SPY, an exchange-traded fund [ETF], holds basket of five hundred (mostly largecap) stocks from across all major sectors of the US stock market. The S&P 500 index (contains stocks like Apple and Exxon) is up by 11.79% and is currently outperforming the overall market by 0.82% year-to-date. Below is a quick view of technical charts and trends: | |
 SPY Weekly Chart |
|
| Long Term Trend: Very Good | |
| Medium Term Trend: Very Good | |
 SPY Daily Chart |
|
| Short Term Trend: Very Good | |
| Overall Trend Score: 95 | |
| YTD Performance: 11.79% | |
| **Trend Scores & Views Are Only For Educational Purposes And Not For Investing | |
| 12Stocks.com: Investing in S&P 500 Index using Exchange Traded Funds | |
|
The following table shows list of key exchange traded funds (ETF) that
help investors track S&P 500 index. The following list also includes leveraged ETF funds that track twice or thrice the daily returns of S&P 500 indices. Short or inverse ETF funds move in the opposite direction to the index they track and are useful during market pullbacks or during bear markets. Quick View: Move mouse or cursor over ETF symbol (ticker) to view short-term technical chart and over ETF name to view long term chart. Click on ticker or stock name for detailed view. Click on to add stock symbol to your watchlist and to view watchlist. |
12Stocks.com List of ETFs that track S&P 500 Index
| Ticker | ETF Name | Watchlist | Recent Price | Smart Investing & Trading Score | Change % | Week % | Year-to-date % |
| SPY | SPDR S&P 500 ETF | | 531.35 | 95 | 0.30 | 2.02 | 11.79% |
| IVV | iShares Core S&P 500 ETF | | 533.95 | 100 | 0.69 | 2.02 | 11.79% |
| VOO | Vanguard 500 ETF | | 488.27 | 100 | 0.68 | 1.99 | 11.78% |
| OEF | iShares S&P 100 | | 253.26 | 95 | 0.26 | 2.19 | 13.37% |
| SSO | ProShares Ultra S&P500 | | 79.12 | 90 | 0.57 | 3.93 | 21.59% |
| UPRO | ProShares UltraPro S&P500 | | 72.25 | 95 | 0.86 | 5.9 | 32% |
| SPXL | Direxion Daily S&P500 Bull 3X ETF | | 137.14 | 100 | 1.92 | 5.86 | 31.88% |
| SH | ProShares Short S&P500 | | 11.80 | 0 | -0.25 | -1.83 | -9.16% |
| SDS | ProShares UltraShort S&P500 | | 24.42 | 10 | -0.41 | -3.67 | -18.38% |
| SPXU | ProShares UltraPro Short S&P500 | | 31.25 | 10 | -0.76 | -5.62 | -27.33% |
| SPXS | Direxion Daily S&P 500 Bear 3X ETF | | 8.46 | 10 | -1.97 | -5.69 | -26.75% |
| 12Stocks.com: Charts, Trends, Fundamental Data and Performances of S&P 500 Stocks | |
|
We now take in-depth look at all S&P 500 stocks including charts, multi-period performances and overall trends (as measured by Smart Investing & Trading Score). One can sort S&P 500 stocks (click link to choose) by Daily, Weekly and by Year-to-Date performances. Also, one can sort by size of the company or by market capitalization. |
| Select Your Default Chart Type: | |||||
| |||||
| Click on stock symbol or name for detailed view. Click on to add stock symbol to your watchlist and to view watchlist. Quick View: Move mouse or cursor over "Daily" to quickly view daily technical stock chart and over "Weekly" to view weekly technical stock chart. | |||||

 | CMS CMS Energy Corporation |
| Sector: Utilities | |
| SubSector: Electric Utilities | |
| MarketCap: 15105.8 Millions | |
| Recent Price: 63.27 Smart Investing & Trading Score: 83 | |
| Day Percent Change: 0.44% Day Change: 0.28 | |
| Week Change: 0.54% Year-to-date Change: 9.0% | |
| CMS Links: Profile News Message Board | |
| Charts:- Daily , Weekly | |
| Add CMS to Watchlist: View: Get CMS Trend Analysis ➞ | |
 | MTB M&T Bank Corporation |
| Sector: Financials | |
| SubSector: Regional - Northeast Banks | |
| MarketCap: 13950.9 Millions | |
| Recent Price: 154.91 Smart Investing & Trading Score: 83 | |
| Day Percent Change: 0.21% Day Change: 0.32 | |
| Week Change: 0.81% Year-to-date Change: 13.0% | |
| MTB Links: Profile News Message Board | |
| Charts:- Daily , Weekly | |
| Add MTB to Watchlist: View: Get MTB Trend Analysis ➞ | |
 | CL Colgate-Palmolive Company |
| Sector: Consumer Staples | |
| SubSector: Personal Products | |
| MarketCap: 57242.7 Millions | |
| Recent Price: 94.57 Smart Investing & Trading Score: 83 | |
| Day Percent Change: 0.04% Day Change: 0.04 | |
| Week Change: -0.56% Year-to-date Change: 18.6% | |
| CL Links: Profile News Message Board | |
| Charts:- Daily , Weekly | |
| Add CL to Watchlist: View: Get CL Trend Analysis ➞ | |
 | REGN Regeneron Pharmaceuticals, Inc. |
| Sector: Health Care | |
| SubSector: Biotechnology | |
| MarketCap: 51903.7 Millions | |
| Recent Price: 976.88 Smart Investing & Trading Score: 83 | |
| Day Percent Change: -0.14% Day Change: -1.33 | |
| Week Change: 0.32% Year-to-date Change: 11.2% | |
| REGN Links: Profile News Message Board | |
| Charts:- Daily , Weekly | |
| Add REGN to Watchlist: View: Get REGN Trend Analysis ➞ | |
 | AWK American Water Works Company, Inc. |
| Sector: Utilities | |
| SubSector: Water Utilities | |
| MarketCap: 20029.2 Millions | |
| Recent Price: 133.62 Smart Investing & Trading Score: 83 | |
| Day Percent Change: -0.10% Day Change: -0.13 | |
| Week Change: -1.39% Year-to-date Change: 1.2% | |
| AWK Links: Profile News Message Board | |
| Charts:- Daily , Weekly | |
| Add AWK to Watchlist: View: Get AWK Trend Analysis ➞ | |
 | HUM Humana Inc. |
| Sector: Health Care | |
| SubSector: Health Care Plans | |
| MarketCap: 34125.6 Millions | |
| Recent Price: 355.29 Smart Investing & Trading Score: 82 | |
| Day Percent Change: 2.34% Day Change: 8.14 | |
| Week Change: 5.87% Year-to-date Change: -22.4% | |
| HUM Links: Profile News Message Board | |
| Charts:- Daily , Weekly | |
| Add HUM to Watchlist: View: Get HUM Trend Analysis ➞ | |
 | CBRE CBRE Group, Inc. |
| Sector: Financials | |
| SubSector: Property Management | |
| MarketCap: 12799.2 Millions | |
| Recent Price: 93.33 Smart Investing & Trading Score: 82 | |
| Day Percent Change: 1.16% Day Change: 1.07 | |
| Week Change: 6.17% Year-to-date Change: 0.3% | |
| CBRE Links: Profile News Message Board | |
| Charts:- Daily , Weekly | |
| Add CBRE to Watchlist: View: Get CBRE Trend Analysis ➞ | |
 | ICE Intercontinental Exchange, Inc. |
| Sector: Financials | |
| SubSector: Diversified Investments | |
| MarketCap: 46054.6 Millions | |
| Recent Price: 138.28 Smart Investing & Trading Score: 82 | |
| Day Percent Change: 0.29% Day Change: 0.41 | |
| Week Change: 3.2% Year-to-date Change: 7.7% | |
| ICE Links: Profile News Message Board | |
| Charts:- Daily , Weekly | |
| Add ICE to Watchlist: View: Get ICE Trend Analysis ➞ | |
 | FSLR First Solar, Inc. |
| Sector: Technology | |
| SubSector: Semiconductor - Specialized | |
| MarketCap: 3617.9 Millions | |
| Recent Price: 192.04 Smart Investing & Trading Score: 81 | |
| Day Percent Change: 0.06% Day Change: 0.11 | |
| Week Change: 0.52% Year-to-date Change: 11.5% | |
| FSLR Links: Profile News Message Board | |
| Charts:- Daily , Weekly | |
| Add FSLR to Watchlist: View: Get FSLR Trend Analysis ➞ | |
 | HON Honeywell International Inc. |
| Sector: Industrials | |
| SubSector: Diversified Machinery | |
| MarketCap: 91189.1 Millions | |
| Recent Price: 206.63 Smart Investing & Trading Score: 81 | |
| Day Percent Change: 0.77% Day Change: 1.57 | |
| Week Change: 1.83% Year-to-date Change: -1.5% | |
| HON Links: Profile News Message Board | |
| Charts:- Daily , Weekly | |
| Add HON to Watchlist: View: Get HON Trend Analysis ➞ | |
 | CSCO Cisco Systems, Inc. |
| Sector: Technology | |
| SubSector: Communication Equipment | |
| MarketCap: 168483 Millions | |
| Recent Price: 48.74 Smart Investing & Trading Score: 81 | |
| Day Percent Change: -1.87% Day Change: -0.93 | |
| Week Change: 1.41% Year-to-date Change: -3.5% | |
| CSCO Links: Profile News Message Board | |
| Charts:- Daily , Weekly | |
| Add CSCO to Watchlist: View: Get CSCO Trend Analysis ➞ | |
 | PWR Quanta Services, Inc. |
| Sector: Industrials | |
| SubSector: General Contractors | |
| MarketCap: 3936.63 Millions | |
| Recent Price: 268.49 Smart Investing & Trading Score: 80 | |
| Day Percent Change: -0.85% Day Change: -2.30 | |
| Week Change: -1.1% Year-to-date Change: 24.4% | |
| PWR Links: Profile News Message Board | |
| Charts:- Daily , Weekly | |
| Add PWR to Watchlist: View: Get PWR Trend Analysis ➞ | |
 | WFC Wells Fargo & Company |
| Sector: Financials | |
| SubSector: Money Center Banks | |
| MarketCap: 129138 Millions | |
| Recent Price: 62.20 Smart Investing & Trading Score: 80 | |
| Day Percent Change: -0.23% Day Change: -0.15 | |
| Week Change: 0.49% Year-to-date Change: 26.4% | |
| WFC Links: Profile News Message Board | |
| Charts:- Daily , Weekly | |
| Add WFC to Watchlist: View: Get WFC Trend Analysis ➞ | |
 | DXCM DexCom, Inc. |
| Sector: Health Care | |
| SubSector: Medical Laboratories & Research | |
| MarketCap: 19559 Millions | |
| Recent Price: 131.18 Smart Investing & Trading Score: 78 | |
| Day Percent Change: 1.13% Day Change: 1.47 | |
| Week Change: 3.25% Year-to-date Change: 5.7% | |
| DXCM Links: Profile News Message Board | |
| Charts:- Daily , Weekly | |
| Add DXCM to Watchlist: View: Get DXCM Trend Analysis ➞ | |
 | PNR Pentair plc |
| Sector: Industrials | |
| SubSector: Industrial Equipment & Components | |
| MarketCap: 4326.59 Millions | |
| Recent Price: 84.33 Smart Investing & Trading Score: 78 | |
| Day Percent Change: -0.88% Day Change: -0.75 | |
| Week Change: 1.22% Year-to-date Change: 16.0% | |
| PNR Links: Profile News Message Board | |
| Charts:- Daily , Weekly | |
| Add PNR to Watchlist: View: Get PNR Trend Analysis ➞ | |
 | TSCO Tractor Supply Company |
| Sector: Services & Goods | |
| SubSector: Specialty Retail, Other | |
| MarketCap: 9692.94 Millions | |
| Recent Price: 277.27 Smart Investing & Trading Score: 78 | |
| Day Percent Change: 0.47% Day Change: 1.31 | |
| Week Change: 2.15% Year-to-date Change: 28.9% | |
| TSCO Links: Profile News Message Board | |
| Charts:- Daily , Weekly | |
| Add TSCO to Watchlist: View: Get TSCO Trend Analysis ➞ | |
 | NFLX Netflix, Inc. |
| Sector: Technology | |
| SubSector: CATV Systems | |
| MarketCap: 162108 Millions | |
| Recent Price: 615.63 Smart Investing & Trading Score: 78 | |
| Day Percent Change: 0.34% Day Change: 2.11 | |
| Week Change: 0.78% Year-to-date Change: 26.4% | |
| NFLX Links: Profile News Message Board | |
| Charts:- Daily , Weekly | |
| Add NFLX to Watchlist: View: Get NFLX Trend Analysis ➞ | |
 | ECL Ecolab Inc. |
| Sector: Materials | |
| SubSector: Specialty Chemicals | |
| MarketCap: 46215.9 Millions | |
| Recent Price: 232.69 Smart Investing & Trading Score: 78 | |
| Day Percent Change: -0.11% Day Change: -0.26 | |
| Week Change: -0.36% Year-to-date Change: 17.3% | |
| ECL Links: Profile News Message Board | |
| Charts:- Daily , Weekly | |
| Add ECL to Watchlist: View: Get ECL Trend Analysis ➞ | |
 | PANW Palo Alto Networks, Inc. |
| Sector: Technology | |
| SubSector: Networking & Communication Devices | |
| MarketCap: 16039.4 Millions | |
| Recent Price: 314.70 Smart Investing & Trading Score: 77 | |
| Day Percent Change: 0.76% Day Change: 2.38 | |
| Week Change: 5.79% Year-to-date Change: 6.7% | |
| PANW Links: Profile News Message Board | |
| Charts:- Daily , Weekly | |
| Add PANW to Watchlist: View: Get PANW Trend Analysis ➞ | |
 | BR Broadridge Financial Solutions, Inc. |
| Sector: Technology | |
| SubSector: Information Technology Services | |
| MarketCap: 10633.8 Millions | |
| Recent Price: 202.70 Smart Investing & Trading Score: 77 | |
| Day Percent Change: 0.29% Day Change: 0.58 | |
| Week Change: 3.58% Year-to-date Change: -1.5% | |
| BR Links: Profile News Message Board | |
| Charts:- Daily , Weekly | |
| Add BR to Watchlist: View: Get BR Trend Analysis ➞ | |
 | PTC PTC Inc. |
| Sector: Technology | |
| SubSector: Technical & System Software | |
| MarketCap: 6166.7 Millions | |
| Recent Price: 182.95 Smart Investing & Trading Score: 77 | |
| Day Percent Change: -0.49% Day Change: -0.90 | |
| Week Change: 1.64% Year-to-date Change: 4.6% | |
| PTC Links: Profile News Message Board | |
| Charts:- Daily , Weekly | |
| Add PTC to Watchlist: View: Get PTC Trend Analysis ➞ | |
 | BLK BlackRock, Inc. |
| Sector: Financials | |
| SubSector: Asset Management | |
| MarketCap: 61284.9 Millions | |
| Recent Price: 812.16 Smart Investing & Trading Score: 77 | |
| Day Percent Change: -0.43% Day Change: -3.54 | |
| Week Change: 1.94% Year-to-date Change: 0.0% | |
| BLK Links: Profile News Message Board | |
| Charts:- Daily , Weekly | |
| Add BLK to Watchlist: View: Get BLK Trend Analysis ➞ | |
 | AOS A. O. Smith Corporation |
| Sector: Industrials | |
| SubSector: Industrial Electrical Equipment | |
| MarketCap: 5809.89 Millions | |
| Recent Price: 87.12 Smart Investing & Trading Score: 76 | |
| Day Percent Change: 0.40% Day Change: 0.35 | |
| Week Change: 0.86% Year-to-date Change: 5.7% | |
| AOS Links: Profile News Message Board | |
| Charts:- Daily , Weekly | |
| Add AOS to Watchlist: View: Get AOS Trend Analysis ➞ | |
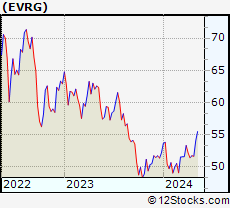 | EVRG Evergy, Inc. |
| Sector: Utilities | |
| SubSector: Electric Utilities | |
| MarketCap: 11914.8 Millions | |
| Recent Price: 55.85 Smart Investing & Trading Score: 76 | |
| Day Percent Change: 0.38% Day Change: 0.21 | |
| Week Change: 0.58% Year-to-date Change: 7.0% | |
| EVRG Links: Profile News Message Board | |
| Charts:- Daily , Weekly | |
| Add EVRG to Watchlist: View: Get EVRG Trend Analysis ➞ | |
 | NTRS Northern Trust Corporation |
| Sector: Financials | |
| SubSector: Asset Management | |
| MarketCap: 15316.8 Millions | |
| Recent Price: 86.70 Smart Investing & Trading Score: 76 | |
| Day Percent Change: 0.29% Day Change: 0.25 | |
| Week Change: 0% Year-to-date Change: 2.8% | |
| NTRS Links: Profile News Message Board | |
| Charts:- Daily , Weekly | |
| Add NTRS to Watchlist: View: Get NTRS Trend Analysis ➞ | |
| For tabular summary view of above stock list: Summary View ➞ 0 - 25 , 25 - 50 , 50 - 75 , 75 - 100 , 100 - 125 , 125 - 150 , 150 - 175 , 175 - 200 , 200 - 225 , 225 - 250 , 250 - 275 , 275 - 300 , 300 - 325 , 325 - 350 , 350 - 375 , 375 - 400 , 400 - 425 , 425 - 450 , 450 - 475 , 475 - 500 | ||
| Click To Change The Sort Order: By Market Cap or Company Size Performance: Year-to-date, Week and Day | |
| Select Chart Type: | ||
|
Best Stocks Today 12Stocks.com |
© 2024 12Stocks.com Terms & Conditions Privacy Contact Us
All Information Provided Only For Education And Not To Be Used For Investing or Trading. See Terms & Conditions


One More Thing ... Get Best Stocks Delivered Daily!
Never Ever Miss A Move With Our Top Ten Stocks Lists
Find Best Stocks In Any Market - Bull or Bear Market
Take A Peek At Our Top Ten Stocks Lists: Daily, Weekly, Year-to-Date & Top Trends
Find Best Stocks In Any Market - Bull or Bear Market
Take A Peek At Our Top Ten Stocks Lists: Daily, Weekly, Year-to-Date & Top Trends
S&P 500 Stocks With Best Up Trends [0-bearish to 100-bullish]: Walmart [100], 3M [100], Chubb [100], EQT [100], Nasdaq [100], Hartford Financial[100], Micron [100], PG&E [100], Google [100], Google [100], Williams [100]
Best S&P 500 Stocks Year-to-Date:
NVIDIA [92.88%], Constellation [89.29%], NRG [64.84%], Micron [52.16%], Western Digital[44.38%], Eaton [39.27%], Chipotle Mexican[38.77%], Arista Networks[38.32%], Leidos Holdings[37.25%], QUALCOMM [34.92%], Targa Resources[34.44%] Best S&P 500 Stocks This Week:
Advanced Micro[9.74%], Insulet [9.52%], Moderna [9.43%], Teradyne [7.77%], Broadcom [7.67%], EQT [7.31%], Bio-Rad [7.17%], QUALCOMM [7.17%], Incyte [7.12%], Micron [7.1%], Tapestry [7.02%] Best S&P 500 Stocks Daily:
Walmart [5.92%], Advanced Micro[4.42%], 3M [3.71%], Chubb [3.53%], Boeing [3.25%], Archer-Daniels-Midland [3.03%], Dollar General[2.93%], Target [2.72%], Bunge [2.63%], MSCI [2.43%], Yum! Brands[2.37%]