
 Login Sign Up


| |||||
 |  | ||||

| 12Stocks.com Market Intelligence |
Best S&P 500 Stocks
|
On this page, you will find the most comprehensive analysis of S&P 500 stocks and ETFs - from latest trends to performances to charts ➞. First, here are the year-to-date (YTD) performances of the most requested S&P 500 stocks at 12Stocks.com (click stock for review):
| NVIDIA 91% | ||
| Google 25% | ||
| Walmart 22% | ||
| Amazon.com 22% | ||
| Goldman Sachs 21% | ||
| Merck 20% | ||
| JPMorgan Chase 19% | ||
| Caterpillar 19% | ||
| Microsoft 12% | ||
| Chevron 8% | ||
| Apple -1% | ||
| Johnson & Johnson -2% | ||
| McDonald s -7% | ||
| Gilead -16% | ||
| Starbucks -22% | ||
| Boeing -30% | ||
| Intel -36% | ||
| Quick: S&P 500 Stocks Lists: Performances & Trends, S&P 500 Stock Charts
Sort S&P 500 stocks: Daily, Weekly, Year-to-Date, Market Cap & Trends. Filter S&P 500 stocks list by sector: Show all, Tech, Finance, Energy, Staples, Retail, Industrial, Materials, Utilities and HealthCare |
| 12Stocks.com S&P 500 Stocks Performances & Trends Daily Report | |||||||||
|
| 
The overall Smart Investing & Trading Score is 95 (0-bearish to 100-bullish) which puts S&P 500 index in short term bullish trend. The Smart Investing & Trading Score from previous trading session is 100 and hence a deterioration of trend. | ||||||||
Here are the Smart Investing & Trading Scores of the most requested S&P 500 stocks at 12Stocks.com (click stock name for detailed review):
|


| 12Stocks.com: Top Performing S&P 500 Index Stocks | ||||||||||||||||||||||||||||||||||||||||||||||||
 The top performing S&P 500 Index stocks year to date are
Now, more recently, over last week, the top performing S&P 500 Index stocks on the move are


|
||||||||||||||||||||||||||||||||||||||||||||||||
| 12Stocks.com: Investing in S&P 500 Index with Stocks | |
|
The following table helps investors and traders sort through current performance and trends (as measured by Smart Investing & Trading Score) of various
stocks in the S&P 500 Index. Quick View: Move mouse or cursor over stock symbol (ticker) to view short-term technical chart and over stock name to view long term chart. Click on  to add stock symbol to your watchlist and to add stock symbol to your watchlist and  to view watchlist. Click on any ticker or stock name for detailed market intelligence report for that stock. to view watchlist. Click on any ticker or stock name for detailed market intelligence report for that stock. |
12Stocks.com Performance of Stocks in S&P 500 Index
| Ticker | Stock Name | Watchlist | Category | Recent Price | Smart Investing & Trading Score | Change % | YTD Change% |
| K | Kellogg |   | Consumer Staples | 62.01 | 68 | 0.29% | 10.91% |
| NDSN | Nordson | | Industrials | 271.40 | 68 | -1.15% | 2.74% |
| CHRW | C.H. Robinson | | Transports | 83.08 | 68 | -0.33% | -3.84% |
| DPZ | Domino s | | Services & Goods | 516.04 | 68 | -0.32% | 25.18% |
| APA | Apache | | Energy | 30.45 | 68 | -0.31% | -15.15% |
| STLD | Steel Dynamics | | Materials | 135.49 | 68 | -1.05% | 14.72% |
| DVA | DaVita | | Health Care | 137.03 | 68 | -0.62% | 30.80% |
| CTAS | Cintas | | Services & Goods | 692.21 | 68 | -0.03% | 14.86% |
| JKHY | Jack Henry | | Technology | 168.99 | 67 | 0.69% | 3.41% |
| AIG | American | | Financials | 79.04 | 66 | 0.18% | 16.66% |
| WFC | Wells Fargo | | Financials | 61.08 | 66 | -2.03% | 24.09% |
| PWR | Quanta Services | | Industrials | 265.59 | 66 | -1.92% | 23.07% |
| RJF | Raymond James | | Financials | 125.86 | 66 | -1.13% | 12.88% |
| SNA | Snap-on | | Industrials | 277.92 | 66 | -0.68% | -3.78% |
| SPG | Simon Property | | Financials | 149.04 | 65 | -0.81% | 4.49% |
| BA | Boeing | | Industrials | 182.44 | 64 | 3.08% | -30.01% |
| AMD | Advanced Micro | | Technology | 164.25 | 64 | 2.87% | 11.42% |
| INTC | Intel | | Technology | 32.13 | 64 | 2.75% | -36.06% |
| CTSH | Cognizant | | Technology | 70.33 | 64 | 2.13% | -6.88% |
| MSCI | MSCI | | Technology | 498.86 | 64 | 1.79% | -11.81% |
| AON | Aon | | Financials | 292.38 | 64 | 1.59% | 0.47% |
| ROST | Ross Stores | | Services & Goods | 135.02 | 64 | 1.52% | -2.44% |
| PLD | Prologis | | Financials | 111.59 | 64 | 1.45% | -16.29% |
| ROP | Roper Technologies | | Industrials | 537.19 | 64 | 1.08% | -1.46% |
| MGM | MGM Resorts | | Services & Goods | 41.74 | 64 | 0.46% | -6.58% |
| For chart view version of above stock list: Chart View ➞ 0 - 25 , 25 - 50 , 50 - 75 , 75 - 100 , 100 - 125 , 125 - 150 , 150 - 175 , 175 - 200 , 200 - 225 , 225 - 250 , 250 - 275 , 275 - 300 , 300 - 325 , 325 - 350 , 350 - 375 , 375 - 400 , 400 - 425 , 425 - 450 , 450 - 475 , 475 - 500 | ||
 | Click To Change The Sort Order: By Market Cap or Company Size Performance: Year-to-date, Week and Day |  |
|
Get the most comprehensive stock market coverage daily at 12Stocks.com ➞ Best Stocks Today ➞ Best Stocks Weekly ➞ Best Stocks Year-to-Date ➞ Best Stocks Trends ➞  Best Stocks Today 12Stocks.com Best Nasdaq Stocks ➞ Best S&P 500 Stocks ➞ Best Tech Stocks ➞ Best Biotech Stocks ➞ |
| Detailed Overview of S&P 500 Stocks |
| S&P 500 Technical Overview, Leaders & Laggards, Top S&P 500 ETF Funds & Detailed S&P 500 Stocks List, Charts, Trends & More |
| S&P 500: Technical Analysis, Trends & YTD Performance | |
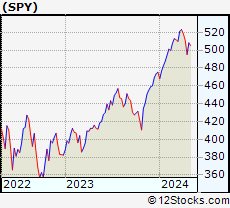
| S&P 500 index as represented by
SPY, an exchange-traded fund [ETF], holds basket of five hundred (mostly largecap) stocks from across all major sectors of the US stock market. The S&P 500 index (contains stocks like Apple and Exxon) is up by 11.51% and is currently outperforming the overall market by 0.87% year-to-date. Below is a quick view of technical charts and trends: | |
 SPY Weekly Chart |
|
| Long Term Trend: Very Good | |
| Medium Term Trend: Very Good | |
 SPY Daily Chart |
|
| Short Term Trend: Very Good | |
| Overall Trend Score: 95 | |
| YTD Performance: 11.51% | |
| **Trend Scores & Views Are Only For Educational Purposes And Not For Investing | |
| 12Stocks.com: Investing in S&P 500 Index using Exchange Traded Funds | |
|
The following table shows list of key exchange traded funds (ETF) that
help investors track S&P 500 index. The following list also includes leveraged ETF funds that track twice or thrice the daily returns of S&P 500 indices. Short or inverse ETF funds move in the opposite direction to the index they track and are useful during market pullbacks or during bear markets. Quick View: Move mouse or cursor over ETF symbol (ticker) to view short-term technical chart and over ETF name to view long term chart. Click on ticker or stock name for detailed view. Click on to add stock symbol to your watchlist and to view watchlist. |
12Stocks.com List of ETFs that track S&P 500 Index
| Ticker | ETF Name | Watchlist | Recent Price | Smart Investing & Trading Score | Change % | Week % | Year-to-date % |
| SPY | SPDR S&P 500 ETF | | 530.02 | 95 | 0.05 | 1.76 | 11.51% |
| IVV | iShares Core S&P 500 ETF | | 533.95 | 100 | 0.69 | 2.02 | 11.79% |
| VOO | Vanguard 500 ETF | | 488.27 | 100 | 0.68 | 1.99 | 11.78% |
| OEF | iShares S&P 100 | | 252.68 | 95 | 0.03 | 1.95 | 13.11% |
| SSO | ProShares Ultra S&P500 | | 78.72 | 90 | 0.06 | 3.4 | 20.98% |
| UPRO | ProShares UltraPro S&P500 | | 71.69 | 95 | 0.07 | 5.07 | 30.96% |
| SPXL | Direxion Daily S&P500 Bull 3X ETF | | 137.14 | 100 | 1.92 | 5.86 | 31.88% |
| SH | ProShares Short S&P500 | | 11.84 | 10 | 0.04 | -1.54 | -8.89% |
| SDS | ProShares UltraShort S&P500 | | 24.56 | 10 | 0.16 | -3.12 | -17.91% |
| SPXU | ProShares UltraPro Short S&P500 | | 31.51 | 10 | 0.06 | -4.83 | -26.72% |
| SPXS | Direxion Daily S&P 500 Bear 3X ETF | | 8.46 | 0 | -1.97 | -5.69 | -26.75% |
| 12Stocks.com: Charts, Trends, Fundamental Data and Performances of S&P 500 Stocks | |
|
We now take in-depth look at all S&P 500 stocks including charts, multi-period performances and overall trends (as measured by Smart Investing & Trading Score). One can sort S&P 500 stocks (click link to choose) by Daily, Weekly and by Year-to-Date performances. Also, one can sort by size of the company or by market capitalization. |
| Select Your Default Chart Type: | |||||
| |||||
| Click on stock symbol or name for detailed view. Click on to add stock symbol to your watchlist and to view watchlist. Quick View: Move mouse or cursor over "Daily" to quickly view daily technical stock chart and over "Weekly" to view weekly technical stock chart. | |||||

 | K Kellogg Company |
| Sector: Consumer Staples | |
| SubSector: Processed & Packaged Goods | |
| MarketCap: 20264.6 Millions | |
| Recent Price: 62.01 Smart Investing & Trading Score: 68 | |
| Day Percent Change: 0.29% Day Change: 0.18 | |
| Week Change: 0.24% Year-to-date Change: 10.9% | |
| K Links: Profile News Message Board | |
| Charts:- Daily , Weekly | |
| Add K to Watchlist: View: Get K Trend Analysis ➞ | |
 | NDSN Nordson Corporation |
| Sector: Industrials | |
| SubSector: Diversified Machinery | |
| MarketCap: 7117.56 Millions | |
| Recent Price: 271.40 Smart Investing & Trading Score: 68 | |
| Day Percent Change: -1.15% Day Change: -3.16 | |
| Week Change: -2.68% Year-to-date Change: 2.7% | |
| NDSN Links: Profile News Message Board | |
| Charts:- Daily , Weekly | |
| Add NDSN to Watchlist: View: Get NDSN Trend Analysis ➞ | |
 | CHRW C.H. Robinson Worldwide, Inc. |
| Sector: Transports | |
| SubSector: Air Delivery & Freight Services | |
| MarketCap: 9194.78 Millions | |
| Recent Price: 83.08 Smart Investing & Trading Score: 68 | |
| Day Percent Change: -0.33% Day Change: -0.27 | |
| Week Change: 0.43% Year-to-date Change: -3.8% | |
| CHRW Links: Profile News Message Board | |
| Charts:- Daily , Weekly | |
| Add CHRW to Watchlist: View: Get CHRW Trend Analysis ➞ | |
 | DPZ Domino s Pizza, Inc. |
| Sector: Services & Goods | |
| SubSector: Restaurants | |
| MarketCap: 12166 Millions | |
| Recent Price: 516.04 Smart Investing & Trading Score: 68 | |
| Day Percent Change: -0.32% Day Change: -1.64 | |
| Week Change: -0.5% Year-to-date Change: 25.2% | |
| DPZ Links: Profile News Message Board | |
| Charts:- Daily , Weekly | |
| Add DPZ to Watchlist: View: Get DPZ Trend Analysis ➞ | |
 | APA Apache Corporation |
| Sector: Energy | |
| SubSector: Independent Oil & Gas | |
| MarketCap: 1937.53 Millions | |
| Recent Price: 30.45 Smart Investing & Trading Score: 68 | |
| Day Percent Change: -0.31% Day Change: -0.09 | |
| Week Change: 0.21% Year-to-date Change: -15.2% | |
| APA Links: Profile News Message Board | |
| Charts:- Daily , Weekly | |
| Add APA to Watchlist: View: Get APA Trend Analysis ➞ | |
 | STLD Steel Dynamics, Inc. |
| Sector: Materials | |
| SubSector: Steel & Iron | |
| MarketCap: 4533.58 Millions | |
| Recent Price: 135.49 Smart Investing & Trading Score: 68 | |
| Day Percent Change: -1.05% Day Change: -1.44 | |
| Week Change: 0.23% Year-to-date Change: 14.7% | |
| STLD Links: Profile News Message Board | |
| Charts:- Daily , Weekly | |
| Add STLD to Watchlist: View: Get STLD Trend Analysis ➞ | |
 | DVA DaVita Inc. |
| Sector: Health Care | |
| SubSector: Specialized Health Services | |
| MarketCap: 8954.36 Millions | |
| Recent Price: 137.03 Smart Investing & Trading Score: 68 | |
| Day Percent Change: -0.62% Day Change: -0.85 | |
| Week Change: -0.36% Year-to-date Change: 30.8% | |
| DVA Links: Profile News Message Board | |
| Charts:- Daily , Weekly | |
| Add DVA to Watchlist: View: Get DVA Trend Analysis ➞ | |
 | CTAS Cintas Corporation |
| Sector: Services & Goods | |
| SubSector: Business Services | |
| MarketCap: 20154.6 Millions | |
| Recent Price: 692.21 Smart Investing & Trading Score: 68 | |
| Day Percent Change: -0.03% Day Change: -0.19 | |
| Week Change: -1.15% Year-to-date Change: 14.9% | |
| CTAS Links: Profile News Message Board | |
| Charts:- Daily , Weekly | |
| Add CTAS to Watchlist: View: Get CTAS Trend Analysis ➞ | |
 | JKHY Jack Henry & Associates, Inc. |
| Sector: Technology | |
| SubSector: Information Technology Services | |
| MarketCap: 10695.4 Millions | |
| Recent Price: 168.99 Smart Investing & Trading Score: 67 | |
| Day Percent Change: 0.69% Day Change: 1.16 | |
| Week Change: -0.15% Year-to-date Change: 3.4% | |
| JKHY Links: Profile News Message Board | |
| Charts:- Daily , Weekly | |
| Add JKHY to Watchlist: View: Get JKHY Trend Analysis ➞ | |
 | AIG American International Group, Inc. |
| Sector: Financials | |
| SubSector: Property & Casualty Insurance | |
| MarketCap: 21219 Millions | |
| Recent Price: 79.04 Smart Investing & Trading Score: 66 | |
| Day Percent Change: 0.18% Day Change: 0.14 | |
| Week Change: -1.34% Year-to-date Change: 16.7% | |
| AIG Links: Profile News Message Board | |
| Charts:- Daily , Weekly | |
| Add AIG to Watchlist: View: Get AIG Trend Analysis ➞ | |
 | WFC Wells Fargo & Company |
| Sector: Financials | |
| SubSector: Money Center Banks | |
| MarketCap: 129138 Millions | |
| Recent Price: 61.08 Smart Investing & Trading Score: 66 | |
| Day Percent Change: -2.03% Day Change: -1.27 | |
| Week Change: -1.32% Year-to-date Change: 24.1% | |
| WFC Links: Profile News Message Board | |
| Charts:- Daily , Weekly | |
| Add WFC to Watchlist: View: Get WFC Trend Analysis ➞ | |
 | PWR Quanta Services, Inc. |
| Sector: Industrials | |
| SubSector: General Contractors | |
| MarketCap: 3936.63 Millions | |
| Recent Price: 265.59 Smart Investing & Trading Score: 66 | |
| Day Percent Change: -1.92% Day Change: -5.20 | |
| Week Change: -2.17% Year-to-date Change: 23.1% | |
| PWR Links: Profile News Message Board | |
| Charts:- Daily , Weekly | |
| Add PWR to Watchlist: View: Get PWR Trend Analysis ➞ | |
 | RJF Raymond James Financial, Inc. |
| Sector: Financials | |
| SubSector: Investment Brokerage - Regional | |
| MarketCap: 9490.65 Millions | |
| Recent Price: 125.86 Smart Investing & Trading Score: 66 | |
| Day Percent Change: -1.13% Day Change: -1.44 | |
| Week Change: 0.13% Year-to-date Change: 12.9% | |
| RJF Links: Profile News Message Board | |
| Charts:- Daily , Weekly | |
| Add RJF to Watchlist: View: Get RJF Trend Analysis ➞ | |
 | SNA Snap-on Incorporated |
| Sector: Industrials | |
| SubSector: Small Tools & Accessories | |
| MarketCap: 5947.26 Millions | |
| Recent Price: 277.92 Smart Investing & Trading Score: 66 | |
| Day Percent Change: -0.68% Day Change: -1.90 | |
| Week Change: -1.07% Year-to-date Change: -3.8% | |
| SNA Links: Profile News Message Board | |
| Charts:- Daily , Weekly | |
| Add SNA to Watchlist: View: Get SNA Trend Analysis ➞ | |
 | SPG Simon Property Group, Inc. |
| Sector: Financials | |
| SubSector: REIT - Retail | |
| MarketCap: 17959.6 Millions | |
| Recent Price: 149.04 Smart Investing & Trading Score: 65 | |
| Day Percent Change: -0.81% Day Change: -1.21 | |
| Week Change: 0.89% Year-to-date Change: 4.5% | |
| SPG Links: Profile News Message Board | |
| Charts:- Daily , Weekly | |
| Add SPG to Watchlist: View: Get SPG Trend Analysis ➞ | |
 | BA The Boeing Company |
| Sector: Industrials | |
| SubSector: Aerospace/Defense Products & Services | |
| MarketCap: 65336.4 Millions | |
| Recent Price: 182.44 Smart Investing & Trading Score: 64 | |
| Day Percent Change: 3.08% Day Change: 5.45 | |
| Week Change: 2.2% Year-to-date Change: -30.0% | |
| BA Links: Profile News Message Board | |
| Charts:- Daily , Weekly | |
| Add BA to Watchlist: View: Get BA Trend Analysis ➞ | |
 | AMD Advanced Micro Devices, Inc. |
| Sector: Technology | |
| SubSector: Semiconductor - Broad Line | |
| MarketCap: 54275.1 Millions | |
| Recent Price: 164.25 Smart Investing & Trading Score: 64 | |
| Day Percent Change: 2.87% Day Change: 4.58 | |
| Week Change: 8.11% Year-to-date Change: 11.4% | |
| AMD Links: Profile News Message Board | |
| Charts:- Daily , Weekly | |
| Add AMD to Watchlist: View: Get AMD Trend Analysis ➞ | |
 | INTC Intel Corporation |
| Sector: Technology | |
| SubSector: Semiconductor - Broad Line | |
| MarketCap: 222357 Millions | |
| Recent Price: 32.13 Smart Investing & Trading Score: 64 | |
| Day Percent Change: 2.75% Day Change: 0.86 | |
| Week Change: 7.64% Year-to-date Change: -36.1% | |
| INTC Links: Profile News Message Board | |
| Charts:- Daily , Weekly | |
| Add INTC to Watchlist: View: Get INTC Trend Analysis ➞ | |
 | CTSH Cognizant Technology Solutions Corporation |
| Sector: Technology | |
| SubSector: Information Technology Services | |
| MarketCap: 26249.7 Millions | |
| Recent Price: 70.33 Smart Investing & Trading Score: 64 | |
| Day Percent Change: 2.13% Day Change: 1.47 | |
| Week Change: 5% Year-to-date Change: -6.9% | |
| CTSH Links: Profile News Message Board | |
| Charts:- Daily , Weekly | |
| Add CTSH to Watchlist: View: Get CTSH Trend Analysis ➞ | |
 | MSCI MSCI Inc. |
| Sector: Technology | |
| SubSector: Processing Systems & Products | |
| MarketCap: 21086.3 Millions | |
| Recent Price: 498.86 Smart Investing & Trading Score: 64 | |
| Day Percent Change: 1.79% Day Change: 8.80 | |
| Week Change: 2.82% Year-to-date Change: -11.8% | |
| MSCI Links: Profile News Message Board | |
| Charts:- Daily , Weekly | |
| Add MSCI to Watchlist: View: Get MSCI Trend Analysis ➞ | |
 | AON Aon plc |
| Sector: Financials | |
| SubSector: Insurance Brokers | |
| MarketCap: 36870.1 Millions | |
| Recent Price: 292.38 Smart Investing & Trading Score: 64 | |
| Day Percent Change: 1.59% Day Change: 4.59 | |
| Week Change: -0.25% Year-to-date Change: 0.5% | |
| AON Links: Profile News Message Board | |
| Charts:- Daily , Weekly | |
| Add AON to Watchlist: View: Get AON Trend Analysis ➞ | |
 | ROST Ross Stores, Inc. |
| Sector: Services & Goods | |
| SubSector: Apparel Stores | |
| MarketCap: 24938.8 Millions | |
| Recent Price: 135.02 Smart Investing & Trading Score: 64 | |
| Day Percent Change: 1.52% Day Change: 2.02 | |
| Week Change: 1.15% Year-to-date Change: -2.4% | |
| ROST Links: Profile News Message Board | |
| Charts:- Daily , Weekly | |
| Add ROST to Watchlist: View: Get ROST Trend Analysis ➞ | |
 | PLD Prologis, Inc. |
| Sector: Financials | |
| SubSector: REIT - Industrial | |
| MarketCap: 48728.9 Millions | |
| Recent Price: 111.59 Smart Investing & Trading Score: 64 | |
| Day Percent Change: 1.45% Day Change: 1.60 | |
| Week Change: 3.81% Year-to-date Change: -16.3% | |
| PLD Links: Profile News Message Board | |
| Charts:- Daily , Weekly | |
| Add PLD to Watchlist: View: Get PLD Trend Analysis ➞ | |
 | ROP Roper Technologies, Inc. |
| Sector: Industrials | |
| SubSector: Diversified Machinery | |
| MarketCap: 33366.2 Millions | |
| Recent Price: 537.19 Smart Investing & Trading Score: 64 | |
| Day Percent Change: 1.08% Day Change: 5.75 | |
| Week Change: 2.62% Year-to-date Change: -1.5% | |
| ROP Links: Profile News Message Board | |
| Charts:- Daily , Weekly | |
| Add ROP to Watchlist: View: Get ROP Trend Analysis ➞ | |
 | MGM MGM Resorts International |
| Sector: Services & Goods | |
| SubSector: Resorts & Casinos | |
| MarketCap: 5315.04 Millions | |
| Recent Price: 41.74 Smart Investing & Trading Score: 64 | |
| Day Percent Change: 0.46% Day Change: 0.19 | |
| Week Change: 2.88% Year-to-date Change: -6.6% | |
| MGM Links: Profile News Message Board | |
| Charts:- Daily , Weekly | |
| Add MGM to Watchlist: View: Get MGM Trend Analysis ➞ | |
| For tabular summary view of above stock list: Summary View ➞ 0 - 25 , 25 - 50 , 50 - 75 , 75 - 100 , 100 - 125 , 125 - 150 , 150 - 175 , 175 - 200 , 200 - 225 , 225 - 250 , 250 - 275 , 275 - 300 , 300 - 325 , 325 - 350 , 350 - 375 , 375 - 400 , 400 - 425 , 425 - 450 , 450 - 475 , 475 - 500 | ||
| Click To Change The Sort Order: By Market Cap or Company Size Performance: Year-to-date, Week and Day | |
| Select Chart Type: | ||
|
Best Stocks Today 12Stocks.com |
© 2024 12Stocks.com Terms & Conditions Privacy Contact Us
All Information Provided Only For Education And Not To Be Used For Investing or Trading. See Terms & Conditions


One More Thing ... Get Best Stocks Delivered Daily!
Never Ever Miss A Move With Our Top Ten Stocks Lists
Find Best Stocks In Any Market - Bull or Bear Market
Take A Peek At Our Top Ten Stocks Lists: Daily, Weekly, Year-to-Date & Top Trends
Find Best Stocks In Any Market - Bull or Bear Market
Take A Peek At Our Top Ten Stocks Lists: Daily, Weekly, Year-to-Date & Top Trends
S&P 500 Stocks With Best Up Trends [0-bearish to 100-bullish]: Walmart [100], Chubb [100], 3M [100], Campbell Soup[100], Air Products[100], Nasdaq [100], Humana [100], Hartford Financial[100], Arthur J.[100], Marsh & McLennan[100], Quest Diagnostics[100]
Best S&P 500 Stocks Year-to-Date:
NVIDIA [91.33%], Constellation [89.29%], NRG [62.61%], Micron [49.98%], Western Digital[42.01%], Chipotle Mexican[38.07%], Eaton [37.98%], Arista Networks[37.09%], Leidos Holdings[36.57%], Meta Platforms[34.5%], Targa Resources[34.43%] Best S&P 500 Stocks This Week:
Insulet [11.72%], Moderna [11%], Advanced Micro[8.11%], Teradyne [7.7%], Intel [7.64%], Teleflex [7.17%], Tapestry [7.15%], Incyte [7.03%], Broadcom [6.75%], QUALCOMM [6.62%], AES [6.34%] Best S&P 500 Stocks Daily:
Walmart [7.04%], Chubb [4.61%], 3M [3.70%], Dollar General[3.53%], Boeing [3.08%], Bunge [3.06%], Fair Isaac[3.01%], Archer-Daniels-Midland [2.93%], Target [2.91%], Advanced Micro[2.87%], CF Industries[2.82%]