
 Login Sign Up


| |||||
 |  | ||||

| 12Stocks.com Market Intelligence |
Best S&P 500 Stocks
|
On this page, you will find the most comprehensive analysis of S&P 500 stocks and ETFs - from latest trends to performances to charts ➞. First, here are the year-to-date (YTD) performances of the most requested S&P 500 stocks at 12Stocks.com (click stock for review):
| NVIDIA 91% | ||
| Google 23% | ||
| Amazon.com 22% | ||
| Caterpillar 22% | ||
| Merck 21% | ||
| Goldman Sachs 21% | ||
| JPMorgan Chase 19% | ||
| Walmart 14% | ||
| Microsoft 13% | ||
| Chevron 9% | ||
| Apple -1% | ||
| Johnson & Johnson -3% | ||
| McDonald s -8% | ||
| Gilead -17% | ||
| Starbucks -21% | ||
| Boeing -32% | ||
| Intel -38% | ||
| Quick: S&P 500 Stocks Lists: Performances & Trends, S&P 500 Stock Charts
Sort S&P 500 stocks: Daily, Weekly, Year-to-Date, Market Cap & Trends. Filter S&P 500 stocks list by sector: Show all, Tech, Finance, Energy, Staples, Retail, Industrial, Materials, Utilities and HealthCare |
| 12Stocks.com S&P 500 Stocks Performances & Trends Daily Report | |||||||||
|
| 
The overall Smart Investing & Trading Score is 100 (0-bearish to 100-bullish) which puts S&P 500 index in short term bullish trend. The Smart Investing & Trading Score from previous trading session is 83 and hence an improvement of trend. | ||||||||
Here are the Smart Investing & Trading Scores of the most requested S&P 500 stocks at 12Stocks.com (click stock name for detailed review):
|


| 12Stocks.com: Top Performing S&P 500 Index Stocks | ||||||||||||||||||||||||||||||||||||||||||||||||
 The top performing S&P 500 Index stocks year to date are
Now, more recently, over last week, the top performing S&P 500 Index stocks on the move are


|
||||||||||||||||||||||||||||||||||||||||||||||||
| 12Stocks.com: Investing in S&P 500 Index with Stocks | |
|
The following table helps investors and traders sort through current performance and trends (as measured by Smart Investing & Trading Score) of various
stocks in the S&P 500 Index. Quick View: Move mouse or cursor over stock symbol (ticker) to view short-term technical chart and over stock name to view long term chart. Click on  to add stock symbol to your watchlist and to add stock symbol to your watchlist and  to view watchlist. Click on any ticker or stock name for detailed market intelligence report for that stock. to view watchlist. Click on any ticker or stock name for detailed market intelligence report for that stock. |
12Stocks.com Performance of Stocks in S&P 500 Index
| Ticker | Stock Name | Watchlist | Category | Recent Price | Smart Investing & Trading Score | Change % | YTD Change% |
| MLM | Martin Marietta |   | Industrials | 612.68 | 78 | 1.08% | 22.80% |
| DOV | Dover | | Industrials | 185.17 | 78 | 0.79% | 20.39% |
| D | Dominion | | Utilities | 53.22 | 78 | 0.72% | 13.23% |
| DVA | DaVita | | Health Care | 137.88 | 78 | 0.63% | 31.62% |
| ECL | Ecolab | | Materials | 232.95 | 78 | 0.45% | 17.44% |
| CL | Colgate-Palmolive | | Consumer Staples | 94.53 | 78 | -0.04% | 18.59% |
| NFLX | Netflix | | Technology | 613.52 | 78 | -0.02% | 26.01% |
| PANW | Palo Alto | | Technology | 312.32 | 77 | 3.57% | 5.91% |
| PTC | PTC | | Technology | 183.85 | 77 | 1.84% | 5.08% |
| BR | Broadridge Financial | | Technology | 202.12 | 77 | 1.13% | -1.76% |
| CARR | Carrier Global | | Industrials | 65.80 | 76 | 1.29% | 14.53% |
| APD | Air Products | | Materials | 251.60 | 76 | 1.22% | -8.11% |
| TSN | Tyson Foods | | Consumer Staples | 60.71 | 76 | 0.73% | 12.95% |
| EVRG | Evergy | | Utilities | 55.64 | 76 | 0.61% | 6.59% |
| NTRS | Northern Trust | | Financials | 86.45 | 76 | 0.20% | 2.45% |
| KO | Coca-Cola | | Consumer Staples | 63.13 | 76 | 0.05% | 7.13% |
| HSY | Hershey | | Consumer Staples | 205.41 | 76 | -1.67% | 10.17% |
| K | Kellogg | | Consumer Staples | 61.83 | 76 | -1.17% | 10.59% |
| DOW | Dow | | Materials | 59.06 | 76 | -0.99% | 7.70% |
| AMCR | Amcor | | Consumer Staples | 10.34 | 76 | -0.86% | 7.26% |
| IFF | Flavors | | Materials | 96.51 | 76 | -0.12% | 19.19% |
| IR | Ingersoll Rand | | Industrials | 92.79 | 75 | 1.37% | 19.98% |
| TRGP | Targa Resources | | Energy | 115.58 | 75 | 1.00% | 33.05% |
| NDSN | Nordson | | Industrials | 274.56 | 75 | 0.94% | 3.94% |
| XOM | Exxon Mobil | | Energy | 118.58 | 75 | 0.77% | 18.60% |
| For chart view version of above stock list: Chart View ➞ 0 - 25 , 25 - 50 , 50 - 75 , 75 - 100 , 100 - 125 , 125 - 150 , 150 - 175 , 175 - 200 , 200 - 225 , 225 - 250 , 250 - 275 , 275 - 300 , 300 - 325 , 325 - 350 , 350 - 375 , 375 - 400 , 400 - 425 , 425 - 450 , 450 - 475 , 475 - 500 | ||
 | Click To Change The Sort Order: By Market Cap or Company Size Performance: Year-to-date, Week and Day |  |
|
Get the most comprehensive stock market coverage daily at 12Stocks.com ➞ Best Stocks Today ➞ Best Stocks Weekly ➞ Best Stocks Year-to-Date ➞ Best Stocks Trends ➞  Best Stocks Today 12Stocks.com Best Nasdaq Stocks ➞ Best S&P 500 Stocks ➞ Best Tech Stocks ➞ Best Biotech Stocks ➞ |
| Detailed Overview of S&P 500 Stocks |
| S&P 500 Technical Overview, Leaders & Laggards, Top S&P 500 ETF Funds & Detailed S&P 500 Stocks List, Charts, Trends & More |
| S&P 500: Technical Analysis, Trends & YTD Performance | |
| S&P 500 index as represented by
SPY, an exchange-traded fund [ETF], holds basket of five hundred (mostly largecap) stocks from across all major sectors of the US stock market. The S&P 500 index (contains stocks like Apple and Exxon) is up by 11.46% and is currently outperforming the overall market by 0.74% year-to-date. Below is a quick view of technical charts and trends: | |
 SPY Weekly Chart |
|
| Long Term Trend: Very Good | |
| Medium Term Trend: Very Good | |
 SPY Daily Chart |
|
| Short Term Trend: Very Good | |
| Overall Trend Score: 100 | |
| YTD Performance: 11.46% | |
| **Trend Scores & Views Are Only For Educational Purposes And Not For Investing | |
| 12Stocks.com: Investing in S&P 500 Index using Exchange Traded Funds | |
|
The following table shows list of key exchange traded funds (ETF) that
help investors track S&P 500 index. The following list also includes leveraged ETF funds that track twice or thrice the daily returns of S&P 500 indices. Short or inverse ETF funds move in the opposite direction to the index they track and are useful during market pullbacks or during bear markets. Quick View: Move mouse or cursor over ETF symbol (ticker) to view short-term technical chart and over ETF name to view long term chart. Click on ticker or stock name for detailed view. Click on to add stock symbol to your watchlist and to view watchlist. |
12Stocks.com List of ETFs that track S&P 500 Index
| Ticker | ETF Name | Watchlist | Recent Price | Smart Investing & Trading Score | Change % | Week % | Year-to-date % |
| SPY | SPDR S&P 500 ETF | | 529.78 | 100 | 1.24 | 1.72 | 11.46% |
| IVV | iShares Core S&P 500 ETF | | 530.30 | 100 | 0.83 | 1.32 | 11.03% |
| VOO | Vanguard 500 ETF | | 484.99 | 100 | 0.82 | 1.31 | 11.03% |
| OEF | iShares S&P 100 | | 252.61 | 100 | 1.27 | 1.92 | 13.08% |
| SSO | ProShares Ultra S&P500 | | 78.67 | 95 | 2.46 | 3.34 | 20.9% |
| UPRO | ProShares UltraPro S&P500 | | 71.64 | 100 | 3.66 | 5 | 30.87% |
| SPXL | Direxion Daily S&P500 Bull 3X ETF | | 134.55 | 100 | 2.55 | 3.86 | 29.39% |
| SH | ProShares Short S&P500 | | 11.83 | 0 | -1.17 | -1.58 | -8.93% |
| SDS | ProShares UltraShort S&P500 | | 24.52 | 0 | -2.43 | -3.27 | -18.05% |
| SPXU | ProShares UltraPro Short S&P500 | | 31.49 | 0 | -3.64 | -4.89 | -26.77% |
| SPXS | Direxion Daily S&P 500 Bear 3X ETF | | 8.63 | 10 | -2.38 | -3.79 | -25.28% |
| 12Stocks.com: Charts, Trends, Fundamental Data and Performances of S&P 500 Stocks | |
|
We now take in-depth look at all S&P 500 stocks including charts, multi-period performances and overall trends (as measured by Smart Investing & Trading Score). One can sort S&P 500 stocks (click link to choose) by Daily, Weekly and by Year-to-Date performances. Also, one can sort by size of the company or by market capitalization. |
| Select Your Default Chart Type: | |||||
| |||||
| Click on stock symbol or name for detailed view. Click on to add stock symbol to your watchlist and to view watchlist. Quick View: Move mouse or cursor over "Daily" to quickly view daily technical stock chart and over "Weekly" to view weekly technical stock chart. | |||||

 | MLM Martin Marietta Materials, Inc. |
| Sector: Industrials | |
| SubSector: General Building Materials | |
| MarketCap: 10624.3 Millions | |
| Recent Price: 612.68 Smart Investing & Trading Score: 78 | |
| Day Percent Change: 1.08% Day Change: 6.55 | |
| Week Change: 0.37% Year-to-date Change: 22.8% | |
| MLM Links: Profile News Message Board | |
| Charts:- Daily , Weekly | |
| Add MLM to Watchlist: View: Get MLM Trend Analysis ➞ | |
 | DOV Dover Corporation |
| Sector: Industrials | |
| SubSector: Diversified Machinery | |
| MarketCap: 10725.6 Millions | |
| Recent Price: 185.17 Smart Investing & Trading Score: 78 | |
| Day Percent Change: 0.79% Day Change: 1.46 | |
| Week Change: -0.2% Year-to-date Change: 20.4% | |
| DOV Links: Profile News Message Board | |
| Charts:- Daily , Weekly | |
| Add DOV to Watchlist: View: Get DOV Trend Analysis ➞ | |
 | D Dominion Energy, Inc. |
| Sector: Utilities | |
| SubSector: Electric Utilities | |
| MarketCap: 62365.3 Millions | |
| Recent Price: 53.22 Smart Investing & Trading Score: 78 | |
| Day Percent Change: 0.72% Day Change: 0.38 | |
| Week Change: 0.28% Year-to-date Change: 13.2% | |
| D Links: Profile News Message Board | |
| Charts:- Daily , Weekly | |
| Add D to Watchlist: View: Get D Trend Analysis ➞ | |
 | DVA DaVita Inc. |
| Sector: Health Care | |
| SubSector: Specialized Health Services | |
| MarketCap: 8954.36 Millions | |
| Recent Price: 137.88 Smart Investing & Trading Score: 78 | |
| Day Percent Change: 0.63% Day Change: 0.87 | |
| Week Change: 0.26% Year-to-date Change: 31.6% | |
| DVA Links: Profile News Message Board | |
| Charts:- Daily , Weekly | |
| Add DVA to Watchlist: View: Get DVA Trend Analysis ➞ | |
 | ECL Ecolab Inc. |
| Sector: Materials | |
| SubSector: Specialty Chemicals | |
| MarketCap: 46215.9 Millions | |
| Recent Price: 232.95 Smart Investing & Trading Score: 78 | |
| Day Percent Change: 0.45% Day Change: 1.05 | |
| Week Change: -0.24% Year-to-date Change: 17.4% | |
| ECL Links: Profile News Message Board | |
| Charts:- Daily , Weekly | |
| Add ECL to Watchlist: View: Get ECL Trend Analysis ➞ | |
 | CL Colgate-Palmolive Company |
| Sector: Consumer Staples | |
| SubSector: Personal Products | |
| MarketCap: 57242.7 Millions | |
| Recent Price: 94.53 Smart Investing & Trading Score: 78 | |
| Day Percent Change: -0.04% Day Change: -0.04 | |
| Week Change: -0.6% Year-to-date Change: 18.6% | |
| CL Links: Profile News Message Board | |
| Charts:- Daily , Weekly | |
| Add CL to Watchlist: View: Get CL Trend Analysis ➞ | |
 | NFLX Netflix, Inc. |
| Sector: Technology | |
| SubSector: CATV Systems | |
| MarketCap: 162108 Millions | |
| Recent Price: 613.52 Smart Investing & Trading Score: 78 | |
| Day Percent Change: -0.02% Day Change: -0.14 | |
| Week Change: 0.43% Year-to-date Change: 26.0% | |
| NFLX Links: Profile News Message Board | |
| Charts:- Daily , Weekly | |
| Add NFLX to Watchlist: View: Get NFLX Trend Analysis ➞ | |
 | PANW Palo Alto Networks, Inc. |
| Sector: Technology | |
| SubSector: Networking & Communication Devices | |
| MarketCap: 16039.4 Millions | |
| Recent Price: 312.32 Smart Investing & Trading Score: 77 | |
| Day Percent Change: 3.57% Day Change: 10.78 | |
| Week Change: 4.99% Year-to-date Change: 5.9% | |
| PANW Links: Profile News Message Board | |
| Charts:- Daily , Weekly | |
| Add PANW to Watchlist: View: Get PANW Trend Analysis ➞ | |
 | PTC PTC Inc. |
| Sector: Technology | |
| SubSector: Technical & System Software | |
| MarketCap: 6166.7 Millions | |
| Recent Price: 183.85 Smart Investing & Trading Score: 77 | |
| Day Percent Change: 1.84% Day Change: 3.32 | |
| Week Change: 2.14% Year-to-date Change: 5.1% | |
| PTC Links: Profile News Message Board | |
| Charts:- Daily , Weekly | |
| Add PTC to Watchlist: View: Get PTC Trend Analysis ➞ | |
 | BR Broadridge Financial Solutions, Inc. |
| Sector: Technology | |
| SubSector: Information Technology Services | |
| MarketCap: 10633.8 Millions | |
| Recent Price: 202.12 Smart Investing & Trading Score: 77 | |
| Day Percent Change: 1.13% Day Change: 2.25 | |
| Week Change: 3.29% Year-to-date Change: -1.8% | |
| BR Links: Profile News Message Board | |
| Charts:- Daily , Weekly | |
| Add BR to Watchlist: View: Get BR Trend Analysis ➞ | |
 | CARR Carrier Global Corporation |
| Sector: Industrials | |
| SubSector: Building Products & Equipment | |
| MarketCap: 32547 Millions | |
| Recent Price: 65.80 Smart Investing & Trading Score: 76 | |
| Day Percent Change: 1.29% Day Change: 0.84 | |
| Week Change: 0.46% Year-to-date Change: 14.5% | |
| CARR Links: Profile News Message Board | |
| Charts:- Daily , Weekly | |
| Add CARR to Watchlist: View: Get CARR Trend Analysis ➞ | |
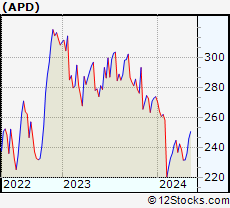 | APD Air Products and Chemicals, Inc. |
| Sector: Materials | |
| SubSector: Chemicals - Major Diversified | |
| MarketCap: 46203.6 Millions | |
| Recent Price: 251.60 Smart Investing & Trading Score: 76 | |
| Day Percent Change: 1.22% Day Change: 3.04 | |
| Week Change: 0.42% Year-to-date Change: -8.1% | |
| APD Links: Profile News Message Board | |
| Charts:- Daily , Weekly | |
| Add APD to Watchlist: View: Get APD Trend Analysis ➞ | |
 | TSN Tyson Foods, Inc. |
| Sector: Consumer Staples | |
| SubSector: Meat Products | |
| MarketCap: 22124.1 Millions | |
| Recent Price: 60.71 Smart Investing & Trading Score: 76 | |
| Day Percent Change: 0.73% Day Change: 0.44 | |
| Week Change: 1.78% Year-to-date Change: 13.0% | |
| TSN Links: Profile News Message Board | |
| Charts:- Daily , Weekly | |
| Add TSN to Watchlist: View: Get TSN Trend Analysis ➞ | |
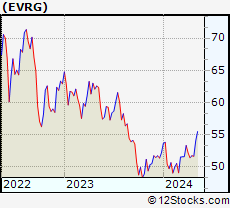 | EVRG Evergy, Inc. |
| Sector: Utilities | |
| SubSector: Electric Utilities | |
| MarketCap: 11914.8 Millions | |
| Recent Price: 55.64 Smart Investing & Trading Score: 76 | |
| Day Percent Change: 0.61% Day Change: 0.34 | |
| Week Change: 0.2% Year-to-date Change: 6.6% | |
| EVRG Links: Profile News Message Board | |
| Charts:- Daily , Weekly | |
| Add EVRG to Watchlist: View: Get EVRG Trend Analysis ➞ | |
 | NTRS Northern Trust Corporation |
| Sector: Financials | |
| SubSector: Asset Management | |
| MarketCap: 15316.8 Millions | |
| Recent Price: 86.45 Smart Investing & Trading Score: 76 | |
| Day Percent Change: 0.20% Day Change: 0.17 | |
| Week Change: -0.29% Year-to-date Change: 2.5% | |
| NTRS Links: Profile News Message Board | |
| Charts:- Daily , Weekly | |
| Add NTRS to Watchlist: View: Get NTRS Trend Analysis ➞ | |
 | KO The Coca-Cola Company |
| Sector: Consumer Staples | |
| SubSector: Beverages - Soft Drinks | |
| MarketCap: 182046 Millions | |
| Recent Price: 63.13 Smart Investing & Trading Score: 76 | |
| Day Percent Change: 0.05% Day Change: 0.03 | |
| Week Change: -0.21% Year-to-date Change: 7.1% | |
| KO Links: Profile News Message Board | |
| Charts:- Daily , Weekly | |
| Add KO to Watchlist: View: Get KO Trend Analysis ➞ | |
 | HSY The Hershey Company |
| Sector: Consumer Staples | |
| SubSector: Confectioners | |
| MarketCap: 27648.8 Millions | |
| Recent Price: 205.41 Smart Investing & Trading Score: 76 | |
| Day Percent Change: -1.67% Day Change: -3.48 | |
| Week Change: 0.31% Year-to-date Change: 10.2% | |
| HSY Links: Profile News Message Board | |
| Charts:- Daily , Weekly | |
| Add HSY to Watchlist: View: Get HSY Trend Analysis ➞ | |
 | K Kellogg Company |
| Sector: Consumer Staples | |
| SubSector: Processed & Packaged Goods | |
| MarketCap: 20264.6 Millions | |
| Recent Price: 61.83 Smart Investing & Trading Score: 76 | |
| Day Percent Change: -1.17% Day Change: -0.73 | |
| Week Change: -0.05% Year-to-date Change: 10.6% | |
| K Links: Profile News Message Board | |
| Charts:- Daily , Weekly | |
| Add K to Watchlist: View: Get K Trend Analysis ➞ | |
 | DOW Dow Inc. |
| Sector: Materials | |
| SubSector: Chemicals - Major Diversified | |
| MarketCap: 24098.6 Millions | |
| Recent Price: 59.06 Smart Investing & Trading Score: 76 | |
| Day Percent Change: -0.99% Day Change: -0.59 | |
| Week Change: -0.59% Year-to-date Change: 7.7% | |
| DOW Links: Profile News Message Board | |
| Charts:- Daily , Weekly | |
| Add DOW to Watchlist: View: Get DOW Trend Analysis ➞ | |
 | AMCR Amcor plc |
| Sector: Consumer Staples | |
| SubSector: Packaging & Containers | |
| MarketCap: 13964 Millions | |
| Recent Price: 10.34 Smart Investing & Trading Score: 76 | |
| Day Percent Change: -0.86% Day Change: -0.09 | |
| Week Change: -0.24% Year-to-date Change: 7.3% | |
| AMCR Links: Profile News Message Board | |
| Charts:- Daily , Weekly | |
| Add AMCR to Watchlist: View: Get AMCR Trend Analysis ➞ | |
 | IFF International Flavors & Fragrances Inc. |
| Sector: Materials | |
| SubSector: Specialty Chemicals | |
| MarketCap: 12178.7 Millions | |
| Recent Price: 96.51 Smart Investing & Trading Score: 76 | |
| Day Percent Change: -0.12% Day Change: -0.12 | |
| Week Change: -0.69% Year-to-date Change: 19.2% | |
| IFF Links: Profile News Message Board | |
| Charts:- Daily , Weekly | |
| Add IFF to Watchlist: View: Get IFF Trend Analysis ➞ | |
 | IR Ingersoll Rand Inc. |
| Sector: Industrials | |
| SubSector: Diversified Machinery | |
| MarketCap: 8970.56 Millions | |
| Recent Price: 92.79 Smart Investing & Trading Score: 75 | |
| Day Percent Change: 1.37% Day Change: 1.25 | |
| Week Change: 1.68% Year-to-date Change: 20.0% | |
| IR Links: Profile News Message Board | |
| Charts:- Daily , Weekly | |
| Add IR to Watchlist: View: Get IR Trend Analysis ➞ | |
 | TRGP Targa Resources Corp. |
| Sector: Energy | |
| SubSector: Oil & Gas Pipelines | |
| MarketCap: 2210.65 Millions | |
| Recent Price: 115.58 Smart Investing & Trading Score: 75 | |
| Day Percent Change: 1.00% Day Change: 1.15 | |
| Week Change: 2.1% Year-to-date Change: 33.1% | |
| TRGP Links: Profile News Message Board | |
| Charts:- Daily , Weekly | |
| Add TRGP to Watchlist: View: Get TRGP Trend Analysis ➞ | |
 | NDSN Nordson Corporation |
| Sector: Industrials | |
| SubSector: Diversified Machinery | |
| MarketCap: 7117.56 Millions | |
| Recent Price: 274.56 Smart Investing & Trading Score: 75 | |
| Day Percent Change: 0.94% Day Change: 2.57 | |
| Week Change: -1.55% Year-to-date Change: 3.9% | |
| NDSN Links: Profile News Message Board | |
| Charts:- Daily , Weekly | |
| Add NDSN to Watchlist: View: Get NDSN Trend Analysis ➞ | |
 | XOM Exxon Mobil Corporation |
| Sector: Energy | |
| SubSector: Major Integrated Oil & Gas | |
| MarketCap: 156450 Millions | |
| Recent Price: 118.58 Smart Investing & Trading Score: 75 | |
| Day Percent Change: 0.77% Day Change: 0.91 | |
| Week Change: 0.53% Year-to-date Change: 18.6% | |
| XOM Links: Profile News Message Board | |
| Charts:- Daily , Weekly | |
| Add XOM to Watchlist: View: Get XOM Trend Analysis ➞ | |
| For tabular summary view of above stock list: Summary View ➞ 0 - 25 , 25 - 50 , 50 - 75 , 75 - 100 , 100 - 125 , 125 - 150 , 150 - 175 , 175 - 200 , 200 - 225 , 225 - 250 , 250 - 275 , 275 - 300 , 300 - 325 , 325 - 350 , 350 - 375 , 375 - 400 , 400 - 425 , 425 - 450 , 450 - 475 , 475 - 500 | ||
| Click To Change The Sort Order: By Market Cap or Company Size Performance: Year-to-date, Week and Day | |
| Select Chart Type: | ||
|
Best Stocks Today 12Stocks.com |
© 2024 12Stocks.com Terms & Conditions Privacy Contact Us
All Information Provided Only For Education And Not To Be Used For Investing or Trading. See Terms & Conditions


One More Thing ... Get Best Stocks Delivered Daily!
Never Ever Miss A Move With Our Top Ten Stocks Lists
Find Best Stocks In Any Market - Bull or Bear Market
Take A Peek At Our Top Ten Stocks Lists: Daily, Weekly, Year-to-Date & Top Trends
Find Best Stocks In Any Market - Bull or Bear Market
Take A Peek At Our Top Ten Stocks Lists: Daily, Weekly, Year-to-Date & Top Trends
S&P 500 Stocks With Best Up Trends [0-bearish to 100-bullish]: MarketAxess Holdings[100], Edwards Life[100], KLA [100], AES [100], Arista Networks[100], Monolithic Power[100], Teradyne [100], Biogen [100], Applied Materials[100], ProShares UltraPro[100], KeyCorp [100]
Best S&P 500 Stocks Year-to-Date:
NVIDIA [91.09%], Constellation [90.68%], NRG [63.42%], Micron [49.77%], Western Digital[44.53%], Eaton [40.34%], Chipotle Mexican[38.54%], Arista Networks[38.44%], Leidos Holdings[36.04%], Meta Platforms[36.02%], Eli Lilly[35.01%] Best S&P 500 Stocks This Week:
Insulet [8.84%], Moderna [8.02%], Teleflex [7.78%], Broadcom [7.76%], IDEXX [7.59%], Incyte [7.52%], Teradyne [7.35%], QUALCOMM [6.88%], Equinix [6.86%], Tapestry [6.8%], Bio-Rad [6.73%] Best S&P 500 Stocks Daily:
D.R. Horton[6.47%], MarketAxess Holdings[6.11%], ServiceNow [5.40%], IDEXX [5.26%], Lennar [5.25%], Pulte [5.07%], Insulet [4.81%], Edwards Life[4.28%], Advanced Micro[4.25%], Blackstone [4.24%], KLA [4.08%]