
 Login Sign Up


| |||||
 |  | ||||

| 12Stocks.com Market Intelligence |
Best S&P 500 Stocks
|
On this page, you will find the most comprehensive analysis of S&P 500 stocks and ETFs - from latest trends to performances to charts ➞. First, here are the year-to-date (YTD) performances of the most requested S&P 500 stocks at 12Stocks.com (click stock for review):
| NVIDIA 91% | ||
| Google 23% | ||
| Amazon.com 22% | ||
| Caterpillar 22% | ||
| Merck 21% | ||
| Goldman Sachs 21% | ||
| JPMorgan Chase 19% | ||
| Walmart 14% | ||
| Microsoft 13% | ||
| Chevron 9% | ||
| Apple -1% | ||
| Johnson & Johnson -3% | ||
| McDonald s -8% | ||
| Gilead -17% | ||
| Starbucks -21% | ||
| Boeing -32% | ||
| Intel -38% | ||
| Quick: S&P 500 Stocks Lists: Performances & Trends, S&P 500 Stock Charts
Sort S&P 500 stocks: Daily, Weekly, Year-to-Date, Market Cap & Trends. Filter S&P 500 stocks list by sector: Show all, Tech, Finance, Energy, Staples, Retail, Industrial, Materials, Utilities and HealthCare |
| 12Stocks.com S&P 500 Stocks Performances & Trends Daily Report | |||||||||
|
| 
The overall Smart Investing & Trading Score is 100 (0-bearish to 100-bullish) which puts S&P 500 index in short term bullish trend. The Smart Investing & Trading Score from previous trading session is 83 and hence an improvement of trend. | ||||||||
Here are the Smart Investing & Trading Scores of the most requested S&P 500 stocks at 12Stocks.com (click stock name for detailed review):
|


| 12Stocks.com: Top Performing S&P 500 Index Stocks | ||||||||||||||||||||||||||||||||||||||||||||||||
 The top performing S&P 500 Index stocks year to date are
Now, more recently, over last week, the top performing S&P 500 Index stocks on the move are


|
||||||||||||||||||||||||||||||||||||||||||||||||
| 12Stocks.com: Investing in S&P 500 Index with Stocks | |
|
The following table helps investors and traders sort through current performance and trends (as measured by Smart Investing & Trading Score) of various
stocks in the S&P 500 Index. Quick View: Move mouse or cursor over stock symbol (ticker) to view short-term technical chart and over stock name to view long term chart. Click on  to add stock symbol to your watchlist and to add stock symbol to your watchlist and  to view watchlist. Click on any ticker or stock name for detailed market intelligence report for that stock. to view watchlist. Click on any ticker or stock name for detailed market intelligence report for that stock. |
12Stocks.com Performance of Stocks in S&P 500 Index
| Ticker | Stock Name | Watchlist | Category | Recent Price | Smart Investing & Trading Score | Change % | YTD Change% |
| WELL | Welltower |   | Financials | 101.00 | 100 | 2.21% | 12.01% |
| CMA | Comerica | | Financials | 55.18 | 100 | 2.19% | -1.13% |
| NEE | NextEra | | Utilities | 77.05 | 100 | 2.16% | 26.85% |
| SCHW | Charles Schwab | | Financials | 78.68 | 100 | 2.09% | 14.36% |
| VRTX | Vertex | | Health Care | 437.49 | 100 | 2.08% | 7.52% |
| VICI | VICI Properties | | Financials | 30.51 | 100 | 2.04% | -4.30% |
| COO | Cooper | | Health Care | 97.90 | 100 | 2.02% | 3.48% |
| TFC | Truist Financial | | Financials | 40.18 | 100 | 2.01% | 8.83% |
| HPQ | HP | | Technology | 31.36 | 100 | 1.95% | 4.22% |
| MCO | Moody s | | Services & Goods | 409.90 | 100 | 1.94% | 4.95% |
| JCI | Johnson Controls | | Consumer Staples | 68.18 | 100 | 1.94% | 18.29% |
| INVH | Invitation Homes | | Financials | 35.65 | 100 | 1.92% | 4.51% |
| IVZ | Invesco | | Financials | 16.31 | 100 | 1.87% | -8.58% |
| UHS | Universal Health | | Health Care | 182.24 | 100 | 1.86% | 19.55% |
| A | Agilent Technologies | | Health Care | 154.08 | 100 | 1.85% | 10.83% |
| HPE | Hewlett Packard | | Technology | 17.97 | 100 | 1.81% | 5.83% |
| ADI | Analog Devices | | Technology | 215.75 | 100 | 1.80% | 8.66% |
| PCG | PG&E | | Utilities | 18.31 | 100 | 1.67% | 1.55% |
| GS | Goldman Sachs | | Financials | 466.09 | 100 | 1.66% | 20.82% |
| DHR | Danaher | | Industrials | 263.46 | 100 | 1.62% | 13.88% |
| MCHP | Microchip | | Technology | 95.36 | 100 | 1.60% | 5.74% |
| CSCO | Cisco Systems | | Technology | 49.67 | 100 | 1.47% | -1.68% |
| TEL | TE Connectivity | | Technology | 151.46 | 100 | 1.45% | 7.80% |
| FIS | Fidelity National | | Technology | 77.48 | 100 | 1.43% | 28.98% |
| GNRC | Generac Holdings | | Industrials | 145.10 | 100 | 1.41% | 12.27% |
| For chart view version of above stock list: Chart View ➞ 0 - 25 , 25 - 50 , 50 - 75 , 75 - 100 , 100 - 125 , 125 - 150 , 150 - 175 , 175 - 200 , 200 - 225 , 225 - 250 , 250 - 275 , 275 - 300 , 300 - 325 , 325 - 350 , 350 - 375 , 375 - 400 , 400 - 425 , 425 - 450 , 450 - 475 , 475 - 500 | ||
 | Click To Change The Sort Order: By Market Cap or Company Size Performance: Year-to-date, Week and Day |  |
|
Get the most comprehensive stock market coverage daily at 12Stocks.com ➞ Best Stocks Today ➞ Best Stocks Weekly ➞ Best Stocks Year-to-Date ➞ Best Stocks Trends ➞  Best Stocks Today 12Stocks.com Best Nasdaq Stocks ➞ Best S&P 500 Stocks ➞ Best Tech Stocks ➞ Best Biotech Stocks ➞ |
| Detailed Overview of S&P 500 Stocks |
| S&P 500 Technical Overview, Leaders & Laggards, Top S&P 500 ETF Funds & Detailed S&P 500 Stocks List, Charts, Trends & More |
| S&P 500: Technical Analysis, Trends & YTD Performance | |
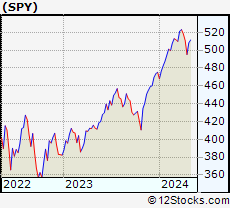
| S&P 500 index as represented by
SPY, an exchange-traded fund [ETF], holds basket of five hundred (mostly largecap) stocks from across all major sectors of the US stock market. The S&P 500 index (contains stocks like Apple and Exxon) is up by 11.46% and is currently outperforming the overall market by 0.74% year-to-date. Below is a quick view of technical charts and trends: | |
 SPY Weekly Chart |
|
| Long Term Trend: Very Good | |
| Medium Term Trend: Very Good | |
 SPY Daily Chart |
|
| Short Term Trend: Very Good | |
| Overall Trend Score: 100 | |
| YTD Performance: 11.46% | |
| **Trend Scores & Views Are Only For Educational Purposes And Not For Investing | |
| 12Stocks.com: Investing in S&P 500 Index using Exchange Traded Funds | |
|
The following table shows list of key exchange traded funds (ETF) that
help investors track S&P 500 index. The following list also includes leveraged ETF funds that track twice or thrice the daily returns of S&P 500 indices. Short or inverse ETF funds move in the opposite direction to the index they track and are useful during market pullbacks or during bear markets. Quick View: Move mouse or cursor over ETF symbol (ticker) to view short-term technical chart and over ETF name to view long term chart. Click on ticker or stock name for detailed view. Click on to add stock symbol to your watchlist and to view watchlist. |
12Stocks.com List of ETFs that track S&P 500 Index
| Ticker | ETF Name | Watchlist | Recent Price | Smart Investing & Trading Score | Change % | Week % | Year-to-date % |
| SPY | SPDR S&P 500 ETF | | 529.78 | 100 | 1.24 | 1.72 | 11.46% |
| IVV | iShares Core S&P 500 ETF | | 530.30 | 100 | 0.83 | 1.32 | 11.03% |
| VOO | Vanguard 500 ETF | | 484.99 | 100 | 0.82 | 1.31 | 11.03% |
| OEF | iShares S&P 100 | | 252.61 | 100 | 1.27 | 1.92 | 13.08% |
| SSO | ProShares Ultra S&P500 | | 78.67 | 95 | 2.46 | 3.34 | 20.9% |
| UPRO | ProShares UltraPro S&P500 | | 71.64 | 100 | 3.66 | 5 | 30.87% |
| SPXL | Direxion Daily S&P500 Bull 3X ETF | | 134.55 | 100 | 2.55 | 3.86 | 29.39% |
| SH | ProShares Short S&P500 | | 11.83 | 0 | -1.17 | -1.58 | -8.93% |
| SDS | ProShares UltraShort S&P500 | | 24.52 | 0 | -2.43 | -3.27 | -18.05% |
| SPXU | ProShares UltraPro Short S&P500 | | 31.49 | 0 | -3.64 | -4.89 | -26.77% |
| SPXS | Direxion Daily S&P 500 Bear 3X ETF | | 8.63 | 10 | -2.38 | -3.79 | -25.28% |
| 12Stocks.com: Charts, Trends, Fundamental Data and Performances of S&P 500 Stocks | |
|
We now take in-depth look at all S&P 500 stocks including charts, multi-period performances and overall trends (as measured by Smart Investing & Trading Score). One can sort S&P 500 stocks (click link to choose) by Daily, Weekly and by Year-to-Date performances. Also, one can sort by size of the company or by market capitalization. |
| Select Your Default Chart Type: | |||||
| |||||
| Click on stock symbol or name for detailed view. Click on to add stock symbol to your watchlist and to view watchlist. Quick View: Move mouse or cursor over "Daily" to quickly view daily technical stock chart and over "Weekly" to view weekly technical stock chart. | |||||

 | WELL Welltower Inc. |
| Sector: Financials | |
| SubSector: REIT - Healthcare Facilities | |
| MarketCap: 21398.8 Millions | |
| Recent Price: 101.00 Smart Investing & Trading Score: 100 | |
| Day Percent Change: 2.21% Day Change: 2.18 | |
| Week Change: 1.92% Year-to-date Change: 12.0% | |
| WELL Links: Profile News Message Board | |
| Charts:- Daily , Weekly | |
| Add WELL to Watchlist: View: Get WELL Trend Analysis ➞ | |
 | CMA Comerica Incorporated |
| Sector: Financials | |
| SubSector: Money Center Banks | |
| MarketCap: 4449.49 Millions | |
| Recent Price: 55.18 Smart Investing & Trading Score: 100 | |
| Day Percent Change: 2.19% Day Change: 1.18 | |
| Week Change: 3.01% Year-to-date Change: -1.1% | |
| CMA Links: Profile News Message Board | |
| Charts:- Daily , Weekly | |
| Add CMA to Watchlist: View: Get CMA Trend Analysis ➞ | |
 | NEE NextEra Energy, Inc. |
| Sector: Utilities | |
| SubSector: Electric Utilities | |
| MarketCap: 108288 Millions | |
| Recent Price: 77.05 Smart Investing & Trading Score: 100 | |
| Day Percent Change: 2.16% Day Change: 1.63 | |
| Week Change: 4.42% Year-to-date Change: 26.9% | |
| NEE Links: Profile News Message Board | |
| Charts:- Daily , Weekly | |
| Add NEE to Watchlist: View: Get NEE Trend Analysis ➞ | |
 | SCHW The Charles Schwab Corporation |
| Sector: Financials | |
| SubSector: Investment Brokerage - National | |
| MarketCap: 45115.8 Millions | |
| Recent Price: 78.68 Smart Investing & Trading Score: 100 | |
| Day Percent Change: 2.09% Day Change: 1.61 | |
| Week Change: 3.38% Year-to-date Change: 14.4% | |
| SCHW Links: Profile News Message Board | |
| Charts:- Daily , Weekly | |
| Add SCHW to Watchlist: View: Get SCHW Trend Analysis ➞ | |
 | VRTX Vertex Pharmaceuticals Incorporated |
| Sector: Health Care | |
| SubSector: Biotechnology | |
| MarketCap: 57669.6 Millions | |
| Recent Price: 437.49 Smart Investing & Trading Score: 100 | |
| Day Percent Change: 2.08% Day Change: 8.90 | |
| Week Change: 3.48% Year-to-date Change: 7.5% | |
| VRTX Links: Profile News Message Board | |
| Charts:- Daily , Weekly | |
| Add VRTX to Watchlist: View: Get VRTX Trend Analysis ➞ | |
 | VICI VICI Properties Inc. |
| Sector: Financials | |
| SubSector: REIT - Diversified | |
| MarketCap: 7327.03 Millions | |
| Recent Price: 30.51 Smart Investing & Trading Score: 100 | |
| Day Percent Change: 2.04% Day Change: 0.61 | |
| Week Change: 2.64% Year-to-date Change: -4.3% | |
| VICI Links: Profile News Message Board | |
| Charts:- Daily , Weekly | |
| Add VICI to Watchlist: View: Get VICI Trend Analysis ➞ | |
 | COO The Cooper Companies, Inc. |
| Sector: Health Care | |
| SubSector: Medical Instruments & Supplies | |
| MarketCap: 15460 Millions | |
| Recent Price: 97.90 Smart Investing & Trading Score: 100 | |
| Day Percent Change: 2.02% Day Change: 1.94 | |
| Week Change: 3.31% Year-to-date Change: 3.5% | |
| COO Links: Profile News Message Board | |
| Charts:- Daily , Weekly | |
| Add COO to Watchlist: View: Get COO Trend Analysis ➞ | |
 | TFC Truist Financial Corporation |
| Sector: Financials | |
| SubSector: Regional - Southeast Banks | |
| MarketCap: 44928.5 Millions | |
| Recent Price: 40.18 Smart Investing & Trading Score: 100 | |
| Day Percent Change: 2.01% Day Change: 0.79 | |
| Week Change: 2.87% Year-to-date Change: 8.8% | |
| TFC Links: Profile News Message Board | |
| Charts:- Daily , Weekly | |
| Add TFC to Watchlist: View: Get TFC Trend Analysis ➞ | |
 | HPQ HP Inc. |
| Sector: Technology | |
| SubSector: Diversified Computer Systems | |
| MarketCap: 22107.8 Millions | |
| Recent Price: 31.36 Smart Investing & Trading Score: 100 | |
| Day Percent Change: 1.95% Day Change: 0.60 | |
| Week Change: 5.52% Year-to-date Change: 4.2% | |
| HPQ Links: Profile News Message Board | |
| Charts:- Daily , Weekly | |
| Add HPQ to Watchlist: View: Get HPQ Trend Analysis ➞ | |
 | MCO Moody s Corporation |
| Sector: Services & Goods | |
| SubSector: Business Services | |
| MarketCap: 35998.5 Millions | |
| Recent Price: 409.90 Smart Investing & Trading Score: 100 | |
| Day Percent Change: 1.94% Day Change: 7.80 | |
| Week Change: 2.39% Year-to-date Change: 5.0% | |
| MCO Links: Profile News Message Board | |
| Charts:- Daily , Weekly | |
| Add MCO to Watchlist: View: Get MCO Trend Analysis ➞ | |
 | JCI Johnson Controls International plc |
| Sector: Consumer Staples | |
| SubSector: Auto Parts | |
| MarketCap: 21950.7 Millions | |
| Recent Price: 68.18 Smart Investing & Trading Score: 100 | |
| Day Percent Change: 1.94% Day Change: 1.30 | |
| Week Change: 3.95% Year-to-date Change: 18.3% | |
| JCI Links: Profile News Message Board | |
| Charts:- Daily , Weekly | |
| Add JCI to Watchlist: View: Get JCI Trend Analysis ➞ | |
 | INVH Invitation Homes Inc. |
| Sector: Financials | |
| SubSector: Real Estate Development | |
| MarketCap: 9782.89 Millions | |
| Recent Price: 35.65 Smart Investing & Trading Score: 100 | |
| Day Percent Change: 1.92% Day Change: 0.67 | |
| Week Change: 2.5% Year-to-date Change: 4.5% | |
| INVH Links: Profile News Message Board | |
| Charts:- Daily , Weekly | |
| Add INVH to Watchlist: View: Get INVH Trend Analysis ➞ | |
 | IVZ Invesco Ltd. |
| Sector: Financials | |
| SubSector: Asset Management | |
| MarketCap: 4578.23 Millions | |
| Recent Price: 16.31 Smart Investing & Trading Score: 100 | |
| Day Percent Change: 1.87% Day Change: 0.30 | |
| Week Change: 4.62% Year-to-date Change: -8.6% | |
| IVZ Links: Profile News Message Board | |
| Charts:- Daily , Weekly | |
| Add IVZ to Watchlist: View: Get IVZ Trend Analysis ➞ | |
 | UHS Universal Health Services, Inc. |
| Sector: Health Care | |
| SubSector: Hospitals | |
| MarketCap: 7217.66 Millions | |
| Recent Price: 182.24 Smart Investing & Trading Score: 100 | |
| Day Percent Change: 1.86% Day Change: 3.33 | |
| Week Change: 2.33% Year-to-date Change: 19.6% | |
| UHS Links: Profile News Message Board | |
| Charts:- Daily , Weekly | |
| Add UHS to Watchlist: View: Get UHS Trend Analysis ➞ | |
 | A Agilent Technologies, Inc. |
| Sector: Health Care | |
| SubSector: Medical Laboratories & Research | |
| MarketCap: 22337.9 Millions | |
| Recent Price: 154.08 Smart Investing & Trading Score: 100 | |
| Day Percent Change: 1.85% Day Change: 2.80 | |
| Week Change: 2.88% Year-to-date Change: 10.8% | |
| A Links: Profile News Message Board | |
| Charts:- Daily , Weekly | |
| Add A to Watchlist: View: Get A Trend Analysis ➞ | |
 | HPE Hewlett Packard Enterprise Company |
| Sector: Technology | |
| SubSector: Communication Equipment | |
| MarketCap: 12886.1 Millions | |
| Recent Price: 17.97 Smart Investing & Trading Score: 100 | |
| Day Percent Change: 1.81% Day Change: 0.32 | |
| Week Change: 5.33% Year-to-date Change: 5.8% | |
| HPE Links: Profile News Message Board | |
| Charts:- Daily , Weekly | |
| Add HPE to Watchlist: View: Get HPE Trend Analysis ➞ | |
 | ADI Analog Devices, Inc. |
| Sector: Technology | |
| SubSector: Semiconductor - Integrated Circuits | |
| MarketCap: 32859 Millions | |
| Recent Price: 215.75 Smart Investing & Trading Score: 100 | |
| Day Percent Change: 1.80% Day Change: 3.81 | |
| Week Change: 4.13% Year-to-date Change: 8.7% | |
| ADI Links: Profile News Message Board | |
| Charts:- Daily , Weekly | |
| Add ADI to Watchlist: View: Get ADI Trend Analysis ➞ | |
 | PCG PG&E Corporation |
| Sector: Utilities | |
| SubSector: Electric Utilities | |
| MarketCap: 5078.04 Millions | |
| Recent Price: 18.31 Smart Investing & Trading Score: 100 | |
| Day Percent Change: 1.67% Day Change: 0.30 | |
| Week Change: 2.69% Year-to-date Change: 1.6% | |
| PCG Links: Profile News Message Board | |
| Charts:- Daily , Weekly | |
| Add PCG to Watchlist: View: Get PCG Trend Analysis ➞ | |
 | GS The Goldman Sachs Group, Inc. |
| Sector: Financials | |
| SubSector: Investment Brokerage - National | |
| MarketCap: 54579.3 Millions | |
| Recent Price: 466.09 Smart Investing & Trading Score: 100 | |
| Day Percent Change: 1.66% Day Change: 7.62 | |
| Week Change: 2.5% Year-to-date Change: 20.8% | |
| GS Links: Profile News Message Board | |
| Charts:- Daily , Weekly | |
| Add GS to Watchlist: View: Get GS Trend Analysis ➞ | |
 | DHR Danaher Corporation |
| Sector: Industrials | |
| SubSector: Diversified Machinery | |
| MarketCap: 93210.3 Millions | |
| Recent Price: 263.46 Smart Investing & Trading Score: 100 | |
| Day Percent Change: 1.62% Day Change: 4.20 | |
| Week Change: 3.98% Year-to-date Change: 13.9% | |
| DHR Links: Profile News Message Board | |
| Charts:- Daily , Weekly | |
| Add DHR to Watchlist: View: Get DHR Trend Analysis ➞ | |
 | MCHP Microchip Technology Incorporated |
| Sector: Technology | |
| SubSector: Semiconductor - Broad Line | |
| MarketCap: 16826.3 Millions | |
| Recent Price: 95.36 Smart Investing & Trading Score: 100 | |
| Day Percent Change: 1.60% Day Change: 1.50 | |
| Week Change: 4.22% Year-to-date Change: 5.7% | |
| MCHP Links: Profile News Message Board | |
| Charts:- Daily , Weekly | |
| Add MCHP to Watchlist: View: Get MCHP Trend Analysis ➞ | |
 | CSCO Cisco Systems, Inc. |
| Sector: Technology | |
| SubSector: Communication Equipment | |
| MarketCap: 168483 Millions | |
| Recent Price: 49.67 Smart Investing & Trading Score: 100 | |
| Day Percent Change: 1.47% Day Change: 0.72 | |
| Week Change: 3.35% Year-to-date Change: -1.7% | |
| CSCO Links: Profile News Message Board | |
| Charts:- Daily , Weekly | |
| Add CSCO to Watchlist: View: Get CSCO Trend Analysis ➞ | |
 | TEL TE Connectivity Ltd. |
| Sector: Technology | |
| SubSector: Diversified Electronics | |
| MarketCap: 20044.9 Millions | |
| Recent Price: 151.46 Smart Investing & Trading Score: 100 | |
| Day Percent Change: 1.45% Day Change: 2.17 | |
| Week Change: 3.6% Year-to-date Change: 7.8% | |
| TEL Links: Profile News Message Board | |
| Charts:- Daily , Weekly | |
| Add TEL to Watchlist: View: Get TEL Trend Analysis ➞ | |
 | FIS Fidelity National Information Services, Inc. |
| Sector: Technology | |
| SubSector: Information Technology Services | |
| MarketCap: 71126.8 Millions | |
| Recent Price: 77.48 Smart Investing & Trading Score: 100 | |
| Day Percent Change: 1.43% Day Change: 1.09 | |
| Week Change: 3.8% Year-to-date Change: 29.0% | |
| FIS Links: Profile News Message Board | |
| Charts:- Daily , Weekly | |
| Add FIS to Watchlist: View: Get FIS Trend Analysis ➞ | |
 | GNRC Generac Holdings Inc. |
| Sector: Industrials | |
| SubSector: Diversified Machinery | |
| MarketCap: 5736.26 Millions | |
| Recent Price: 145.10 Smart Investing & Trading Score: 100 | |
| Day Percent Change: 1.41% Day Change: 2.02 | |
| Week Change: 5.51% Year-to-date Change: 12.3% | |
| GNRC Links: Profile News Message Board | |
| Charts:- Daily , Weekly | |
| Add GNRC to Watchlist: View: Get GNRC Trend Analysis ➞ | |
| For tabular summary view of above stock list: Summary View ➞ 0 - 25 , 25 - 50 , 50 - 75 , 75 - 100 , 100 - 125 , 125 - 150 , 150 - 175 , 175 - 200 , 200 - 225 , 225 - 250 , 250 - 275 , 275 - 300 , 300 - 325 , 325 - 350 , 350 - 375 , 375 - 400 , 400 - 425 , 425 - 450 , 450 - 475 , 475 - 500 | ||
| Click To Change The Sort Order: By Market Cap or Company Size Performance: Year-to-date, Week and Day | |
| Select Chart Type: | ||
|
Best Stocks Today 12Stocks.com |
© 2024 12Stocks.com Terms & Conditions Privacy Contact Us
All Information Provided Only For Education And Not To Be Used For Investing or Trading. See Terms & Conditions


One More Thing ... Get Best Stocks Delivered Daily!
Never Ever Miss A Move With Our Top Ten Stocks Lists
Find Best Stocks In Any Market - Bull or Bear Market
Take A Peek At Our Top Ten Stocks Lists: Daily, Weekly, Year-to-Date & Top Trends
Find Best Stocks In Any Market - Bull or Bear Market
Take A Peek At Our Top Ten Stocks Lists: Daily, Weekly, Year-to-Date & Top Trends
S&P 500 Stocks With Best Up Trends [0-bearish to 100-bullish]: MarketAxess Holdings[100], Edwards Life[100], KLA [100], AES [100], Arista Networks[100], Monolithic Power[100], Teradyne [100], Biogen [100], Applied Materials[100], ProShares UltraPro[100], KeyCorp [100]
Best S&P 500 Stocks Year-to-Date:
NVIDIA [91.09%], Constellation [90.68%], NRG [63.42%], Micron [49.77%], Western Digital[44.53%], Eaton [40.34%], Chipotle Mexican[38.54%], Arista Networks[38.44%], Leidos Holdings[36.04%], Meta Platforms[36.02%], Eli Lilly[35.01%] Best S&P 500 Stocks This Week:
Insulet [8.84%], Moderna [8.02%], Teleflex [7.78%], Broadcom [7.76%], IDEXX [7.59%], Incyte [7.52%], Teradyne [7.35%], QUALCOMM [6.88%], Equinix [6.86%], Tapestry [6.8%], Bio-Rad [6.73%] Best S&P 500 Stocks Daily:
D.R. Horton[6.47%], MarketAxess Holdings[6.11%], ServiceNow [5.40%], IDEXX [5.26%], Lennar [5.25%], Pulte [5.07%], Insulet [4.81%], Edwards Life[4.28%], Advanced Micro[4.25%], Blackstone [4.24%], KLA [4.08%]