
 Login Sign Up


| |||||
 |  | ||||

| 12Stocks.com Market Intelligence |
Best S&P 500 Stocks
|
On this page, you will find the most comprehensive analysis of S&P 500 stocks and ETFs - from latest trends to performances to charts ➞. First, here are the year-to-date (YTD) performances of the most requested S&P 500 stocks at 12Stocks.com (click stock for review):
| NVIDIA 77% | ||
| Amazon.com 22% | ||
| Google 18% | ||
| Merck 17% | ||
| Goldman Sachs 14% | ||
| Caterpillar 13% | ||
| Walmart 13% | ||
| JPMorgan Chase 12% | ||
| Microsoft 8% | ||
| Chevron 5% | ||
| Apple -4% | ||
| Johnson & Johnson -5% | ||
| McDonald s -9% | ||
| Gilead -20% | ||
| Starbucks -23% | ||
| Boeing -31% | ||
| Intel -39% | ||
| Quick: S&P 500 Stocks Lists: Performances & Trends, S&P 500 Stock Charts
Sort S&P 500 stocks: Daily, Weekly, Year-to-Date, Market Cap & Trends. Filter S&P 500 stocks list by sector: Show all, Tech, Finance, Energy, Staples, Retail, Industrial, Materials, Utilities and HealthCare |
| 12Stocks.com S&P 500 Stocks Performances & Trends Daily Report | |||||||||
|
| 
The overall Smart Investing & Trading Score is 60 (0-bearish to 100-bullish) which puts S&P 500 index in short term neutral to bullish trend. The Smart Investing & Trading Score from previous trading session is 30 and hence an improvement of trend. | ||||||||
Here are the Smart Investing & Trading Scores of the most requested S&P 500 stocks at 12Stocks.com (click stock name for detailed review):
|


| 12Stocks.com: Top Performing S&P 500 Index Stocks | ||||||||||||||||||||||||||||||||||||||||||||||||
 The top performing S&P 500 Index stocks year to date are
Now, more recently, over last week, the top performing S&P 500 Index stocks on the move are


|
||||||||||||||||||||||||||||||||||||||||||||||||
| 12Stocks.com: Investing in S&P 500 Index with Stocks | |
|
The following table helps investors and traders sort through current performance and trends (as measured by Smart Investing & Trading Score) of various
stocks in the S&P 500 Index. Quick View: Move mouse or cursor over stock symbol (ticker) to view short-term technical chart and over stock name to view long term chart. Click on  to add stock symbol to your watchlist and to add stock symbol to your watchlist and  to view watchlist. Click on any ticker or stock name for detailed market intelligence report for that stock. to view watchlist. Click on any ticker or stock name for detailed market intelligence report for that stock. |
12Stocks.com Performance of Stocks in S&P 500 Index
| Ticker | Stock Name | Watchlist | Category | Recent Price | Smart Investing & Trading Score | Change % | Weekly Change% |
| STLD | Steel Dynamics |   | Materials | 133.26 | 45 | 1.89% | -0.58% |
| PGR | Progressive | | Financials | 206.79 | 34 | -1.07% | -0.60% |
| FRT | Federal Realty | | Financials | 101.56 | 63 | -3.19% | -0.62% |
| AAL | American Airlines | | Transports | 13.79 | 57 | -0.54% | -0.68% |
| PAYX | Paychex | | Services & Goods | 119.14 | 25 | 0.58% | -0.69% |
| TRV | Travelers | | Financials | 211.96 | 18 | -1.13% | -0.70% |
| SJM | J. M. | | Consumer Staples | 112.78 | 42 | -0.06% | -0.72% |
| LMT | Lockheed Martin | | Industrials | 457.91 | 63 | -1.14% | -0.73% |
| MOH | Molina Healthcare | | Health Care | 339.66 | 10 | 0.03% | -0.75% |
| CSX | CSX | | Transports | 33.73 | 32 | 0.49% | -0.75% |
| EXC | Exelon | | Utilities | 37.03 | 78 | -2.26% | -0.76% |
| CDNS | Cadence Design | | Technology | 280.08 | 32 | 1.32% | -0.83% |
| KMX | CarMax | | Services & Goods | 69.00 | 32 | 1.42% | -0.84% |
| EW | Edwards Life | | Health Care | 85.70 | 68 | 0.75% | -0.84% |
| SNA | Snap-on | | Industrials | 268.32 | 32 | 0.54% | -0.88% |
| DOW | Dow | | Materials | 56.78 | 54 | -0.09% | -0.89% |
| HRL | Hormel Foods | | Consumer Staples | 34.99 | 45 | -1.20% | -0.92% |
| POOL | Pool | | Consumer Staples | 367.71 | 17 | 2.11% | -0.93% |
| DLTR | Dollar Tree | | Services & Goods | 120.58 | 32 | 0.67% | -0.95% |
| CAG | Conagra Brands | | Consumer Staples | 30.77 | 64 | -0.24% | -0.98% |
| BXP | Boston Properties | | Financials | 60.91 | 55 | 1.40% | -0.98% |
| CMG | Chipotle Mexican | | Services & Goods | 3155.67 | 78 | 0.44% | -0.98% |
| MU | Micron | | Technology | 113.70 | 70 | 1.22% | -0.99% |
| IBM | Business | | Technology | 165.43 | 25 | 0.45% | -1.02% |
| CTSH | Cognizant | | Technology | 66.25 | 42 | -0.03% | -1.03% |
| For chart view version of above stock list: Chart View ➞ 0 - 25 , 25 - 50 , 50 - 75 , 75 - 100 , 100 - 125 , 125 - 150 , 150 - 175 , 175 - 200 , 200 - 225 , 225 - 250 , 250 - 275 , 275 - 300 , 300 - 325 , 325 - 350 , 350 - 375 , 375 - 400 , 400 - 425 , 425 - 450 , 450 - 475 , 475 - 500 | ||
 | Click To Change The Sort Order: By Market Cap or Company Size Performance: Year-to-date, Week and Day |  |
|
Get the most comprehensive stock market coverage daily at 12Stocks.com ➞ Best Stocks Today ➞ Best Stocks Weekly ➞ Best Stocks Year-to-Date ➞ Best Stocks Trends ➞  Best Stocks Today 12Stocks.com Best Nasdaq Stocks ➞ Best S&P 500 Stocks ➞ Best Tech Stocks ➞ Best Biotech Stocks ➞ |
| Detailed Overview of S&P 500 Stocks |
| S&P 500 Technical Overview, Leaders & Laggards, Top S&P 500 ETF Funds & Detailed S&P 500 Stocks List, Charts, Trends & More |
| S&P 500: Technical Analysis, Trends & YTD Performance | |
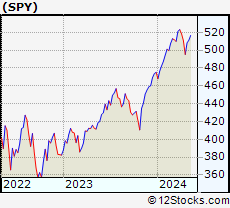
| S&P 500 index as represented by
SPY, an exchange-traded fund [ETF], holds basket of five hundred (mostly largecap) stocks from across all major sectors of the US stock market. The S&P 500 index (contains stocks like Apple and Exxon) is up by 7.05% and is currently outperforming the overall market by 0.56% year-to-date. Below is a quick view of technical charts and trends: | |
 SPY Weekly Chart |
|
| Long Term Trend: Good | |
| Medium Term Trend: Not Good | |
 SPY Daily Chart |
|
| Short Term Trend: Very Good | |
| Overall Trend Score: 60 | |
| YTD Performance: 7.05% | |
| **Trend Scores & Views Are Only For Educational Purposes And Not For Investing | |
| 12Stocks.com: Investing in S&P 500 Index using Exchange Traded Funds | |
|
The following table shows list of key exchange traded funds (ETF) that
help investors track S&P 500 index. The following list also includes leveraged ETF funds that track twice or thrice the daily returns of S&P 500 indices. Short or inverse ETF funds move in the opposite direction to the index they track and are useful during market pullbacks or during bear markets. Quick View: Move mouse or cursor over ETF symbol (ticker) to view short-term technical chart and over ETF name to view long term chart. Click on ticker or stock name for detailed view. Click on to add stock symbol to your watchlist and to view watchlist. |
12Stocks.com List of ETFs that track S&P 500 Index
| Ticker | ETF Name | Watchlist | Recent Price | Smart Investing & Trading Score | Change % | Week % | Year-to-date % |
| SPY | SPDR S&P 500 ETF | | 508.84 | 60 | 0.75 | 0.11 | 7.05% |
| IVV | iShares Core S&P 500 ETF | | 511.36 | 30 | 0.77 | 0.12 | 7.06% |
| VOO | Vanguard 500 ETF | | 467.73 | 30 | 0.76 | 0.11 | 7.08% |
| OEF | iShares S&P 100 | | 242.65 | 73 | 1.01 | 0.45 | 8.62% |
| SSO | ProShares Ultra S&P500 | | 72.86 | 60 | 1.67 | 0.21 | 11.97% |
| UPRO | ProShares UltraPro S&P500 | | 63.93 | 39 | 2.50 | 0.17 | 16.79% |
| SH | ProShares Short S&P500 | | 12.29 | 41 | -0.73 | 0.08 | -5.39% |
| SDS | ProShares UltraShort S&P500 | | 26.52 | 28 | -1.41 | -0.04 | -11.36% |
| SPXU | ProShares UltraPro Short S&P500 | | 35.38 | 23 | -2.43 | -0.34 | -17.72% |
| SPXS | Direxion Daily S&P 500 Bear 3X ETF | | 9.57 | 71 | -2.45 | -0.42 | -17.14% |
| 12Stocks.com: Charts, Trends, Fundamental Data and Performances of S&P 500 Stocks | |
|
We now take in-depth look at all S&P 500 stocks including charts, multi-period performances and overall trends (as measured by Smart Investing & Trading Score). One can sort S&P 500 stocks (click link to choose) by Daily, Weekly and by Year-to-Date performances. Also, one can sort by size of the company or by market capitalization. |
| Select Your Default Chart Type: | |||||
| |||||
| Click on stock symbol or name for detailed view. Click on to add stock symbol to your watchlist and to view watchlist. Quick View: Move mouse or cursor over "Daily" to quickly view daily technical stock chart and over "Weekly" to view weekly technical stock chart. | |||||

 | STLD Steel Dynamics, Inc. |
| Sector: Materials | |
| SubSector: Steel & Iron | |
| MarketCap: 4533.58 Millions | |
| Recent Price: 133.26 Smart Investing & Trading Score: 45 | |
| Day Percent Change: 1.89% Day Change: 2.47 | |
| Week Change: -0.58% Year-to-date Change: 12.8% | |
| STLD Links: Profile News Message Board | |
| Charts:- Daily , Weekly | |
| Add STLD to Watchlist: View: Get STLD Trend Analysis ➞ | |
 | PGR The Progressive Corporation |
| Sector: Financials | |
| SubSector: Property & Casualty Insurance | |
| MarketCap: 43112 Millions | |
| Recent Price: 206.79 Smart Investing & Trading Score: 34 | |
| Day Percent Change: -1.07% Day Change: -2.24 | |
| Week Change: -0.6% Year-to-date Change: 29.8% | |
| PGR Links: Profile News Message Board | |
| Charts:- Daily , Weekly | |
| Add PGR to Watchlist: View: Get PGR Trend Analysis ➞ | |
 | FRT Federal Realty Investment Trust |
| Sector: Financials | |
| SubSector: REIT - Retail | |
| MarketCap: 5878.64 Millions | |
| Recent Price: 101.56 Smart Investing & Trading Score: 63 | |
| Day Percent Change: -3.19% Day Change: -3.35 | |
| Week Change: -0.62% Year-to-date Change: -1.5% | |
| FRT Links: Profile News Message Board | |
| Charts:- Daily , Weekly | |
| Add FRT to Watchlist: View: Get FRT Trend Analysis ➞ | |
 | AAL American Airlines Group Inc. |
| Sector: Transports | |
| SubSector: Major Airlines | |
| MarketCap: 5346.45 Millions | |
| Recent Price: 13.79 Smart Investing & Trading Score: 57 | |
| Day Percent Change: -0.54% Day Change: -0.07 | |
| Week Change: -0.68% Year-to-date Change: 0.3% | |
| AAL Links: Profile News Message Board | |
| Charts:- Daily , Weekly | |
| Add AAL to Watchlist: View: Get AAL Trend Analysis ➞ | |
 | PAYX Paychex, Inc. |
| Sector: Services & Goods | |
| SubSector: Staffing & Outsourcing Services | |
| MarketCap: 20928.8 Millions | |
| Recent Price: 119.14 Smart Investing & Trading Score: 25 | |
| Day Percent Change: 0.58% Day Change: 0.69 | |
| Week Change: -0.69% Year-to-date Change: 0.0% | |
| PAYX Links: Profile News Message Board | |
| Charts:- Daily , Weekly | |
| Add PAYX to Watchlist: View: Get PAYX Trend Analysis ➞ | |
 | TRV The Travelers Companies, Inc. |
| Sector: Financials | |
| SubSector: Property & Casualty Insurance | |
| MarketCap: 25155.9 Millions | |
| Recent Price: 211.96 Smart Investing & Trading Score: 18 | |
| Day Percent Change: -1.13% Day Change: -2.41 | |
| Week Change: -0.7% Year-to-date Change: 11.3% | |
| TRV Links: Profile News Message Board | |
| Charts:- Daily , Weekly | |
| Add TRV to Watchlist: View: Get TRV Trend Analysis ➞ | |
 | SJM The J. M. Smucker Company |
| Sector: Consumer Staples | |
| SubSector: Processed & Packaged Goods | |
| MarketCap: 12635.8 Millions | |
| Recent Price: 112.78 Smart Investing & Trading Score: 42 | |
| Day Percent Change: -0.06% Day Change: -0.07 | |
| Week Change: -0.72% Year-to-date Change: -10.8% | |
| SJM Links: Profile News Message Board | |
| Charts:- Daily , Weekly | |
| Add SJM to Watchlist: View: Get SJM Trend Analysis ➞ | |
 | LMT Lockheed Martin Corporation |
| Sector: Industrials | |
| SubSector: Aerospace/Defense Products & Services | |
| MarketCap: 94116.4 Millions | |
| Recent Price: 457.91 Smart Investing & Trading Score: 63 | |
| Day Percent Change: -1.14% Day Change: -5.29 | |
| Week Change: -0.73% Year-to-date Change: 1.0% | |
| LMT Links: Profile News Message Board | |
| Charts:- Daily , Weekly | |
| Add LMT to Watchlist: View: Get LMT Trend Analysis ➞ | |
 | MOH Molina Healthcare, Inc. |
| Sector: Health Care | |
| SubSector: Health Care Plans | |
| MarketCap: 7235.6 Millions | |
| Recent Price: 339.66 Smart Investing & Trading Score: 10 | |
| Day Percent Change: 0.03% Day Change: 0.11 | |
| Week Change: -0.75% Year-to-date Change: -6.0% | |
| MOH Links: Profile News Message Board | |
| Charts:- Daily , Weekly | |
| Add MOH to Watchlist: View: Get MOH Trend Analysis ➞ | |
 | CSX CSX Corporation |
| Sector: Transports | |
| SubSector: Railroads | |
| MarketCap: 42131.2 Millions | |
| Recent Price: 33.73 Smart Investing & Trading Score: 32 | |
| Day Percent Change: 0.49% Day Change: 0.16 | |
| Week Change: -0.75% Year-to-date Change: -2.7% | |
| CSX Links: Profile News Message Board | |
| Charts:- Daily , Weekly | |
| Add CSX to Watchlist: View: Get CSX Trend Analysis ➞ | |
 | EXC Exelon Corporation |
| Sector: Utilities | |
| SubSector: Diversified Utilities | |
| MarketCap: 34091.9 Millions | |
| Recent Price: 37.03 Smart Investing & Trading Score: 78 | |
| Day Percent Change: -2.26% Day Change: -0.86 | |
| Week Change: -0.76% Year-to-date Change: 3.2% | |
| EXC Links: Profile News Message Board | |
| Charts:- Daily , Weekly | |
| Add EXC to Watchlist: View: Get EXC Trend Analysis ➞ | |
 | CDNS Cadence Design Systems, Inc. |
| Sector: Technology | |
| SubSector: Application Software | |
| MarketCap: 16865.8 Millions | |
| Recent Price: 280.08 Smart Investing & Trading Score: 32 | |
| Day Percent Change: 1.32% Day Change: 3.64 | |
| Week Change: -0.83% Year-to-date Change: 2.8% | |
| CDNS Links: Profile News Message Board | |
| Charts:- Daily , Weekly | |
| Add CDNS to Watchlist: View: Get CDNS Trend Analysis ➞ | |
 | KMX CarMax, Inc. |
| Sector: Services & Goods | |
| SubSector: Auto Dealerships | |
| MarketCap: 8121.71 Millions | |
| Recent Price: 69.00 Smart Investing & Trading Score: 32 | |
| Day Percent Change: 1.42% Day Change: 0.96 | |
| Week Change: -0.84% Year-to-date Change: -10.1% | |
| KMX Links: Profile News Message Board | |
| Charts:- Daily , Weekly | |
| Add KMX to Watchlist: View: Get KMX Trend Analysis ➞ | |
 | EW Edwards Lifesciences Corporation |
| Sector: Health Care | |
| SubSector: Medical Appliances & Equipment | |
| MarketCap: 36735.5 Millions | |
| Recent Price: 85.70 Smart Investing & Trading Score: 68 | |
| Day Percent Change: 0.75% Day Change: 0.64 | |
| Week Change: -0.84% Year-to-date Change: 12.4% | |
| EW Links: Profile News Message Board | |
| Charts:- Daily , Weekly | |
| Add EW to Watchlist: View: Get EW Trend Analysis ➞ | |
 | SNA Snap-on Incorporated |
| Sector: Industrials | |
| SubSector: Small Tools & Accessories | |
| MarketCap: 5947.26 Millions | |
| Recent Price: 268.32 Smart Investing & Trading Score: 32 | |
| Day Percent Change: 0.54% Day Change: 1.45 | |
| Week Change: -0.88% Year-to-date Change: -7.1% | |
| SNA Links: Profile News Message Board | |
| Charts:- Daily , Weekly | |
| Add SNA to Watchlist: View: Get SNA Trend Analysis ➞ | |
 | DOW Dow Inc. |
| Sector: Materials | |
| SubSector: Chemicals - Major Diversified | |
| MarketCap: 24098.6 Millions | |
| Recent Price: 56.78 Smart Investing & Trading Score: 54 | |
| Day Percent Change: -0.09% Day Change: -0.05 | |
| Week Change: -0.89% Year-to-date Change: 3.5% | |
| DOW Links: Profile News Message Board | |
| Charts:- Daily , Weekly | |
| Add DOW to Watchlist: View: Get DOW Trend Analysis ➞ | |
 | HRL Hormel Foods Corporation |
| Sector: Consumer Staples | |
| SubSector: Meat Products | |
| MarketCap: 25590.2 Millions | |
| Recent Price: 34.99 Smart Investing & Trading Score: 45 | |
| Day Percent Change: -1.20% Day Change: -0.43 | |
| Week Change: -0.92% Year-to-date Change: 9.0% | |
| HRL Links: Profile News Message Board | |
| Charts:- Daily , Weekly | |
| Add HRL to Watchlist: View: Get HRL Trend Analysis ➞ | |
 | POOL Pool Corporation |
| Sector: Consumer Staples | |
| SubSector: Sporting Goods | |
| MarketCap: 7479.64 Millions | |
| Recent Price: 367.71 Smart Investing & Trading Score: 17 | |
| Day Percent Change: 2.11% Day Change: 7.60 | |
| Week Change: -0.93% Year-to-date Change: -7.8% | |
| POOL Links: Profile News Message Board | |
| Charts:- Daily , Weekly | |
| Add POOL to Watchlist: View: Get POOL Trend Analysis ➞ | |
 | DLTR Dollar Tree, Inc. |
| Sector: Services & Goods | |
| SubSector: Discount, Variety Stores | |
| MarketCap: 21383.2 Millions | |
| Recent Price: 120.58 Smart Investing & Trading Score: 32 | |
| Day Percent Change: 0.67% Day Change: 0.80 | |
| Week Change: -0.95% Year-to-date Change: -15.1% | |
| DLTR Links: Profile News Message Board | |
| Charts:- Daily , Weekly | |
| Add DLTR to Watchlist: View: Get DLTR Trend Analysis ➞ | |
 | CAG Conagra Brands, Inc. |
| Sector: Consumer Staples | |
| SubSector: Processed & Packaged Goods | |
| MarketCap: 14084.1 Millions | |
| Recent Price: 30.77 Smart Investing & Trading Score: 64 | |
| Day Percent Change: -0.24% Day Change: -0.08 | |
| Week Change: -0.98% Year-to-date Change: 7.4% | |
| CAG Links: Profile News Message Board | |
| Charts:- Daily , Weekly | |
| Add CAG to Watchlist: View: Get CAG Trend Analysis ➞ | |
 | BXP Boston Properties, Inc. |
| Sector: Financials | |
| SubSector: REIT - Office | |
| MarketCap: 13788.6 Millions | |
| Recent Price: 60.91 Smart Investing & Trading Score: 55 | |
| Day Percent Change: 1.40% Day Change: 0.84 | |
| Week Change: -0.98% Year-to-date Change: -13.2% | |
| BXP Links: Profile News Message Board | |
| Charts:- Daily , Weekly | |
| Add BXP to Watchlist: View: Get BXP Trend Analysis ➞ | |
 | CMG Chipotle Mexican Grill, Inc. |
| Sector: Services & Goods | |
| SubSector: Restaurants | |
| MarketCap: 16849.9 Millions | |
| Recent Price: 3155.67 Smart Investing & Trading Score: 78 | |
| Day Percent Change: 0.44% Day Change: 13.68 | |
| Week Change: -0.98% Year-to-date Change: 38.0% | |
| CMG Links: Profile News Message Board | |
| Charts:- Daily , Weekly | |
| Add CMG to Watchlist: View: Get CMG Trend Analysis ➞ | |
 | MU Micron Technology, Inc. |
| Sector: Technology | |
| SubSector: Semiconductor- Memory Chips | |
| MarketCap: 45188.4 Millions | |
| Recent Price: 113.70 Smart Investing & Trading Score: 70 | |
| Day Percent Change: 1.22% Day Change: 1.37 | |
| Week Change: -0.99% Year-to-date Change: 33.2% | |
| MU Links: Profile News Message Board | |
| Charts:- Daily , Weekly | |
| Add MU to Watchlist: View: Get MU Trend Analysis ➞ | |
 | IBM International Business Machines Corporation |
| Sector: Technology | |
| SubSector: Information Technology Services | |
| MarketCap: 97241.6 Millions | |
| Recent Price: 165.43 Smart Investing & Trading Score: 25 | |
| Day Percent Change: 0.45% Day Change: 0.74 | |
| Week Change: -1.02% Year-to-date Change: 1.2% | |
| IBM Links: Profile News Message Board | |
| Charts:- Daily , Weekly | |
| Add IBM to Watchlist: View: Get IBM Trend Analysis ➞ | |
 | CTSH Cognizant Technology Solutions Corporation |
| Sector: Technology | |
| SubSector: Information Technology Services | |
| MarketCap: 26249.7 Millions | |
| Recent Price: 66.25 Smart Investing & Trading Score: 42 | |
| Day Percent Change: -0.03% Day Change: -0.02 | |
| Week Change: -1.03% Year-to-date Change: -12.3% | |
| CTSH Links: Profile News Message Board | |
| Charts:- Daily , Weekly | |
| Add CTSH to Watchlist: View: Get CTSH Trend Analysis ➞ | |
| For tabular summary view of above stock list: Summary View ➞ 0 - 25 , 25 - 50 , 50 - 75 , 75 - 100 , 100 - 125 , 125 - 150 , 150 - 175 , 175 - 200 , 200 - 225 , 225 - 250 , 250 - 275 , 275 - 300 , 300 - 325 , 325 - 350 , 350 - 375 , 375 - 400 , 400 - 425 , 425 - 450 , 450 - 475 , 475 - 500 | ||
| Click To Change The Sort Order: By Market Cap or Company Size Performance: Year-to-date, Week and Day | |
| Select Chart Type: | ||
|
Best Stocks Today 12Stocks.com |
© 2024 12Stocks.com Terms & Conditions Privacy Contact Us
All Information Provided Only For Education And Not To Be Used For Investing or Trading. See Terms & Conditions


One More Thing ... Get Best Stocks Delivered Daily!
Never Ever Miss A Move With Our Top Ten Stocks Lists
Find Best Stocks In Any Market - Bull or Bear Market
Take A Peek At Our Top Ten Stocks Lists: Daily, Weekly, Year-to-Date & Top Trends
Find Best Stocks In Any Market - Bull or Bear Market
Take A Peek At Our Top Ten Stocks Lists: Daily, Weekly, Year-to-Date & Top Trends
S&P 500 Stocks With Best Up Trends [0-bearish to 100-bullish]: Amgen [100], Apple [100], First Solar[100], Camden Property[100], Comerica [100], BorgWarner [100], Zions Ban[100], Teradyne [100], Extra Space[100], Fifth Third[100], Mid-America Apartment[100]
Best S&P 500 Stocks Year-to-Date:
NVIDIA [77.16%], Constellation [66.92%], NRG [48.12%], Chipotle Mexican[37.99%], Western Digital[34.49%], Micron [33.23%], Eaton [33.05%], Leidos Holdings[31.25%], Progressive [29.83%], Garmin [28.43%], Diamondback [28.35%] Best S&P 500 Stocks This Week:
Bio-Techne [19.34%], C.H. Robinson[16.15%], Amgen [16.13%], Garmin [15.09%], Moderna [15.09%], Aptiv [12.36%], Albemarle [10.87%], Amcor [10.59%], BorgWarner [9.69%], WestRock [9.1%], Leidos Holdings[8.98%] Best S&P 500 Stocks Daily:
Amgen [12.62%], Live Nation[8.46%], Enphase [6.67%], Apple [6.55%], Constellation [5.23%], Digital Realty[5.18%], Booking Holdings[5.15%], Motorola Solutions[5.04%], First Solar[4.37%], Builders FirstSource[4.21%], Arista Networks[4.10%]