
 Login Sign Up


| |||||
 |  | ||||

| 12Stocks.com Market Intelligence |
Best S&P 500 Stocks
|
On this page, you will find the most comprehensive analysis of S&P 500 stocks and ETFs - from latest trends to performances to charts ➞. First, here are the year-to-date (YTD) performances of the most requested S&P 500 stocks at 12Stocks.com (click stock for review):
| NVIDIA 74% | ||
| Merck 19% | ||
| Google 17% | ||
| Amazon.com 15% | ||
| Caterpillar 13% | ||
| Walmart 13% | ||
| JPMorgan Chase 13% | ||
| Goldman Sachs 11% | ||
| Chevron 8% | ||
| Microsoft 4% | ||
| Johnson & Johnson -8% | ||
| Starbucks -8% | ||
| McDonald s -8% | ||
| Apple -12% | ||
| Gilead -20% | ||
| Boeing -36% | ||
| Intel -39% | ||
| Quick: S&P 500 Stocks Lists: Performances & Trends, S&P 500 Stock Charts
Sort S&P 500 stocks: Daily, Weekly, Year-to-Date, Market Cap & Trends. Filter S&P 500 stocks list by sector: Show all, Tech, Finance, Energy, Staples, Retail, Industrial, Materials, Utilities and HealthCare |
| 12Stocks.com S&P 500 Stocks Performances & Trends Daily Report | |||||||||
|
| 
The overall Smart Investing & Trading Score is 41 (0-bearish to 100-bullish) which puts S&P 500 index in short term neutral trend. The Smart Investing & Trading Score from previous trading session is 78 and hence a deterioration of trend. | ||||||||
Here are the Smart Investing & Trading Scores of the most requested S&P 500 stocks at 12Stocks.com (click stock name for detailed review):
|


| 12Stocks.com: Top Performing S&P 500 Index Stocks | ||||||||||||||||||||||||||||||||||||||||||||||||
 The top performing S&P 500 Index stocks year to date are
Now, more recently, over last week, the top performing S&P 500 Index stocks on the move are


|
||||||||||||||||||||||||||||||||||||||||||||||||
| 12Stocks.com: Investing in S&P 500 Index with Stocks | |
|
The following table helps investors and traders sort through current performance and trends (as measured by Smart Investing & Trading Score) of various
stocks in the S&P 500 Index. Quick View: Move mouse or cursor over stock symbol (ticker) to view short-term technical chart and over stock name to view long term chart. Click on  to add stock symbol to your watchlist and to add stock symbol to your watchlist and  to view watchlist. Click on any ticker or stock name for detailed market intelligence report for that stock. to view watchlist. Click on any ticker or stock name for detailed market intelligence report for that stock. |
12Stocks.com Performance of Stocks in S&P 500 Index
| Ticker | Stock Name | Watchlist | Category | Recent Price | Smart Investing & Trading Score | Change % | Weekly Change% |
| CF | CF Industries |   | Materials | 78.97 | 58 | -2.30% | -1.29% |
| CEG | Constellation | | Utilities | 185.94 | 46 | -1.42% | -1.30% |
| IDXX | IDEXX | | Health Care | 492.76 | 30 | -2.49% | -1.31% |
| IQV | IQVIA Holdings | | Health Care | 231.77 | 31 | -2.01% | -1.32% |
| TECH | Bio-Techne | | Health Care | 63.21 | 42 | -2.02% | -1.33% |
| JKHY | Jack Henry | | Technology | 162.69 | 5 | -2.06% | -1.33% |
| WMT | Walmart | | Services & Goods | 59.35 | 26 | -1.48% | -1.35% |
| MTB | M&T Bank | | Financials | 144.39 | 63 | -0.78% | -1.36% |
| FSLR | First Solar | | Technology | 176.30 | 44 | -2.51% | -1.36% |
| VMC | Vulcan Materials | | Industrials | 257.63 | 51 | -1.46% | -1.38% |
| SCHW | Charles Schwab | | Financials | 73.95 | 58 | -0.82% | -1.39% |
| VFC | V.F | | Consumer Staples | 12.46 | 37 | -3.34% | -1.42% |
| KEY | KeyCorp | | Financials | 14.49 | 23 | -1.63% | -1.43% |
| GPN | Global Payments | | Services & Goods | 122.77 | 17 | -1.53% | -1.44% |
| VRSK | Verisk Analytics | | Services & Goods | 217.96 | 10 | -1.75% | -1.44% |
| CTVA | Corteva | | Materials | 54.13 | 44 | -1.80% | -1.44% |
| ABT | Abbott | | Health Care | 105.97 | 7 | -1.21% | -1.45% |
| DIS | Walt Disney | | Services & Goods | 111.10 | 48 | -0.87% | -1.45% |
| EFX | Equifax | | Financials | 220.19 | 10 | -2.36% | -1.45% |
| BK | Bank of New York | | Financials | 56.49 | 53 | -1.47% | -1.45% |
| INVH | Invitation Homes | | Financials | 34.20 | 58 | -1.10% | -1.50% |
| MRK | Merck | | Health Care | 129.22 | 58 | -0.69% | -1.51% |
| NVDA | NVIDIA | | Technology | 864.02 | 70 | -1.54% | -1.52% |
| FDX | FedEx | | Transports | 261.78 | 26 | -1.53% | -1.53% |
| MCO | Moody s | | Services & Goods | 370.33 | 0 | -1.15% | -1.54% |
| For chart view version of above stock list: Chart View ➞ 0 - 25 , 25 - 50 , 50 - 75 , 75 - 100 , 100 - 125 , 125 - 150 , 150 - 175 , 175 - 200 , 200 - 225 , 225 - 250 , 250 - 275 , 275 - 300 , 300 - 325 , 325 - 350 , 350 - 375 , 375 - 400 , 400 - 425 , 425 - 450 , 450 - 475 , 475 - 500 | ||
 | Click To Change The Sort Order: By Market Cap or Company Size Performance: Year-to-date, Week and Day |  |
|
Get the most comprehensive stock market coverage daily at 12Stocks.com ➞ Best Stocks Today ➞ Best Stocks Weekly ➞ Best Stocks Year-to-Date ➞ Best Stocks Trends ➞  Best Stocks Today 12Stocks.com Best Nasdaq Stocks ➞ Best S&P 500 Stocks ➞ Best Tech Stocks ➞ Best Biotech Stocks ➞ |
| Detailed Overview of S&P 500 Stocks |
| S&P 500 Technical Overview, Leaders & Laggards, Top S&P 500 ETF Funds & Detailed S&P 500 Stocks List, Charts, Trends & More |
| S&P 500: Technical Analysis, Trends & YTD Performance | |
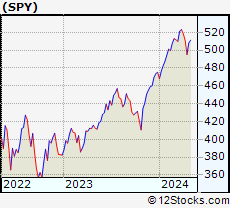
| S&P 500 index as represented by
SPY, an exchange-traded fund [ETF], holds basket of five hundred (mostly largecap) stocks from across all major sectors of the US stock market. The S&P 500 index (contains stocks like Apple and Exxon) is up by 5.61% and is currently outperforming the overall market by 0.81% year-to-date. Below is a quick view of technical charts and trends: | |
 SPY Weekly Chart |
|
| Long Term Trend: Good | |
| Medium Term Trend: Not Good | |
 SPY Daily Chart |
|
| Short Term Trend: Not Good | |
| Overall Trend Score: 41 | |
| YTD Performance: 5.61% | |
| **Trend Scores & Views Are Only For Educational Purposes And Not For Investing | |
| 12Stocks.com: Investing in S&P 500 Index using Exchange Traded Funds | |
|
The following table shows list of key exchange traded funds (ETF) that
help investors track S&P 500 index. The following list also includes leveraged ETF funds that track twice or thrice the daily returns of S&P 500 indices. Short or inverse ETF funds move in the opposite direction to the index they track and are useful during market pullbacks or during bear markets. Quick View: Move mouse or cursor over ETF symbol (ticker) to view short-term technical chart and over ETF name to view long term chart. Click on ticker or stock name for detailed view. Click on to add stock symbol to your watchlist and to view watchlist. |
12Stocks.com List of ETFs that track S&P 500 Index
| Ticker | ETF Name | Watchlist | Recent Price | Smart Investing & Trading Score | Change % | Week % | Year-to-date % |
| SPY | SPDR S&P 500 ETF | | 501.98 | 41 | -1.58 | -1.24 | 5.61% |
| IVV | iShares Core S&P 500 ETF | | 504.44 | 41 | -1.59 | -1.24 | 5.61% |
| VOO | Vanguard 500 ETF | | 461.43 | 41 | -1.58 | -1.24 | 5.64% |
| OEF | iShares S&P 100 | | 238.44 | 41 | -1.51 | -1.29 | 6.74% |
| SSO | ProShares Ultra S&P500 | | 70.87 | 41 | -3.17 | -2.53 | 8.91% |
| UPRO | ProShares UltraPro S&P500 | | 61.40 | 33 | -4.72 | -3.79 | 12.17% |
| SPXL | Direxion Daily S&P500 Bull 3X ETF | | 116.62 | 33 | -4.69 | -3.73 | 12.15% |
| SH | ProShares Short S&P500 | | 12.43 | 60 | 1.47 | 1.22 | -4.31% |
| SDS | ProShares UltraShort S&P500 | | 27.20 | 60 | 3.19 | 2.53 | -9.09% |
| SPXU | ProShares UltraPro Short S&P500 | | 36.85 | 67 | 4.78 | 3.8 | -14.3% |
| SPXS | Direxion Daily S&P 500 Bear 3X ETF | | 9.96 | 62 | 4.62 | 3.64 | -13.77% |
| 12Stocks.com: Charts, Trends, Fundamental Data and Performances of S&P 500 Stocks | |
|
We now take in-depth look at all S&P 500 stocks including charts, multi-period performances and overall trends (as measured by Smart Investing & Trading Score). One can sort S&P 500 stocks (click link to choose) by Daily, Weekly and by Year-to-Date performances. Also, one can sort by size of the company or by market capitalization. |
| Select Your Default Chart Type: | |||||
| |||||
| Click on stock symbol or name for detailed view. Click on to add stock symbol to your watchlist and to view watchlist. Quick View: Move mouse or cursor over "Daily" to quickly view daily technical stock chart and over "Weekly" to view weekly technical stock chart. | |||||

 | CF CF Industries Holdings, Inc. |
| Sector: Materials | |
| SubSector: Agricultural Chemicals | |
| MarketCap: 5581.89 Millions | |
| Recent Price: 78.97 Smart Investing & Trading Score: 58 | |
| Day Percent Change: -2.30% Day Change: -1.86 | |
| Week Change: -1.29% Year-to-date Change: -0.7% | |
| CF Links: Profile News Message Board | |
| Charts:- Daily , Weekly | |
| Add CF to Watchlist: View: Get CF Trend Analysis ➞ | |
 | CEG Constellation Energy Corporation |
| Sector: Utilities | |
| SubSector: Utilities - Renewable | |
| MarketCap: 29600 Millions | |
| Recent Price: 185.94 Smart Investing & Trading Score: 46 | |
| Day Percent Change: -1.42% Day Change: -2.67 | |
| Week Change: -1.3% Year-to-date Change: 58.8% | |
| CEG Links: Profile News Message Board | |
| Charts:- Daily , Weekly | |
| Add CEG to Watchlist: View: Get CEG Trend Analysis ➞ | |
 | IDXX IDEXX Laboratories, Inc. |
| Sector: Health Care | |
| SubSector: Diagnostic Substances | |
| MarketCap: 15937.1 Millions | |
| Recent Price: 492.76 Smart Investing & Trading Score: 30 | |
| Day Percent Change: -2.49% Day Change: -12.58 | |
| Week Change: -1.31% Year-to-date Change: -11.2% | |
| IDXX Links: Profile News Message Board | |
| Charts:- Daily , Weekly | |
| Add IDXX to Watchlist: View: Get IDXX Trend Analysis ➞ | |
 | IQV IQVIA Holdings Inc. |
| Sector: Health Care | |
| SubSector: Medical Laboratories & Research | |
| MarketCap: 19616.5 Millions | |
| Recent Price: 231.77 Smart Investing & Trading Score: 31 | |
| Day Percent Change: -2.01% Day Change: -4.76 | |
| Week Change: -1.32% Year-to-date Change: 0.2% | |
| IQV Links: Profile News Message Board | |
| Charts:- Daily , Weekly | |
| Add IQV to Watchlist: View: Get IQV Trend Analysis ➞ | |
 | TECH Bio-Techne Corporation |
| Sector: Health Care | |
| SubSector: Biotechnology | |
| MarketCap: 6958.05 Millions | |
| Recent Price: 63.21 Smart Investing & Trading Score: 42 | |
| Day Percent Change: -2.02% Day Change: -1.30 | |
| Week Change: -1.33% Year-to-date Change: -18.1% | |
| TECH Links: Profile News Message Board | |
| Charts:- Daily , Weekly | |
| Add TECH to Watchlist: View: Get TECH Trend Analysis ➞ | |
 | JKHY Jack Henry & Associates, Inc. |
| Sector: Technology | |
| SubSector: Information Technology Services | |
| MarketCap: 10695.4 Millions | |
| Recent Price: 162.69 Smart Investing & Trading Score: 5 | |
| Day Percent Change: -2.06% Day Change: -3.43 | |
| Week Change: -1.33% Year-to-date Change: -0.4% | |
| JKHY Links: Profile News Message Board | |
| Charts:- Daily , Weekly | |
| Add JKHY to Watchlist: View: Get JKHY Trend Analysis ➞ | |
 | WMT Walmart Inc. |
| Sector: Services & Goods | |
| SubSector: Discount, Variety Stores | |
| MarketCap: 355610 Millions | |
| Recent Price: 59.35 Smart Investing & Trading Score: 26 | |
| Day Percent Change: -1.48% Day Change: -0.89 | |
| Week Change: -1.35% Year-to-date Change: 12.9% | |
| WMT Links: Profile News Message Board | |
| Charts:- Daily , Weekly | |
| Add WMT to Watchlist: View: Get WMT Trend Analysis ➞ | |
 | MTB M&T Bank Corporation |
| Sector: Financials | |
| SubSector: Regional - Northeast Banks | |
| MarketCap: 13950.9 Millions | |
| Recent Price: 144.39 Smart Investing & Trading Score: 63 | |
| Day Percent Change: -0.78% Day Change: -1.13 | |
| Week Change: -1.36% Year-to-date Change: 5.3% | |
| MTB Links: Profile News Message Board | |
| Charts:- Daily , Weekly | |
| Add MTB to Watchlist: View: Get MTB Trend Analysis ➞ | |
 | FSLR First Solar, Inc. |
| Sector: Technology | |
| SubSector: Semiconductor - Specialized | |
| MarketCap: 3617.9 Millions | |
| Recent Price: 176.30 Smart Investing & Trading Score: 44 | |
| Day Percent Change: -2.51% Day Change: -4.53 | |
| Week Change: -1.36% Year-to-date Change: 2.3% | |
| FSLR Links: Profile News Message Board | |
| Charts:- Daily , Weekly | |
| Add FSLR to Watchlist: View: Get FSLR Trend Analysis ➞ | |
 | VMC Vulcan Materials Company |
| Sector: Industrials | |
| SubSector: General Building Materials | |
| MarketCap: 12304.7 Millions | |
| Recent Price: 257.63 Smart Investing & Trading Score: 51 | |
| Day Percent Change: -1.46% Day Change: -3.82 | |
| Week Change: -1.38% Year-to-date Change: 13.5% | |
| VMC Links: Profile News Message Board | |
| Charts:- Daily , Weekly | |
| Add VMC to Watchlist: View: Get VMC Trend Analysis ➞ | |
 | SCHW The Charles Schwab Corporation |
| Sector: Financials | |
| SubSector: Investment Brokerage - National | |
| MarketCap: 45115.8 Millions | |
| Recent Price: 73.95 Smart Investing & Trading Score: 58 | |
| Day Percent Change: -0.82% Day Change: -0.61 | |
| Week Change: -1.39% Year-to-date Change: 7.5% | |
| SCHW Links: Profile News Message Board | |
| Charts:- Daily , Weekly | |
| Add SCHW to Watchlist: View: Get SCHW Trend Analysis ➞ | |
 | VFC V.F. Corporation |
| Sector: Consumer Staples | |
| SubSector: Textile - Apparel Clothing | |
| MarketCap: 23607.5 Millions | |
| Recent Price: 12.46 Smart Investing & Trading Score: 37 | |
| Day Percent Change: -3.34% Day Change: -0.43 | |
| Week Change: -1.42% Year-to-date Change: -33.7% | |
| VFC Links: Profile News Message Board | |
| Charts:- Daily , Weekly | |
| Add VFC to Watchlist: View: Get VFC Trend Analysis ➞ | |
 | KEY KeyCorp |
| Sector: Financials | |
| SubSector: Regional - Midwest Banks | |
| MarketCap: 10045 Millions | |
| Recent Price: 14.49 Smart Investing & Trading Score: 23 | |
| Day Percent Change: -1.63% Day Change: -0.24 | |
| Week Change: -1.43% Year-to-date Change: 0.6% | |
| KEY Links: Profile News Message Board | |
| Charts:- Daily , Weekly | |
| Add KEY to Watchlist: View: Get KEY Trend Analysis ➞ | |
 | GPN Global Payments Inc. |
| Sector: Services & Goods | |
| SubSector: Business Services | |
| MarketCap: 39068.8 Millions | |
| Recent Price: 122.77 Smart Investing & Trading Score: 17 | |
| Day Percent Change: -1.53% Day Change: -1.91 | |
| Week Change: -1.44% Year-to-date Change: -3.3% | |
| GPN Links: Profile News Message Board | |
| Charts:- Daily , Weekly | |
| Add GPN to Watchlist: View: Get GPN Trend Analysis ➞ | |
 | VRSK Verisk Analytics, Inc. |
| Sector: Services & Goods | |
| SubSector: Business Services | |
| MarketCap: 22033.2 Millions | |
| Recent Price: 217.96 Smart Investing & Trading Score: 10 | |
| Day Percent Change: -1.75% Day Change: -3.89 | |
| Week Change: -1.44% Year-to-date Change: -8.8% | |
| VRSK Links: Profile News Message Board | |
| Charts:- Daily , Weekly | |
| Add VRSK to Watchlist: View: Get VRSK Trend Analysis ➞ | |
 | CTVA Corteva, Inc. |
| Sector: Materials | |
| SubSector: Agricultural Chemicals | |
| MarketCap: 18894.3 Millions | |
| Recent Price: 54.13 Smart Investing & Trading Score: 44 | |
| Day Percent Change: -1.80% Day Change: -0.99 | |
| Week Change: -1.44% Year-to-date Change: 13.0% | |
| CTVA Links: Profile News Message Board | |
| Charts:- Daily , Weekly | |
| Add CTVA to Watchlist: View: Get CTVA Trend Analysis ➞ | |
 | ABT Abbott Laboratories |
| Sector: Health Care | |
| SubSector: Medical Appliances & Equipment | |
| MarketCap: 125288 Millions | |
| Recent Price: 105.97 Smart Investing & Trading Score: 7 | |
| Day Percent Change: -1.21% Day Change: -1.30 | |
| Week Change: -1.45% Year-to-date Change: -3.7% | |
| ABT Links: Profile News Message Board | |
| Charts:- Daily , Weekly | |
| Add ABT to Watchlist: View: Get ABT Trend Analysis ➞ | |
 | DIS The Walt Disney Company |
| Sector: Services & Goods | |
| SubSector: Entertainment - Diversified | |
| MarketCap: 178396 Millions | |
| Recent Price: 111.10 Smart Investing & Trading Score: 48 | |
| Day Percent Change: -0.87% Day Change: -0.98 | |
| Week Change: -1.45% Year-to-date Change: 23.1% | |
| DIS Links: Profile News Message Board | |
| Charts:- Daily , Weekly | |
| Add DIS to Watchlist: View: Get DIS Trend Analysis ➞ | |
 | EFX Equifax Inc. |
| Sector: Financials | |
| SubSector: Credit Services | |
| MarketCap: 13754.6 Millions | |
| Recent Price: 220.19 Smart Investing & Trading Score: 10 | |
| Day Percent Change: -2.36% Day Change: -5.33 | |
| Week Change: -1.45% Year-to-date Change: -11.0% | |
| EFX Links: Profile News Message Board | |
| Charts:- Daily , Weekly | |
| Add EFX to Watchlist: View: Get EFX Trend Analysis ➞ | |
 | BK The Bank of New York Mellon Corporation |
| Sector: Financials | |
| SubSector: Asset Management | |
| MarketCap: 29807.5 Millions | |
| Recent Price: 56.49 Smart Investing & Trading Score: 53 | |
| Day Percent Change: -1.47% Day Change: -0.84 | |
| Week Change: -1.45% Year-to-date Change: 8.5% | |
| BK Links: Profile News Message Board | |
| Charts:- Daily , Weekly | |
| Add BK to Watchlist: View: Get BK Trend Analysis ➞ | |
 | INVH Invitation Homes Inc. |
| Sector: Financials | |
| SubSector: Real Estate Development | |
| MarketCap: 9782.89 Millions | |
| Recent Price: 34.20 Smart Investing & Trading Score: 58 | |
| Day Percent Change: -1.10% Day Change: -0.38 | |
| Week Change: -1.5% Year-to-date Change: 0.3% | |
| INVH Links: Profile News Message Board | |
| Charts:- Daily , Weekly | |
| Add INVH to Watchlist: View: Get INVH Trend Analysis ➞ | |
 | MRK Merck & Co., Inc. |
| Sector: Health Care | |
| SubSector: Drug Manufacturers - Major | |
| MarketCap: 192657 Millions | |
| Recent Price: 129.22 Smart Investing & Trading Score: 58 | |
| Day Percent Change: -0.69% Day Change: -0.90 | |
| Week Change: -1.51% Year-to-date Change: 18.5% | |
| MRK Links: Profile News Message Board | |
| Charts:- Daily , Weekly | |
| Add MRK to Watchlist: View: Get MRK Trend Analysis ➞ | |
 | NVDA NVIDIA Corporation |
| Sector: Technology | |
| SubSector: Semiconductor - Specialized | |
| MarketCap: 143476 Millions | |
| Recent Price: 864.02 Smart Investing & Trading Score: 70 | |
| Day Percent Change: -1.54% Day Change: -13.55 | |
| Week Change: -1.52% Year-to-date Change: 74.5% | |
| NVDA Links: Profile News Message Board | |
| Charts:- Daily , Weekly | |
| Add NVDA to Watchlist: View: Get NVDA Trend Analysis ➞ | |
 | FDX FedEx Corporation |
| Sector: Transports | |
| SubSector: Air Delivery & Freight Services | |
| MarketCap: 33188 Millions | |
| Recent Price: 261.78 Smart Investing & Trading Score: 26 | |
| Day Percent Change: -1.53% Day Change: -4.08 | |
| Week Change: -1.53% Year-to-date Change: 3.5% | |
| FDX Links: Profile News Message Board | |
| Charts:- Daily , Weekly | |
| Add FDX to Watchlist: View: Get FDX Trend Analysis ➞ | |
 | MCO Moody s Corporation |
| Sector: Services & Goods | |
| SubSector: Business Services | |
| MarketCap: 35998.5 Millions | |
| Recent Price: 370.33 Smart Investing & Trading Score: 0 | |
| Day Percent Change: -1.15% Day Change: -4.29 | |
| Week Change: -1.54% Year-to-date Change: -5.2% | |
| MCO Links: Profile News Message Board | |
| Charts:- Daily , Weekly | |
| Add MCO to Watchlist: View: Get MCO Trend Analysis ➞ | |
| For tabular summary view of above stock list: Summary View ➞ 0 - 25 , 25 - 50 , 50 - 75 , 75 - 100 , 100 - 125 , 125 - 150 , 150 - 175 , 175 - 200 , 200 - 225 , 225 - 250 , 250 - 275 , 275 - 300 , 300 - 325 , 325 - 350 , 350 - 375 , 375 - 400 , 400 - 425 , 425 - 450 , 450 - 475 , 475 - 500 | ||
| Click To Change The Sort Order: By Market Cap or Company Size Performance: Year-to-date, Week and Day | |
| Select Chart Type: | ||
|
Best Stocks Today 12Stocks.com |
© 2024 12Stocks.com Terms & Conditions Privacy Contact Us
All Information Provided Only For Education And Not To Be Used For Investing or Trading. See Terms & Conditions


One More Thing ... Get Best Stocks Delivered Daily!
Never Ever Miss A Move With Our Top Ten Stocks Lists
Find Best Stocks In Any Market - Bull or Bear Market
Take A Peek At Our Top Ten Stocks Lists: Daily, Weekly, Year-to-Date & Top Trends
Find Best Stocks In Any Market - Bull or Bear Market
Take A Peek At Our Top Ten Stocks Lists: Daily, Weekly, Year-to-Date & Top Trends
S&P 500 Stocks With Best Up Trends [0-bearish to 100-bullish]: Leidos Holdings[100], Corning [100], Zebra Technologies[100], 3M [100], NXP Semiconductors[100], Mosaic [100], Colgate-Palmolive [100], PayPal Holdings[100], Federal Realty[100], Public Service[100], DaVita [100]
Best S&P 500 Stocks Year-to-Date:
NVIDIA [74.47%], Constellation [58.77%], NRG [40.56%], Chipotle Mexican[38.16%], Western Digital[35.25%], Eli Lilly[34%], DaVita [32.69%], Micron [32.36%], Eaton [32.16%], Targa Resources[31.3%], Progressive [30.74%] Best S&P 500 Stocks This Week:
Tesla [8.91%], Leidos Holdings[7.56%], Corning [6.54%], Eli Lilly[6.49%], Domino s[6.05%], Zebra Technologies[5.84%], NXP Semiconductors[5.56%], 3M [5.1%], Cincinnati Financial[4.34%], Hershey [4.17%], DaVita [4.12%] Best S&P 500 Stocks Daily:
Leidos Holdings[6.53%], Eli Lilly[5.95%], Corning [5.03%], Zebra Technologies[4.85%], ProShares UltraPro[4.78%], 3M [4.72%], NXP Semiconductors[3.67%], Arch Capital[2.51%], Ecolab [2.02%], Cincinnati Financial[1.88%], Campbell Soup[1.74%]