
 Login Sign Up


| |||||
 |  | ||||

| 12Stocks.com Market Intelligence |
Best S&P 500 Stocks
|
On this page, you will find the most comprehensive analysis of S&P 500 stocks and ETFs - from latest trends to performances to charts ➞. First, here are the year-to-date (YTD) performances of the most requested S&P 500 stocks at 12Stocks.com (click stock for review):
| NVIDIA 75% | ||
| Merck 19% | ||
| Google 17% | ||
| Amazon.com 16% | ||
| Caterpillar 13% | ||
| Walmart 13% | ||
| JPMorgan Chase 13% | ||
| Goldman Sachs 11% | ||
| Chevron 8% | ||
| Microsoft 4% | ||
| Johnson & Johnson -8% | ||
| Starbucks -8% | ||
| McDonald s -8% | ||
| Apple -12% | ||
| Gilead -20% | ||
| Boeing -36% | ||
| Intel -39% | ||
| Quick: S&P 500 Stocks Lists: Performances & Trends, S&P 500 Stock Charts
Sort S&P 500 stocks: Daily, Weekly, Year-to-Date, Market Cap & Trends. Filter S&P 500 stocks list by sector: Show all, Tech, Finance, Energy, Staples, Retail, Industrial, Materials, Utilities and HealthCare |
| 12Stocks.com S&P 500 Stocks Performances & Trends Daily Report | |||||||||
|
| 
The overall Smart Investing & Trading Score is 51 (0-bearish to 100-bullish) which puts S&P 500 index in short term neutral trend. The Smart Investing & Trading Score from previous trading session is 78 and hence a deterioration of trend. | ||||||||
Here are the Smart Investing & Trading Scores of the most requested S&P 500 stocks at 12Stocks.com (click stock name for detailed review):
|


| 12Stocks.com: Top Performing S&P 500 Index Stocks | ||||||||||||||||||||||||||||||||||||||||||||||||
 The top performing S&P 500 Index stocks year to date are
Now, more recently, over last week, the top performing S&P 500 Index stocks on the move are


|
||||||||||||||||||||||||||||||||||||||||||||||||
| 12Stocks.com: Investing in S&P 500 Index with Stocks | |
|
The following table helps investors and traders sort through current performance and trends (as measured by Smart Investing & Trading Score) of various
stocks in the S&P 500 Index. Quick View: Move mouse or cursor over stock symbol (ticker) to view short-term technical chart and over stock name to view long term chart. Click on  to add stock symbol to your watchlist and to add stock symbol to your watchlist and  to view watchlist. Click on any ticker or stock name for detailed market intelligence report for that stock. to view watchlist. Click on any ticker or stock name for detailed market intelligence report for that stock. |
12Stocks.com Performance of Stocks in S&P 500 Index
| Ticker | Stock Name | Watchlist | Category | Recent Price | Smart Investing & Trading Score | Change % | Weekly Change% |
| GWW | W.W. Grainger |   | Services & Goods | 921.35 | 36 | -1.41% | -0.85% |
| CMG | Chipotle Mexican | | Services & Goods | 3159.60 | 83 | -1.55% | -0.86% |
| COST | Costco Wholesale | | Services & Goods | 722.79 | 41 | -0.49% | -0.88% |
| EBAY | eBay | | Services & Goods | 51.56 | 73 | -2.26% | -0.88% |
| TDG | TransDigm | | Industrials | 1248.03 | 61 | -0.85% | -0.88% |
| PPG | PPG Industries | | Materials | 129.00 | 18 | -1.33% | -0.89% |
| JPM | JPMorgan Chase | | Financials | 191.74 | 66 | -0.80% | -0.90% |
| FTV | Fortive | | Technology | 75.27 | 25 | -2.25% | -0.92% |
| PAYX | Paychex | | Services & Goods | 118.84 | 0 | -1.63% | -0.94% |
| BG | Bunge | | Consumer Staples | 101.76 | 36 | -1.66% | -0.94% |
| J | Jacobs Engineering | | Services & Goods | 143.53 | 78 | -1.59% | -0.95% |
| CAG | Conagra Brands | | Consumer Staples | 30.78 | 63 | -0.52% | -0.97% |
| WFC | Wells Fargo | | Financials | 59.32 | 59 | -0.80% | -0.98% |
| AVB | AvalonBay Communities | | Financials | 189.57 | 76 | -0.76% | -0.98% |
| WM | Waste Management | | Industrials | 208.02 | 58 | -1.95% | -0.99% |
| HPE | Hewlett Packard | | Technology | 17.00 | 68 | -1.05% | -0.99% |
| SNA | Snap-on | | Industrials | 267.96 | 18 | -1.58% | -1.01% |
| LYV | Live Nation | | Services & Goods | 88.91 | 51 | -1.80% | -1.02% |
| EPAM | EPAM Systems | | Technology | 235.26 | 20 | -1.65% | -1.05% |
| JNJ | Johnson & Johnson | | Health Care | 144.59 | 0 | -1.52% | -1.06% |
| AON | Aon | | Financials | 282.01 | 7 | 0.35% | -1.06% |
| BLK | BlackRock | | Financials | 754.64 | 18 | -0.87% | -1.08% |
| LKQ | LKQ | | Consumer Staples | 43.17 | 25 | -1.35% | -1.08% |
| OTIS | Otis Worldwide | | Industrials | 91.20 | 26 | -2.32% | -1.08% |
| FDS | FactSet Research | | Technology | 416.89 | 18 | -1.43% | -1.09% |
| For chart view version of above stock list: Chart View ➞ 0 - 25 , 25 - 50 , 50 - 75 , 75 - 100 , 100 - 125 , 125 - 150 , 150 - 175 , 175 - 200 , 200 - 225 , 225 - 250 , 250 - 275 , 275 - 300 , 300 - 325 , 325 - 350 , 350 - 375 , 375 - 400 , 400 - 425 , 425 - 450 , 450 - 475 , 475 - 500 | ||
 | Click To Change The Sort Order: By Market Cap or Company Size Performance: Year-to-date, Week and Day |  |
|
Get the most comprehensive stock market coverage daily at 12Stocks.com ➞ Best Stocks Today ➞ Best Stocks Weekly ➞ Best Stocks Year-to-Date ➞ Best Stocks Trends ➞  Best Stocks Today 12Stocks.com Best Nasdaq Stocks ➞ Best S&P 500 Stocks ➞ Best Tech Stocks ➞ Best Biotech Stocks ➞ |
| Detailed Overview of S&P 500 Stocks |
| S&P 500 Technical Overview, Leaders & Laggards, Top S&P 500 ETF Funds & Detailed S&P 500 Stocks List, Charts, Trends & More |
| S&P 500: Technical Analysis, Trends & YTD Performance | |
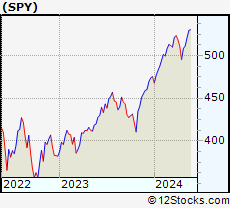
| S&P 500 index as represented by
SPY, an exchange-traded fund [ETF], holds basket of five hundred (mostly largecap) stocks from across all major sectors of the US stock market. The S&P 500 index (contains stocks like Apple and Exxon) is up by 5.61% and is currently outperforming the overall market by 0.81% year-to-date. Below is a quick view of technical charts and trends: | |
 SPY Weekly Chart |
|
| Long Term Trend: Good | |
| Medium Term Trend: Not Good | |
 SPY Daily Chart |
|
| Short Term Trend: Very Good | |
| Overall Trend Score: 51 | |
| YTD Performance: 5.61% | |
| **Trend Scores & Views Are Only For Educational Purposes And Not For Investing | |
| 12Stocks.com: Investing in S&P 500 Index using Exchange Traded Funds | |
|
The following table shows list of key exchange traded funds (ETF) that
help investors track S&P 500 index. The following list also includes leveraged ETF funds that track twice or thrice the daily returns of S&P 500 indices. Short or inverse ETF funds move in the opposite direction to the index they track and are useful during market pullbacks or during bear markets. Quick View: Move mouse or cursor over ETF symbol (ticker) to view short-term technical chart and over ETF name to view long term chart. Click on ticker or stock name for detailed view. Click on to add stock symbol to your watchlist and to view watchlist. |
12Stocks.com List of ETFs that track S&P 500 Index
| Ticker | ETF Name | Watchlist | Recent Price | Smart Investing & Trading Score | Change % | Week % | Year-to-date % |
| SPY | SPDR S&P 500 ETF | | 501.98 | 51 | -1.58 | -1.24 | 5.61% |
| IVV | iShares Core S&P 500 ETF | | 504.70 | 71 | -1.54 | -1.19 | 5.67% |
| VOO | Vanguard 500 ETF | | 461.59 | 71 | -1.55 | -1.2 | 5.68% |
| OEF | iShares S&P 100 | | 238.44 | 51 | -1.51 | -1.29 | 6.74% |
| SSO | ProShares Ultra S&P500 | | 70.87 | 51 | -3.17 | -2.53 | 8.91% |
| UPRO | ProShares UltraPro S&P500 | | 61.40 | 58 | -4.72 | -3.79 | 12.17% |
| SPXL | Direxion Daily S&P500 Bull 3X ETF | | 116.70 | 63 | -4.63 | -3.67 | 12.22% |
| SH | ProShares Short S&P500 | | 12.43 | 60 | 1.47 | 1.22 | -4.31% |
| SDS | ProShares UltraShort S&P500 | | 27.20 | 50 | 3.19 | 2.53 | -9.09% |
| SPXU | ProShares UltraPro Short S&P500 | | 36.85 | 42 | 4.78 | 3.8 | -14.3% |
| SPXS | Direxion Daily S&P 500 Bear 3X ETF | | 9.96 | 32 | 4.57 | 3.59 | -13.81% |
| 12Stocks.com: Charts, Trends, Fundamental Data and Performances of S&P 500 Stocks | |
|
We now take in-depth look at all S&P 500 stocks including charts, multi-period performances and overall trends (as measured by Smart Investing & Trading Score). One can sort S&P 500 stocks (click link to choose) by Daily, Weekly and by Year-to-Date performances. Also, one can sort by size of the company or by market capitalization. |
| Select Your Default Chart Type: | |||||
| |||||
| Click on stock symbol or name for detailed view. Click on to add stock symbol to your watchlist and to view watchlist. Quick View: Move mouse or cursor over "Daily" to quickly view daily technical stock chart and over "Weekly" to view weekly technical stock chart. | |||||

 | GWW W.W. Grainger, Inc. |
| Sector: Services & Goods | |
| SubSector: Industrial Equipment Wholesale | |
| MarketCap: 12794.8 Millions | |
| Recent Price: 921.35 Smart Investing & Trading Score: 36 | |
| Day Percent Change: -1.41% Day Change: -13.15 | |
| Week Change: -0.85% Year-to-date Change: 11.2% | |
| GWW Links: Profile News Message Board | |
| Charts:- Daily , Weekly | |
| Add GWW to Watchlist: View: Get GWW Trend Analysis ➞ | |
 | CMG Chipotle Mexican Grill, Inc. |
| Sector: Services & Goods | |
| SubSector: Restaurants | |
| MarketCap: 16849.9 Millions | |
| Recent Price: 3159.60 Smart Investing & Trading Score: 83 | |
| Day Percent Change: -1.55% Day Change: -49.87 | |
| Week Change: -0.86% Year-to-date Change: 38.2% | |
| CMG Links: Profile News Message Board | |
| Charts:- Daily , Weekly | |
| Add CMG to Watchlist: View: Get CMG Trend Analysis ➞ | |
 | COST Costco Wholesale Corporation |
| Sector: Services & Goods | |
| SubSector: Discount, Variety Stores | |
| MarketCap: 136355 Millions | |
| Recent Price: 722.79 Smart Investing & Trading Score: 41 | |
| Day Percent Change: -0.49% Day Change: -3.54 | |
| Week Change: -0.88% Year-to-date Change: 9.5% | |
| COST Links: Profile News Message Board | |
| Charts:- Daily , Weekly | |
| Add COST to Watchlist: View: Get COST Trend Analysis ➞ | |
 | EBAY eBay Inc. |
| Sector: Services & Goods | |
| SubSector: Specialty Retail, Other | |
| MarketCap: 23152.3 Millions | |
| Recent Price: 51.56 Smart Investing & Trading Score: 73 | |
| Day Percent Change: -2.26% Day Change: -1.19 | |
| Week Change: -0.88% Year-to-date Change: 18.2% | |
| EBAY Links: Profile News Message Board | |
| Charts:- Daily , Weekly | |
| Add EBAY to Watchlist: View: Get EBAY Trend Analysis ➞ | |
 | TDG TransDigm Group Incorporated |
| Sector: Industrials | |
| SubSector: Aerospace/Defense Products & Services | |
| MarketCap: 18441 Millions | |
| Recent Price: 1248.03 Smart Investing & Trading Score: 61 | |
| Day Percent Change: -0.85% Day Change: -10.69 | |
| Week Change: -0.88% Year-to-date Change: 23.4% | |
| TDG Links: Profile News Message Board | |
| Charts:- Daily , Weekly | |
| Add TDG to Watchlist: View: Get TDG Trend Analysis ➞ | |
 | PPG PPG Industries, Inc. |
| Sector: Materials | |
| SubSector: Specialty Chemicals | |
| MarketCap: 20285.5 Millions | |
| Recent Price: 129.00 Smart Investing & Trading Score: 18 | |
| Day Percent Change: -1.33% Day Change: -1.74 | |
| Week Change: -0.89% Year-to-date Change: -13.7% | |
| PPG Links: Profile News Message Board | |
| Charts:- Daily , Weekly | |
| Add PPG to Watchlist: View: Get PPG Trend Analysis ➞ | |
 | JPM JPMorgan Chase & Co. |
| Sector: Financials | |
| SubSector: Money Center Banks | |
| MarketCap: 279736 Millions | |
| Recent Price: 191.74 Smart Investing & Trading Score: 66 | |
| Day Percent Change: -0.80% Day Change: -1.54 | |
| Week Change: -0.9% Year-to-date Change: 12.7% | |
| JPM Links: Profile News Message Board | |
| Charts:- Daily , Weekly | |
| Add JPM to Watchlist: View: Get JPM Trend Analysis ➞ | |
 | FTV Fortive Corporation |
| Sector: Technology | |
| SubSector: Scientific & Technical Instruments | |
| MarketCap: 16351.9 Millions | |
| Recent Price: 75.27 Smart Investing & Trading Score: 25 | |
| Day Percent Change: -2.25% Day Change: -1.73 | |
| Week Change: -0.92% Year-to-date Change: 2.2% | |
| FTV Links: Profile News Message Board | |
| Charts:- Daily , Weekly | |
| Add FTV to Watchlist: View: Get FTV Trend Analysis ➞ | |
 | PAYX Paychex, Inc. |
| Sector: Services & Goods | |
| SubSector: Staffing & Outsourcing Services | |
| MarketCap: 20928.8 Millions | |
| Recent Price: 118.84 Smart Investing & Trading Score: 0 | |
| Day Percent Change: -1.63% Day Change: -1.97 | |
| Week Change: -0.94% Year-to-date Change: -0.2% | |
| PAYX Links: Profile News Message Board | |
| Charts:- Daily , Weekly | |
| Add PAYX to Watchlist: View: Get PAYX Trend Analysis ➞ | |
 | BG Bunge Limited |
| Sector: Consumer Staples | |
| SubSector: Farm Products | |
| MarketCap: 4975.77 Millions | |
| Recent Price: 101.76 Smart Investing & Trading Score: 36 | |
| Day Percent Change: -1.66% Day Change: -1.72 | |
| Week Change: -0.94% Year-to-date Change: 0.8% | |
| BG Links: Profile News Message Board | |
| Charts:- Daily , Weekly | |
| Add BG to Watchlist: View: Get BG Trend Analysis ➞ | |
 | J Jacobs Engineering Group Inc. |
| Sector: Services & Goods | |
| SubSector: Technical Services | |
| MarketCap: 9714.8 Millions | |
| Recent Price: 143.53 Smart Investing & Trading Score: 78 | |
| Day Percent Change: -1.59% Day Change: -2.32 | |
| Week Change: -0.95% Year-to-date Change: 10.6% | |
| J Links: Profile News Message Board | |
| Charts:- Daily , Weekly | |
| Add J to Watchlist: View: Get J Trend Analysis ➞ | |
 | CAG Conagra Brands, Inc. |
| Sector: Consumer Staples | |
| SubSector: Processed & Packaged Goods | |
| MarketCap: 14084.1 Millions | |
| Recent Price: 30.78 Smart Investing & Trading Score: 63 | |
| Day Percent Change: -0.52% Day Change: -0.16 | |
| Week Change: -0.97% Year-to-date Change: 7.4% | |
| CAG Links: Profile News Message Board | |
| Charts:- Daily , Weekly | |
| Add CAG to Watchlist: View: Get CAG Trend Analysis ➞ | |
 | WFC Wells Fargo & Company |
| Sector: Financials | |
| SubSector: Money Center Banks | |
| MarketCap: 129138 Millions | |
| Recent Price: 59.32 Smart Investing & Trading Score: 59 | |
| Day Percent Change: -0.80% Day Change: -0.48 | |
| Week Change: -0.98% Year-to-date Change: 20.5% | |
| WFC Links: Profile News Message Board | |
| Charts:- Daily , Weekly | |
| Add WFC to Watchlist: View: Get WFC Trend Analysis ➞ | |
 | AVB AvalonBay Communities, Inc. |
| Sector: Financials | |
| SubSector: REIT - Residential | |
| MarketCap: 19921.9 Millions | |
| Recent Price: 189.57 Smart Investing & Trading Score: 76 | |
| Day Percent Change: -0.76% Day Change: -1.45 | |
| Week Change: -0.98% Year-to-date Change: 1.3% | |
| AVB Links: Profile News Message Board | |
| Charts:- Daily , Weekly | |
| Add AVB to Watchlist: View: Get AVB Trend Analysis ➞ | |
 | WM Waste Management, Inc. |
| Sector: Industrials | |
| SubSector: Waste Management | |
| MarketCap: 46977.4 Millions | |
| Recent Price: 208.02 Smart Investing & Trading Score: 58 | |
| Day Percent Change: -1.95% Day Change: -4.13 | |
| Week Change: -0.99% Year-to-date Change: 16.2% | |
| WM Links: Profile News Message Board | |
| Charts:- Daily , Weekly | |
| Add WM to Watchlist: View: Get WM Trend Analysis ➞ | |
 | HPE Hewlett Packard Enterprise Company |
| Sector: Technology | |
| SubSector: Communication Equipment | |
| MarketCap: 12886.1 Millions | |
| Recent Price: 17.00 Smart Investing & Trading Score: 68 | |
| Day Percent Change: -1.05% Day Change: -0.18 | |
| Week Change: -0.99% Year-to-date Change: 0.1% | |
| HPE Links: Profile News Message Board | |
| Charts:- Daily , Weekly | |
| Add HPE to Watchlist: View: Get HPE Trend Analysis ➞ | |
 | SNA Snap-on Incorporated |
| Sector: Industrials | |
| SubSector: Small Tools & Accessories | |
| MarketCap: 5947.26 Millions | |
| Recent Price: 267.96 Smart Investing & Trading Score: 18 | |
| Day Percent Change: -1.58% Day Change: -4.29 | |
| Week Change: -1.01% Year-to-date Change: -7.2% | |
| SNA Links: Profile News Message Board | |
| Charts:- Daily , Weekly | |
| Add SNA to Watchlist: View: Get SNA Trend Analysis ➞ | |
 | LYV Live Nation Entertainment, Inc. |
| Sector: Services & Goods | |
| SubSector: Entertainment - Diversified | |
| MarketCap: 8457.17 Millions | |
| Recent Price: 88.91 Smart Investing & Trading Score: 51 | |
| Day Percent Change: -1.80% Day Change: -1.63 | |
| Week Change: -1.02% Year-to-date Change: -5.0% | |
| LYV Links: Profile News Message Board | |
| Charts:- Daily , Weekly | |
| Add LYV to Watchlist: View: Get LYV Trend Analysis ➞ | |
 | EPAM EPAM Systems, Inc. |
| Sector: Technology | |
| SubSector: Information Technology Services | |
| MarketCap: 11519.6 Millions | |
| Recent Price: 235.26 Smart Investing & Trading Score: 20 | |
| Day Percent Change: -1.65% Day Change: -3.95 | |
| Week Change: -1.05% Year-to-date Change: -20.9% | |
| EPAM Links: Profile News Message Board | |
| Charts:- Daily , Weekly | |
| Add EPAM to Watchlist: View: Get EPAM Trend Analysis ➞ | |
 | JNJ Johnson & Johnson |
| Sector: Health Care | |
| SubSector: Drug Manufacturers - Major | |
| MarketCap: 331972 Millions | |
| Recent Price: 144.59 Smart Investing & Trading Score: 0 | |
| Day Percent Change: -1.52% Day Change: -2.23 | |
| Week Change: -1.06% Year-to-date Change: -7.8% | |
| JNJ Links: Profile News Message Board | |
| Charts:- Daily , Weekly | |
| Add JNJ to Watchlist: View: Get JNJ Trend Analysis ➞ | |
 | AON Aon plc |
| Sector: Financials | |
| SubSector: Insurance Brokers | |
| MarketCap: 36870.1 Millions | |
| Recent Price: 282.01 Smart Investing & Trading Score: 7 | |
| Day Percent Change: 0.35% Day Change: 0.97 | |
| Week Change: -1.06% Year-to-date Change: -3.1% | |
| AON Links: Profile News Message Board | |
| Charts:- Daily , Weekly | |
| Add AON to Watchlist: View: Get AON Trend Analysis ➞ | |
 | BLK BlackRock, Inc. |
| Sector: Financials | |
| SubSector: Asset Management | |
| MarketCap: 61284.9 Millions | |
| Recent Price: 754.64 Smart Investing & Trading Score: 18 | |
| Day Percent Change: -0.87% Day Change: -6.64 | |
| Week Change: -1.08% Year-to-date Change: -7.0% | |
| BLK Links: Profile News Message Board | |
| Charts:- Daily , Weekly | |
| Add BLK to Watchlist: View: Get BLK Trend Analysis ➞ | |
 | LKQ LKQ Corporation |
| Sector: Consumer Staples | |
| SubSector: Auto Parts | |
| MarketCap: 5633.79 Millions | |
| Recent Price: 43.17 Smart Investing & Trading Score: 25 | |
| Day Percent Change: -1.35% Day Change: -0.59 | |
| Week Change: -1.08% Year-to-date Change: -9.7% | |
| LKQ Links: Profile News Message Board | |
| Charts:- Daily , Weekly | |
| Add LKQ to Watchlist: View: Get LKQ Trend Analysis ➞ | |
 | OTIS Otis Worldwide Corporation |
| Sector: Industrials | |
| SubSector: Specialty Industrial Machinery | |
| MarketCap: 27727 Millions | |
| Recent Price: 91.20 Smart Investing & Trading Score: 26 | |
| Day Percent Change: -2.32% Day Change: -2.17 | |
| Week Change: -1.08% Year-to-date Change: 1.9% | |
| OTIS Links: Profile News Message Board | |
| Charts:- Daily , Weekly | |
| Add OTIS to Watchlist: View: Get OTIS Trend Analysis ➞ | |
 | FDS FactSet Research Systems Inc. |
| Sector: Technology | |
| SubSector: Information & Delivery Services | |
| MarketCap: 9024.37 Millions | |
| Recent Price: 416.89 Smart Investing & Trading Score: 18 | |
| Day Percent Change: -1.43% Day Change: -6.05 | |
| Week Change: -1.09% Year-to-date Change: -12.6% | |
| FDS Links: Profile News Message Board | |
| Charts:- Daily , Weekly | |
| Add FDS to Watchlist: View: Get FDS Trend Analysis ➞ | |
| For tabular summary view of above stock list: Summary View ➞ 0 - 25 , 25 - 50 , 50 - 75 , 75 - 100 , 100 - 125 , 125 - 150 , 150 - 175 , 175 - 200 , 200 - 225 , 225 - 250 , 250 - 275 , 275 - 300 , 300 - 325 , 325 - 350 , 350 - 375 , 375 - 400 , 400 - 425 , 425 - 450 , 450 - 475 , 475 - 500 | ||
| Click To Change The Sort Order: By Market Cap or Company Size Performance: Year-to-date, Week and Day | |
| Select Chart Type: | ||
|
Best Stocks Today 12Stocks.com |
© 2024 12Stocks.com Terms & Conditions Privacy Contact Us
All Information Provided Only For Education And Not To Be Used For Investing or Trading. See Terms & Conditions


One More Thing ... Get Best Stocks Delivered Daily!
Never Ever Miss A Move With Our Top Ten Stocks Lists
Find Best Stocks In Any Market - Bull or Bear Market
Take A Peek At Our Top Ten Stocks Lists: Daily, Weekly, Year-to-Date & Top Trends
Find Best Stocks In Any Market - Bull or Bear Market
Take A Peek At Our Top Ten Stocks Lists: Daily, Weekly, Year-to-Date & Top Trends
S&P 500 Stocks With Best Up Trends [0-bearish to 100-bullish]: Leidos Holdings[100], Corning [100], Zebra Technologies[100], 3M [100], NXP Semiconductors[100], Campbell Soup[100], Mosaic [100], Colgate-Palmolive [100], PayPal Holdings[100], Federal Realty[100], Hershey [100]
Best S&P 500 Stocks Year-to-Date:
NVIDIA [74.5%], Constellation [58.77%], NRG [40.56%], Chipotle Mexican[38.16%], Western Digital[35.42%], Eli Lilly[34%], DaVita [32.69%], Micron [32.41%], Eaton [32.16%], Targa Resources[31.3%], Progressive [30.74%] Best S&P 500 Stocks This Week:
Tesla [8.94%], Leidos Holdings[7.56%], Corning [6.54%], Eli Lilly[6.49%], Domino s[6.05%], Zebra Technologies[5.76%], NXP Semiconductors[5.5%], 3M [5.1%], Cincinnati Financial[4.31%], Hershey [4.17%], DaVita [4.12%] Best S&P 500 Stocks Daily:
Leidos Holdings[6.53%], Eli Lilly[5.95%], Corning [5.03%], Zebra Technologies[4.78%], ProShares UltraPro[4.78%], 3M [4.72%], NXP Semiconductors[3.61%], Arch Capital[2.49%], Ecolab [2.02%], Cincinnati Financial[1.86%], Campbell Soup[1.74%]