
 Login Sign Up


| |||||
 |  | ||||

| 12Stocks.com Market Intelligence |
Best S&P 500 Stocks
|
On this page, you will find the most comprehensive analysis of S&P 500 stocks and ETFs - from latest trends to performances to charts ➞. First, here are the year-to-date (YTD) performances of the most requested S&P 500 stocks at 12Stocks.com (click stock for review):
| NVIDIA 67% | ||
| Merck 20% | ||
| Walmart 15% | ||
| Caterpillar 14% | ||
| Amazon.com 14% | ||
| JPMorgan Chase 14% | ||
| Google 12% | ||
| Chevron 11% | ||
| Goldman Sachs 9% | ||
| Microsoft 6% | ||
| Johnson & Johnson -6% | ||
| McDonald s -7% | ||
| Starbucks -9% | ||
| Apple -12% | ||
| Gilead -19% | ||
| Intel -30% | ||
| Boeing -36% | ||
| Quick: S&P 500 Stocks Lists: Performances & Trends, S&P 500 Stock Charts
Sort S&P 500 stocks: Daily, Weekly, Year-to-Date, Market Cap & Trends. Filter S&P 500 stocks list by sector: Show all, Tech, Finance, Energy, Staples, Retail, Industrial, Materials, Utilities and HealthCare |
| 12Stocks.com S&P 500 Stocks Performances & Trends Daily Report | |||||||||
|
| 
The overall Smart Investing & Trading Score is 44 (0-bearish to 100-bullish) which puts S&P 500 index in short term neutral trend. The Smart Investing & Trading Score from previous trading session is 58 and hence a deterioration of trend. | ||||||||
Here are the Smart Investing & Trading Scores of the most requested S&P 500 stocks at 12Stocks.com (click stock name for detailed review):
|


| 12Stocks.com: Top Performing S&P 500 Index Stocks | ||||||||||||||||||||||||||||||||||||||||||||||||
 The top performing S&P 500 Index stocks year to date are
Now, more recently, over last week, the top performing S&P 500 Index stocks on the move are


|
||||||||||||||||||||||||||||||||||||||||||||||||
| 12Stocks.com: Investing in S&P 500 Index with Stocks | |
|
The following table helps investors and traders sort through current performance and trends (as measured by Smart Investing & Trading Score) of various
stocks in the S&P 500 Index. Quick View: Move mouse or cursor over stock symbol (ticker) to view short-term technical chart and over stock name to view long term chart. Click on  to add stock symbol to your watchlist and to add stock symbol to your watchlist and  to view watchlist. Click on any ticker or stock name for detailed market intelligence report for that stock. to view watchlist. Click on any ticker or stock name for detailed market intelligence report for that stock. |
12Stocks.com Performance of Stocks in S&P 500 Index
| Ticker | Stock Name | Watchlist | Category | Recent Price | Smart Investing & Trading Score | Change % | Weekly Change% |
| KMB | Kimberly-Clark |   | Consumer Staples | 136.43 | 100 | -0.98% | 7.57% |
| CCL | Carnival | | Services & Goods | 15.18 | 57 | 1.13% | 7.51% |
| KDP | Keurig Dr | | Consumer Staples | 33.87 | 80 | 4.73% | 7.49% |
| AVGO | Broadcom | | Technology | 1294.42 | 58 | 2.99% | 7.45% |
| SYF | Synchrony Financial | | Financials | 44.66 | 100 | -0.80% | 7.43% |
| F | Ford Motor | | Consumer Staples | 13.04 | 61 | 0.69% | 7.41% |
| CSGP | CoStar | | Financials | 90.34 | 80 | -1.75% | 7.22% |
| KLAC | KLA | | Technology | 672.95 | 63 | 2.50% | 7.13% |
| SWKS | Skyworks Solutions | | Technology | 102.95 | 47 | 1.81% | 7.12% |
| RCL | Royal Caribbean | | Services & Goods | 137.47 | 95 | 0.54% | 6.39% |
| STX | Seagate | | Technology | 87.26 | 68 | 0.17% | 5.82% |
| TDG | TransDigm | | Industrials | 1256.58 | 95 | 1.20% | 5.80% |
| NCLH | Norwegian Cruise | | Services & Goods | 19.35 | 83 | -0.21% | 5.80% |
| FICO | Fair Isaac | | Technology | 1193.66 | 55 | 0.05% | 5.63% |
| PHM | Pulte | | Industrials | 111.36 | 58 | -0.80% | 5.62% |
| EXPE | Expedia | | Services & Goods | 136.25 | 57 | 0.33% | 5.62% |
| DXCM | DexCom | | Health Care | 138.01 | 80 | 0.10% | 5.58% |
| NOC | Northrop Grumman | | Industrials | 488.06 | 100 | 2.84% | 5.51% |
| DOV | Dover | | Industrials | 179.11 | 100 | 4.47% | 5.46% |
| EQR | Equity Residential | | Financials | 64.88 | 100 | 0.42% | 5.43% |
| DGX | Quest Diagnostics | | Health Care | 135.42 | 93 | -1.55% | 5.43% |
| RL | Ralph Lauren | | Consumer Staples | 166.93 | 58 | -0.76% | 5.35% |
| WDC | Western Digital | | Technology | 69.44 | 61 | -0.16% | 5.13% |
| ESS | Essex Property | | Financials | 247.21 | 100 | -0.21% | 5.12% |
| TMO | Thermo Fisher | | Health Care | 571.73 | 75 | -0.98% | 4.95% |
| For chart view version of above stock list: Chart View ➞ 0 - 25 , 25 - 50 , 50 - 75 , 75 - 100 , 100 - 125 , 125 - 150 , 150 - 175 , 175 - 200 , 200 - 225 , 225 - 250 , 250 - 275 , 275 - 300 , 300 - 325 , 325 - 350 , 350 - 375 , 375 - 400 , 400 - 425 , 425 - 450 , 450 - 475 , 475 - 500 | ||
 | Click To Change The Sort Order: By Market Cap or Company Size Performance: Year-to-date, Week and Day |  |
|
Get the most comprehensive stock market coverage daily at 12Stocks.com ➞ Best Stocks Today ➞ Best Stocks Weekly ➞ Best Stocks Year-to-Date ➞ Best Stocks Trends ➞  Best Stocks Today 12Stocks.com Best Nasdaq Stocks ➞ Best S&P 500 Stocks ➞ Best Tech Stocks ➞ Best Biotech Stocks ➞ |
| Detailed Overview of S&P 500 Stocks |
| S&P 500 Technical Overview, Leaders & Laggards, Top S&P 500 ETF Funds & Detailed S&P 500 Stocks List, Charts, Trends & More |
| S&P 500: Technical Analysis, Trends & YTD Performance | |
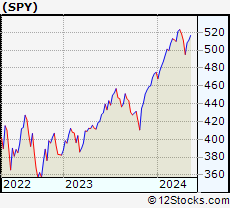
| S&P 500 index as represented by
SPY, an exchange-traded fund [ETF], holds basket of five hundred (mostly largecap) stocks from across all major sectors of the US stock market. The S&P 500 index (contains stocks like Apple and Exxon) is up by 5.93% and is currently outperforming the overall market by 0.77% year-to-date. Below is a quick view of technical charts and trends: | |
 SPY Weekly Chart |
|
| Long Term Trend: Good | |
| Medium Term Trend: Not Good | |
 SPY Daily Chart |
|
| Short Term Trend: Very Good | |
| Overall Trend Score: 44 | |
| YTD Performance: 5.93% | |
| **Trend Scores & Views Are Only For Educational Purposes And Not For Investing | |
| 12Stocks.com: Investing in S&P 500 Index using Exchange Traded Funds | |
|
The following table shows list of key exchange traded funds (ETF) that
help investors track S&P 500 index. The following list also includes leveraged ETF funds that track twice or thrice the daily returns of S&P 500 indices. Short or inverse ETF funds move in the opposite direction to the index they track and are useful during market pullbacks or during bear markets. Quick View: Move mouse or cursor over ETF symbol (ticker) to view short-term technical chart and over ETF name to view long term chart. Click on ticker or stock name for detailed view. Click on to add stock symbol to your watchlist and to view watchlist. |
12Stocks.com List of ETFs that track S&P 500 Index
| Ticker | ETF Name | Watchlist | Recent Price | Smart Investing & Trading Score | Change % | Week % | Year-to-date % |
| SPY | SPDR S&P 500 ETF | | 503.49 | 44 | -0.38 | 1.68 | 5.93% |
| IVV | iShares Core S&P 500 ETF | | 505.82 | 56 | -0.42 | 1.67 | 5.9% |
| VOO | Vanguard 500 ETF | | 462.58 | 56 | -0.41 | 1.64 | 5.9% |
| OEF | iShares S&P 100 | | 238.34 | 44 | -0.60 | 1.56 | 6.69% |
| SSO | ProShares Ultra S&P500 | | 71.32 | 51 | -0.88 | 3.2 | 9.61% |
| UPRO | ProShares UltraPro S&P500 | | 62.03 | 51 | -1.35 | 4.85 | 13.32% |
| SPXL | Direxion Daily S&P500 Bull 3X ETF | | 117.84 | 56 | -1.27 | 4.7 | 13.32% |
| SH | ProShares Short S&P500 | | 12.39 | 57 | 0.49 | -1.59 | -4.62% |
| SDS | ProShares UltraShort S&P500 | | 27.04 | 49 | 0.90 | -3.08 | -9.63% |
| SPXU | ProShares UltraPro Short S&P500 | | 36.52 | 49 | 1.33 | -4.72 | -15.07% |
| SPXS | Direxion Daily S&P 500 Bear 3X ETF | | 9.88 | 32 | 1.33 | -4.63 | -14.46% |
| 12Stocks.com: Charts, Trends, Fundamental Data and Performances of S&P 500 Stocks | |
|
We now take in-depth look at all S&P 500 stocks including charts, multi-period performances and overall trends (as measured by Smart Investing & Trading Score). One can sort S&P 500 stocks (click link to choose) by Daily, Weekly and by Year-to-Date performances. Also, one can sort by size of the company or by market capitalization. |
| Select Your Default Chart Type: | |||||
| |||||
| Click on stock symbol or name for detailed view. Click on to add stock symbol to your watchlist and to view watchlist. Quick View: Move mouse or cursor over "Daily" to quickly view daily technical stock chart and over "Weekly" to view weekly technical stock chart. | |||||

 | KMB Kimberly-Clark Corporation |
| Sector: Consumer Staples | |
| SubSector: Personal Products | |
| MarketCap: 44300.5 Millions | |
| Recent Price: 136.43 Smart Investing & Trading Score: 100 | |
| Day Percent Change: -0.98% Day Change: -1.35 | |
| Week Change: 7.57% Year-to-date Change: 12.3% | |
| KMB Links: Profile News Message Board | |
| Charts:- Daily , Weekly | |
| Add KMB to Watchlist: View: Get KMB Trend Analysis ➞ | |
 | CCL Carnival Corporation & Plc |
| Sector: Services & Goods | |
| SubSector: Resorts & Casinos | |
| MarketCap: 11725.4 Millions | |
| Recent Price: 15.18 Smart Investing & Trading Score: 57 | |
| Day Percent Change: 1.13% Day Change: 0.17 | |
| Week Change: 7.51% Year-to-date Change: -18.1% | |
| CCL Links: Profile News Message Board | |
| Charts:- Daily , Weekly | |
| Add CCL to Watchlist: View: Get CCL Trend Analysis ➞ | |
 | KDP Keurig Dr Pepper Inc. |
| Sector: Consumer Staples | |
| SubSector: Beverages - Soft Drinks | |
| MarketCap: 35295.2 Millions | |
| Recent Price: 33.87 Smart Investing & Trading Score: 80 | |
| Day Percent Change: 4.73% Day Change: 1.53 | |
| Week Change: 7.49% Year-to-date Change: 1.7% | |
| KDP Links: Profile News Message Board | |
| Charts:- Daily , Weekly | |
| Add KDP to Watchlist: View: Get KDP Trend Analysis ➞ | |
 | AVGO Broadcom Inc. |
| Sector: Technology | |
| SubSector: Semiconductor - Broad Line | |
| MarketCap: 86329.1 Millions | |
| Recent Price: 1294.42 Smart Investing & Trading Score: 58 | |
| Day Percent Change: 2.99% Day Change: 37.60 | |
| Week Change: 7.45% Year-to-date Change: 16.0% | |
| AVGO Links: Profile News Message Board | |
| Charts:- Daily , Weekly | |
| Add AVGO to Watchlist: View: Get AVGO Trend Analysis ➞ | |
 | SYF Synchrony Financial |
| Sector: Financials | |
| SubSector: Credit Services | |
| MarketCap: 9297.28 Millions | |
| Recent Price: 44.66 Smart Investing & Trading Score: 100 | |
| Day Percent Change: -0.80% Day Change: -0.36 | |
| Week Change: 7.43% Year-to-date Change: 16.9% | |
| SYF Links: Profile News Message Board | |
| Charts:- Daily , Weekly | |
| Add SYF to Watchlist: View: Get SYF Trend Analysis ➞ | |
 | F Ford Motor Company |
| Sector: Consumer Staples | |
| SubSector: Auto Manufacturers - Major | |
| MarketCap: 19052.1 Millions | |
| Recent Price: 13.04 Smart Investing & Trading Score: 61 | |
| Day Percent Change: 0.69% Day Change: 0.09 | |
| Week Change: 7.41% Year-to-date Change: 7.0% | |
| F Links: Profile News Message Board | |
| Charts:- Daily , Weekly | |
| Add F to Watchlist: View: Get F Trend Analysis ➞ | |
 | CSGP CoStar Group, Inc. |
| Sector: Financials | |
| SubSector: Property Management | |
| MarketCap: 21454.4 Millions | |
| Recent Price: 90.34 Smart Investing & Trading Score: 80 | |
| Day Percent Change: -1.75% Day Change: -1.61 | |
| Week Change: 7.22% Year-to-date Change: 3.4% | |
| CSGP Links: Profile News Message Board | |
| Charts:- Daily , Weekly | |
| Add CSGP to Watchlist: View: Get CSGP Trend Analysis ➞ | |
 | KLAC KLA Corporation |
| Sector: Technology | |
| SubSector: Semiconductor Equipment & Materials | |
| MarketCap: 20663.8 Millions | |
| Recent Price: 672.95 Smart Investing & Trading Score: 63 | |
| Day Percent Change: 2.50% Day Change: 16.41 | |
| Week Change: 7.13% Year-to-date Change: 15.8% | |
| KLAC Links: Profile News Message Board | |
| Charts:- Daily , Weekly | |
| Add KLAC to Watchlist: View: Get KLAC Trend Analysis ➞ | |
 | SWKS Skyworks Solutions, Inc. |
| Sector: Technology | |
| SubSector: Semiconductor - Integrated Circuits | |
| MarketCap: 13981 Millions | |
| Recent Price: 102.95 Smart Investing & Trading Score: 47 | |
| Day Percent Change: 1.81% Day Change: 1.83 | |
| Week Change: 7.12% Year-to-date Change: -8.4% | |
| SWKS Links: Profile News Message Board | |
| Charts:- Daily , Weekly | |
| Add SWKS to Watchlist: View: Get SWKS Trend Analysis ➞ | |
 | RCL Royal Caribbean Cruises Ltd. |
| Sector: Services & Goods | |
| SubSector: Resorts & Casinos | |
| MarketCap: 7294.14 Millions | |
| Recent Price: 137.47 Smart Investing & Trading Score: 95 | |
| Day Percent Change: 0.54% Day Change: 0.74 | |
| Week Change: 6.39% Year-to-date Change: 6.2% | |
| RCL Links: Profile News Message Board | |
| Charts:- Daily , Weekly | |
| Add RCL to Watchlist: View: Get RCL Trend Analysis ➞ | |
 | STX Seagate Technology plc |
| Sector: Technology | |
| SubSector: Data Storage Devices | |
| MarketCap: 10814.7 Millions | |
| Recent Price: 87.26 Smart Investing & Trading Score: 68 | |
| Day Percent Change: 0.17% Day Change: 0.15 | |
| Week Change: 5.82% Year-to-date Change: 2.2% | |
| STX Links: Profile News Message Board | |
| Charts:- Daily , Weekly | |
| Add STX to Watchlist: View: Get STX Trend Analysis ➞ | |
 | TDG TransDigm Group Incorporated |
| Sector: Industrials | |
| SubSector: Aerospace/Defense Products & Services | |
| MarketCap: 18441 Millions | |
| Recent Price: 1256.58 Smart Investing & Trading Score: 95 | |
| Day Percent Change: 1.20% Day Change: 14.96 | |
| Week Change: 5.8% Year-to-date Change: 24.2% | |
| TDG Links: Profile News Message Board | |
| Charts:- Daily , Weekly | |
| Add TDG to Watchlist: View: Get TDG Trend Analysis ➞ | |
 | NCLH Norwegian Cruise Line Holdings Ltd. |
| Sector: Services & Goods | |
| SubSector: Resorts & Casinos | |
| MarketCap: 2895.54 Millions | |
| Recent Price: 19.35 Smart Investing & Trading Score: 83 | |
| Day Percent Change: -0.21% Day Change: -0.04 | |
| Week Change: 5.8% Year-to-date Change: -3.4% | |
| NCLH Links: Profile News Message Board | |
| Charts:- Daily , Weekly | |
| Add NCLH to Watchlist: View: Get NCLH Trend Analysis ➞ | |
 | FICO Fair Isaac Corporation |
| Sector: Technology | |
| SubSector: Business Software & Services | |
| MarketCap: 7930.98 Millions | |
| Recent Price: 1193.66 Smart Investing & Trading Score: 55 | |
| Day Percent Change: 0.05% Day Change: 0.63 | |
| Week Change: 5.63% Year-to-date Change: 2.6% | |
| FICO Links: Profile News Message Board | |
| Charts:- Daily , Weekly | |
| Add FICO to Watchlist: View: Get FICO Trend Analysis ➞ | |
 | PHM PulteGroup, Inc. |
| Sector: Industrials | |
| SubSector: Residential Construction | |
| MarketCap: 6186.46 Millions | |
| Recent Price: 111.36 Smart Investing & Trading Score: 58 | |
| Day Percent Change: -0.80% Day Change: -0.90 | |
| Week Change: 5.62% Year-to-date Change: 7.9% | |
| PHM Links: Profile News Message Board | |
| Charts:- Daily , Weekly | |
| Add PHM to Watchlist: View: Get PHM Trend Analysis ➞ | |
 | EXPE Expedia Group, Inc. |
| Sector: Services & Goods | |
| SubSector: Lodging | |
| MarketCap: 8052.96 Millions | |
| Recent Price: 136.25 Smart Investing & Trading Score: 57 | |
| Day Percent Change: 0.33% Day Change: 0.45 | |
| Week Change: 5.62% Year-to-date Change: -10.2% | |
| EXPE Links: Profile News Message Board | |
| Charts:- Daily , Weekly | |
| Add EXPE to Watchlist: View: Get EXPE Trend Analysis ➞ | |
 | DXCM DexCom, Inc. |
| Sector: Health Care | |
| SubSector: Medical Laboratories & Research | |
| MarketCap: 19559 Millions | |
| Recent Price: 138.01 Smart Investing & Trading Score: 80 | |
| Day Percent Change: 0.10% Day Change: 0.14 | |
| Week Change: 5.58% Year-to-date Change: 11.2% | |
| DXCM Links: Profile News Message Board | |
| Charts:- Daily , Weekly | |
| Add DXCM to Watchlist: View: Get DXCM Trend Analysis ➞ | |
 | NOC Northrop Grumman Corporation |
| Sector: Industrials | |
| SubSector: Aerospace/Defense - Major Diversified | |
| MarketCap: 52094.9 Millions | |
| Recent Price: 488.06 Smart Investing & Trading Score: 100 | |
| Day Percent Change: 2.84% Day Change: 13.49 | |
| Week Change: 5.51% Year-to-date Change: 4.3% | |
| NOC Links: Profile News Message Board | |
| Charts:- Daily , Weekly | |
| Add NOC to Watchlist: View: Get NOC Trend Analysis ➞ | |
 | DOV Dover Corporation |
| Sector: Industrials | |
| SubSector: Diversified Machinery | |
| MarketCap: 10725.6 Millions | |
| Recent Price: 179.11 Smart Investing & Trading Score: 100 | |
| Day Percent Change: 4.47% Day Change: 7.67 | |
| Week Change: 5.46% Year-to-date Change: 16.5% | |
| DOV Links: Profile News Message Board | |
| Charts:- Daily , Weekly | |
| Add DOV to Watchlist: View: Get DOV Trend Analysis ➞ | |
 | EQR Equity Residential |
| Sector: Financials | |
| SubSector: REIT - Residential | |
| MarketCap: 22061.9 Millions | |
| Recent Price: 64.88 Smart Investing & Trading Score: 100 | |
| Day Percent Change: 0.42% Day Change: 0.27 | |
| Week Change: 5.43% Year-to-date Change: 6.1% | |
| EQR Links: Profile News Message Board | |
| Charts:- Daily , Weekly | |
| Add EQR to Watchlist: View: Get EQR Trend Analysis ➞ | |
 | DGX Quest Diagnostics Incorporated |
| Sector: Health Care | |
| SubSector: Medical Laboratories & Research | |
| MarketCap: 11076.1 Millions | |
| Recent Price: 135.42 Smart Investing & Trading Score: 93 | |
| Day Percent Change: -1.55% Day Change: -2.13 | |
| Week Change: 5.43% Year-to-date Change: -1.8% | |
| DGX Links: Profile News Message Board | |
| Charts:- Daily , Weekly | |
| Add DGX to Watchlist: View: Get DGX Trend Analysis ➞ | |
 | RL Ralph Lauren Corporation |
| Sector: Consumer Staples | |
| SubSector: Textile - Apparel Clothing | |
| MarketCap: 5589.95 Millions | |
| Recent Price: 166.93 Smart Investing & Trading Score: 58 | |
| Day Percent Change: -0.76% Day Change: -1.28 | |
| Week Change: 5.35% Year-to-date Change: 15.8% | |
| RL Links: Profile News Message Board | |
| Charts:- Daily , Weekly | |
| Add RL to Watchlist: View: Get RL Trend Analysis ➞ | |
 | WDC Western Digital Corporation |
| Sector: Technology | |
| SubSector: Data Storage Devices | |
| MarketCap: 10712.9 Millions | |
| Recent Price: 69.44 Smart Investing & Trading Score: 61 | |
| Day Percent Change: -0.16% Day Change: -0.11 | |
| Week Change: 5.13% Year-to-date Change: 32.6% | |
| WDC Links: Profile News Message Board | |
| Charts:- Daily , Weekly | |
| Add WDC to Watchlist: View: Get WDC Trend Analysis ➞ | |
 | ESS Essex Property Trust, Inc. |
| Sector: Financials | |
| SubSector: REIT - Residential | |
| MarketCap: 13725.5 Millions | |
| Recent Price: 247.21 Smart Investing & Trading Score: 100 | |
| Day Percent Change: -0.21% Day Change: -0.53 | |
| Week Change: 5.12% Year-to-date Change: -0.3% | |
| ESS Links: Profile News Message Board | |
| Charts:- Daily , Weekly | |
| Add ESS to Watchlist: View: Get ESS Trend Analysis ➞ | |
 | TMO Thermo Fisher Scientific Inc. |
| Sector: Health Care | |
| SubSector: Medical Laboratories & Research | |
| MarketCap: 112999 Millions | |
| Recent Price: 571.73 Smart Investing & Trading Score: 75 | |
| Day Percent Change: -0.98% Day Change: -5.66 | |
| Week Change: 4.95% Year-to-date Change: 7.7% | |
| TMO Links: Profile News Message Board | |
| Charts:- Daily , Weekly | |
| Add TMO to Watchlist: View: Get TMO Trend Analysis ➞ | |
| For tabular summary view of above stock list: Summary View ➞ 0 - 25 , 25 - 50 , 50 - 75 , 75 - 100 , 100 - 125 , 125 - 150 , 150 - 175 , 175 - 200 , 200 - 225 , 225 - 250 , 250 - 275 , 275 - 300 , 300 - 325 , 325 - 350 , 350 - 375 , 375 - 400 , 400 - 425 , 425 - 450 , 450 - 475 , 475 - 500 | ||
| Click To Change The Sort Order: By Market Cap or Company Size Performance: Year-to-date, Week and Day | |
| Select Chart Type: | ||
|
Best Stocks Today 12Stocks.com |
© 2024 12Stocks.com Terms & Conditions Privacy Contact Us
All Information Provided Only For Education And Not To Be Used For Investing or Trading. See Terms & Conditions


One More Thing ... Get Best Stocks Delivered Daily!
Never Ever Miss A Move With Our Top Ten Stocks Lists
Find Best Stocks In Any Market - Bull or Bear Market
Take A Peek At Our Top Ten Stocks Lists: Daily, Weekly, Year-to-Date & Top Trends
Find Best Stocks In Any Market - Bull or Bear Market
Take A Peek At Our Top Ten Stocks Lists: Daily, Weekly, Year-to-Date & Top Trends
S&P 500 Stocks With Best Up Trends [0-bearish to 100-bullish]: Newmont [100], Teradyne [100], Chipotle Mexican[100], Dover [100], Merck [100], Northrop Grumman[100], Tractor Supply[100], EQT [100], Microchip [100], Hess [100], Altria [100]
Best S&P 500 Stocks Year-to-Date:
NVIDIA [66.86%], Constellation [60.54%], NRG [40.93%], Chipotle Mexican[36.07%], Targa Resources[35.47%], Marathon [34.48%], Diamondback [33.54%], Western Digital[32.59%], Progressive [31.89%], Eaton [31.68%], Micron [30.75%] Best S&P 500 Stocks This Week:
Hasbro [17.55%], Tesla [15.73%], Tyler Technologies[13.57%], Teradyne [13.48%], Wabtec [13.19%], Globe Life[13.19%], Microchip [12.89%], Monolithic Power[11.63%], Newmont [11.25%], NXP Semiconductors[10.67%], EQT [10.26%] Best S&P 500 Stocks Daily:
Newmont [12.46%], Tyler Technologies[9.32%], Teradyne [8.15%], Carrier Global[7.19%], Chipotle Mexican[6.33%], United Rentals[5.45%], Zebra Technologies[5.40%], Union Pacific[4.99%], Tesla [4.97%], Keurig Dr[4.73%], Dover [4.47%]