
 Login Sign Up


| |||||
 |  | ||||

| 12Stocks.com Market Intelligence |
Best S&P 500 Stocks
|
On this page, you will find the most comprehensive analysis of S&P 500 stocks and ETFs - from latest trends to performances to charts ➞. First, here are the year-to-date (YTD) performances of the most requested S&P 500 stocks at 12Stocks.com (click stock for review):
| NVIDIA 65% | ||
| Merck 19% | ||
| Caterpillar 15% | ||
| Walmart 14% | ||
| JPMorgan Chase 13% | ||
| Amazon.com 13% | ||
| Google 11% | ||
| Chevron 10% | ||
| Goldman Sachs 8% | ||
| Microsoft 4% | ||
| Johnson & Johnson -6% | ||
| McDonald s -7% | ||
| Starbucks -8% | ||
| Apple -12% | ||
| Gilead -19% | ||
| Intel -31% | ||
| Boeing -38% | ||
| Quick: S&P 500 Stocks Lists: Performances & Trends, S&P 500 Stock Charts
Sort S&P 500 stocks: Daily, Weekly, Year-to-Date, Market Cap & Trends. Filter S&P 500 stocks list by sector: Show all, Tech, Finance, Energy, Staples, Retail, Industrial, Materials, Utilities and HealthCare |
| 12Stocks.com S&P 500 Stocks Performances & Trends Daily Report | |||||||||
|
| 
The overall Smart Investing & Trading Score is 44 (0-bearish to 100-bullish) which puts S&P 500 index in short term neutral trend. The Smart Investing & Trading Score from previous trading session is 58 and hence a deterioration of trend. | ||||||||
Here are the Smart Investing & Trading Scores of the most requested S&P 500 stocks at 12Stocks.com (click stock name for detailed review):
|


| 12Stocks.com: Top Performing S&P 500 Index Stocks | ||||||||||||||||||||||||||||||||||||||||||||||||
 The top performing S&P 500 Index stocks year to date are
Now, more recently, over last week, the top performing S&P 500 Index stocks on the move are


|
||||||||||||||||||||||||||||||||||||||||||||||||
| 12Stocks.com: Investing in S&P 500 Index with Stocks | |
|
The following table helps investors and traders sort through current performance and trends (as measured by Smart Investing & Trading Score) of various
stocks in the S&P 500 Index. Quick View: Move mouse or cursor over stock symbol (ticker) to view short-term technical chart and over stock name to view long term chart. Click on  to add stock symbol to your watchlist and to add stock symbol to your watchlist and  to view watchlist. Click on any ticker or stock name for detailed market intelligence report for that stock. to view watchlist. Click on any ticker or stock name for detailed market intelligence report for that stock. |
12Stocks.com Performance of Stocks in S&P 500 Index
| Ticker | Stock Name | Watchlist | Category | Recent Price | Smart Investing & Trading Score | Change % | Weekly Change% |
| VICI | VICI Properties |   | Financials | 28.41 | 27 | -0.09% | 1.85% |
| BAC | Bank of America | | Financials | 37.65 | 71 | -1.76% | 1.83% |
| MKC | McCormick & | | Consumer Staples | 75.24 | 88 | -0.80% | 1.79% |
| PTC | PTC | | Technology | 179.44 | 38 | -0.59% | 1.74% |
| IT | Gartner | | Technology | 448.06 | 25 | -0.67% | 1.74% |
| HBAN | Huntington Bancshares | | Financials | 13.51 | 68 | -1.82% | 1.73% |
| MLM | Martin Marietta | | Industrials | 585.85 | 56 | -1.01% | 1.73% |
| TJX | TJX | | Services & Goods | 94.97 | 52 | -0.33% | 1.72% |
| WELL | Welltower | | Financials | 92.89 | 80 | -0.86% | 1.72% |
| GPN | Global Payments | | Services & Goods | 124.18 | 57 | -2.58% | 1.70% |
| VLO | Valero | | Energy | 166.66 | 54 | -0.20% | 1.69% |
| PAYX | Paychex | | Services & Goods | 121.53 | 65 | -0.81% | 1.68% |
| CTRA | Contura | | Materials | 28.20 | 88 | -0.90% | 1.64% |
| AVY | Avery Dennison | | Consumer Staples | 214.97 | 63 | 1.20% | 1.61% |
| ED | Consolidated Edison | | Utilities | 93.24 | 88 | -0.20% | 1.60% |
| YUM | Yum! Brands | | Services & Goods | 140.72 | 100 | -0.77% | 1.60% |
| A | Agilent Technologies | | Health Care | 134.82 | 56 | -1.94% | 1.58% |
| INTC | Intel | | Technology | 34.73 | 42 | 0.67% | 1.55% |
| INVH | Invitation Homes | | Financials | 34.09 | 75 | -0.64% | 1.55% |
| BXP | Boston Properties | | Financials | 61.13 | 22 | -2.88% | 1.54% |
| CMS | CMS | | Utilities | 60.46 | 70 | 0.30% | 1.53% |
| PYPL | PayPal Holdings | | Financials | 63.27 | 61 | -2.43% | 1.53% |
| NI | NiSource | | Utilities | 28.00 | 88 | -0.66% | 1.50% |
| MCD | McDonald s | | Services & Goods | 276.04 | 44 | -0.26% | 1.49% |
| MS | Morgan Stanley | | Financials | 92.00 | 68 | -1.97% | 1.48% |
| For chart view version of above stock list: Chart View ➞ 0 - 25 , 25 - 50 , 50 - 75 , 75 - 100 , 100 - 125 , 125 - 150 , 150 - 175 , 175 - 200 , 200 - 225 , 225 - 250 , 250 - 275 , 275 - 300 , 300 - 325 , 325 - 350 , 350 - 375 , 375 - 400 , 400 - 425 , 425 - 450 , 450 - 475 , 475 - 500 | ||
 | Click To Change The Sort Order: By Market Cap or Company Size Performance: Year-to-date, Week and Day |  |
|
Get the most comprehensive stock market coverage daily at 12Stocks.com ➞ Best Stocks Today ➞ Best Stocks Weekly ➞ Best Stocks Year-to-Date ➞ Best Stocks Trends ➞  Best Stocks Today 12Stocks.com Best Nasdaq Stocks ➞ Best S&P 500 Stocks ➞ Best Tech Stocks ➞ Best Biotech Stocks ➞ |
| Detailed Overview of S&P 500 Stocks |
| S&P 500 Technical Overview, Leaders & Laggards, Top S&P 500 ETF Funds & Detailed S&P 500 Stocks List, Charts, Trends & More |
| S&P 500: Technical Analysis, Trends & YTD Performance | |
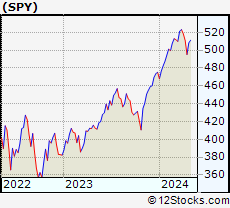
| S&P 500 index as represented by
SPY, an exchange-traded fund [ETF], holds basket of five hundred (mostly largecap) stocks from across all major sectors of the US stock market. The S&P 500 index (contains stocks like Apple and Exxon) is up by 4.99% and is currently outperforming the overall market by 0.74% year-to-date. Below is a quick view of technical charts and trends: | |
 SPY Weekly Chart |
|
| Long Term Trend: Good | |
| Medium Term Trend: Not Good | |
 SPY Daily Chart |
|
| Short Term Trend: Not Good | |
| Overall Trend Score: 44 | |
| YTD Performance: 4.99% | |
| **Trend Scores & Views Are Only For Educational Purposes And Not For Investing | |
| 12Stocks.com: Investing in S&P 500 Index using Exchange Traded Funds | |
|
The following table shows list of key exchange traded funds (ETF) that
help investors track S&P 500 index. The following list also includes leveraged ETF funds that track twice or thrice the daily returns of S&P 500 indices. Short or inverse ETF funds move in the opposite direction to the index they track and are useful during market pullbacks or during bear markets. Quick View: Move mouse or cursor over ETF symbol (ticker) to view short-term technical chart and over ETF name to view long term chart. Click on ticker or stock name for detailed view. Click on to add stock symbol to your watchlist and to view watchlist. |
12Stocks.com List of ETFs that track S&P 500 Index
| Ticker | ETF Name | Watchlist | Recent Price | Smart Investing & Trading Score | Change % | Week % | Year-to-date % |
| SPY | SPDR S&P 500 ETF | | 499.05 | 44 | -1.26 | 0.78 | 4.99% |
| OEF | iShares S&P 100 | | 235.81 | 34 | -1.66 | 0.48 | 5.56% |
| SSO | ProShares Ultra S&P500 | | 70.09 | 44 | -2.59 | 1.42 | 7.71% |
| UPRO | ProShares UltraPro S&P500 | | 60.43 | 36 | -3.90 | 2.15 | 10.39% |
| SH | ProShares Short S&P500 | | 12.52 | 62 | 1.54 | -0.56 | -3.62% |
| SDS | ProShares UltraShort S&P500 | | 27.50 | 62 | 2.61 | -1.43 | -8.09% |
| SPXU | ProShares UltraPro Short S&P500 | | 37.50 | 69 | 4.05 | -2.17 | -12.79% |
| 12Stocks.com: Charts, Trends, Fundamental Data and Performances of S&P 500 Stocks | |
|
We now take in-depth look at all S&P 500 stocks including charts, multi-period performances and overall trends (as measured by Smart Investing & Trading Score). One can sort S&P 500 stocks (click link to choose) by Daily, Weekly and by Year-to-Date performances. Also, one can sort by size of the company or by market capitalization. |
| Select Your Default Chart Type: | |||||
| |||||
| Click on stock symbol or name for detailed view. Click on to add stock symbol to your watchlist and to view watchlist. Quick View: Move mouse or cursor over "Daily" to quickly view daily technical stock chart and over "Weekly" to view weekly technical stock chart. | |||||

 | VICI VICI Properties Inc. |
| Sector: Financials | |
| SubSector: REIT - Diversified | |
| MarketCap: 7327.03 Millions | |
| Recent Price: 28.41 Smart Investing & Trading Score: 27 | |
| Day Percent Change: -0.09% Day Change: -0.02 | |
| Week Change: 1.85% Year-to-date Change: -10.9% | |
| VICI Links: Profile News Message Board | |
| Charts:- Daily , Weekly | |
| Add VICI to Watchlist: View: Get VICI Trend Analysis ➞ | |
 | BAC Bank of America Corporation |
| Sector: Financials | |
| SubSector: Money Center Banks | |
| MarketCap: 189690 Millions | |
| Recent Price: 37.65 Smart Investing & Trading Score: 71 | |
| Day Percent Change: -1.76% Day Change: -0.67 | |
| Week Change: 1.83% Year-to-date Change: 11.8% | |
| BAC Links: Profile News Message Board | |
| Charts:- Daily , Weekly | |
| Add BAC to Watchlist: View: Get BAC Trend Analysis ➞ | |
 | MKC McCormick & Company, Incorporated |
| Sector: Consumer Staples | |
| SubSector: Processed & Packaged Goods | |
| MarketCap: 18522.8 Millions | |
| Recent Price: 75.24 Smart Investing & Trading Score: 88 | |
| Day Percent Change: -0.80% Day Change: -0.61 | |
| Week Change: 1.79% Year-to-date Change: 10.0% | |
| MKC Links: Profile News Message Board | |
| Charts:- Daily , Weekly | |
| Add MKC to Watchlist: View: Get MKC Trend Analysis ➞ | |
 | PTC PTC Inc. |
| Sector: Technology | |
| SubSector: Technical & System Software | |
| MarketCap: 6166.7 Millions | |
| Recent Price: 179.44 Smart Investing & Trading Score: 38 | |
| Day Percent Change: -0.59% Day Change: -1.06 | |
| Week Change: 1.74% Year-to-date Change: 2.6% | |
| PTC Links: Profile News Message Board | |
| Charts:- Daily , Weekly | |
| Add PTC to Watchlist: View: Get PTC Trend Analysis ➞ | |
 | IT Gartner, Inc. |
| Sector: Technology | |
| SubSector: Information Technology Services | |
| MarketCap: 7767.98 Millions | |
| Recent Price: 448.06 Smart Investing & Trading Score: 25 | |
| Day Percent Change: -0.67% Day Change: -3.00 | |
| Week Change: 1.74% Year-to-date Change: -0.7% | |
| IT Links: Profile News Message Board | |
| Charts:- Daily , Weekly | |
| Add IT to Watchlist: View: Get IT Trend Analysis ➞ | |
 | HBAN Huntington Bancshares Incorporated |
| Sector: Financials | |
| SubSector: Regional - Midwest Banks | |
| MarketCap: 8468.1 Millions | |
| Recent Price: 13.51 Smart Investing & Trading Score: 68 | |
| Day Percent Change: -1.82% Day Change: -0.25 | |
| Week Change: 1.73% Year-to-date Change: 6.2% | |
| HBAN Links: Profile News Message Board | |
| Charts:- Daily , Weekly | |
| Add HBAN to Watchlist: View: Get HBAN Trend Analysis ➞ | |
 | MLM Martin Marietta Materials, Inc. |
| Sector: Industrials | |
| SubSector: General Building Materials | |
| MarketCap: 10624.3 Millions | |
| Recent Price: 585.85 Smart Investing & Trading Score: 56 | |
| Day Percent Change: -1.01% Day Change: -5.97 | |
| Week Change: 1.73% Year-to-date Change: 17.4% | |
| MLM Links: Profile News Message Board | |
| Charts:- Daily , Weekly | |
| Add MLM to Watchlist: View: Get MLM Trend Analysis ➞ | |
 | TJX The TJX Companies, Inc. |
| Sector: Services & Goods | |
| SubSector: Department Stores | |
| MarketCap: 50656.2 Millions | |
| Recent Price: 94.97 Smart Investing & Trading Score: 52 | |
| Day Percent Change: -0.33% Day Change: -0.31 | |
| Week Change: 1.72% Year-to-date Change: 1.2% | |
| TJX Links: Profile News Message Board | |
| Charts:- Daily , Weekly | |
| Add TJX to Watchlist: View: Get TJX Trend Analysis ➞ | |
 | WELL Welltower Inc. |
| Sector: Financials | |
| SubSector: REIT - Healthcare Facilities | |
| MarketCap: 21398.8 Millions | |
| Recent Price: 92.89 Smart Investing & Trading Score: 80 | |
| Day Percent Change: -0.86% Day Change: -0.81 | |
| Week Change: 1.72% Year-to-date Change: 3.0% | |
| WELL Links: Profile News Message Board | |
| Charts:- Daily , Weekly | |
| Add WELL to Watchlist: View: Get WELL Trend Analysis ➞ | |
 | GPN Global Payments Inc. |
| Sector: Services & Goods | |
| SubSector: Business Services | |
| MarketCap: 39068.8 Millions | |
| Recent Price: 124.18 Smart Investing & Trading Score: 57 | |
| Day Percent Change: -2.58% Day Change: -3.29 | |
| Week Change: 1.7% Year-to-date Change: -2.2% | |
| GPN Links: Profile News Message Board | |
| Charts:- Daily , Weekly | |
| Add GPN to Watchlist: View: Get GPN Trend Analysis ➞ | |
 | VLO Valero Energy Corporation |
| Sector: Energy | |
| SubSector: Oil & Gas Refining & Marketing | |
| MarketCap: 19590.5 Millions | |
| Recent Price: 166.66 Smart Investing & Trading Score: 54 | |
| Day Percent Change: -0.20% Day Change: -0.34 | |
| Week Change: 1.69% Year-to-date Change: 28.2% | |
| VLO Links: Profile News Message Board | |
| Charts:- Daily , Weekly | |
| Add VLO to Watchlist: View: Get VLO Trend Analysis ➞ | |
 | PAYX Paychex, Inc. |
| Sector: Services & Goods | |
| SubSector: Staffing & Outsourcing Services | |
| MarketCap: 20928.8 Millions | |
| Recent Price: 121.53 Smart Investing & Trading Score: 65 | |
| Day Percent Change: -0.81% Day Change: -0.99 | |
| Week Change: 1.68% Year-to-date Change: 2.0% | |
| PAYX Links: Profile News Message Board | |
| Charts:- Daily , Weekly | |
| Add PAYX to Watchlist: View: Get PAYX Trend Analysis ➞ | |
 | CTRA Contura Energy, Inc. |
| Sector: Materials | |
| SubSector: Industrial Metals & Minerals | |
| MarketCap: 75.291 Millions | |
| Recent Price: 28.20 Smart Investing & Trading Score: 88 | |
| Day Percent Change: -0.90% Day Change: -0.26 | |
| Week Change: 1.64% Year-to-date Change: 10.5% | |
| CTRA Links: Profile News Message Board | |
| Charts:- Daily , Weekly | |
| Add CTRA to Watchlist: View: Get CTRA Trend Analysis ➞ | |
 | AVY Avery Dennison Corporation |
| Sector: Consumer Staples | |
| SubSector: Business Equipment | |
| MarketCap: 8051.27 Millions | |
| Recent Price: 214.97 Smart Investing & Trading Score: 63 | |
| Day Percent Change: 1.20% Day Change: 2.56 | |
| Week Change: 1.61% Year-to-date Change: 6.3% | |
| AVY Links: Profile News Message Board | |
| Charts:- Daily , Weekly | |
| Add AVY to Watchlist: View: Get AVY Trend Analysis ➞ | |
 | ED Consolidated Edison, Inc. |
| Sector: Utilities | |
| SubSector: Electric Utilities | |
| MarketCap: 25012.3 Millions | |
| Recent Price: 93.24 Smart Investing & Trading Score: 88 | |
| Day Percent Change: -0.20% Day Change: -0.19 | |
| Week Change: 1.6% Year-to-date Change: 2.5% | |
| ED Links: Profile News Message Board | |
| Charts:- Daily , Weekly | |
| Add ED to Watchlist: View: Get ED Trend Analysis ➞ | |
 | YUM Yum! Brands, Inc. |
| Sector: Services & Goods | |
| SubSector: Restaurants | |
| MarketCap: 18033.3 Millions | |
| Recent Price: 140.72 Smart Investing & Trading Score: 100 | |
| Day Percent Change: -0.77% Day Change: -1.09 | |
| Week Change: 1.6% Year-to-date Change: 7.7% | |
| YUM Links: Profile News Message Board | |
| Charts:- Daily , Weekly | |
| Add YUM to Watchlist: View: Get YUM Trend Analysis ➞ | |
 | A Agilent Technologies, Inc. |
| Sector: Health Care | |
| SubSector: Medical Laboratories & Research | |
| MarketCap: 22337.9 Millions | |
| Recent Price: 134.82 Smart Investing & Trading Score: 56 | |
| Day Percent Change: -1.94% Day Change: -2.67 | |
| Week Change: 1.58% Year-to-date Change: -3.0% | |
| A Links: Profile News Message Board | |
| Charts:- Daily , Weekly | |
| Add A to Watchlist: View: Get A Trend Analysis ➞ | |
 | INTC Intel Corporation |
| Sector: Technology | |
| SubSector: Semiconductor - Broad Line | |
| MarketCap: 222357 Millions | |
| Recent Price: 34.73 Smart Investing & Trading Score: 42 | |
| Day Percent Change: 0.67% Day Change: 0.23 | |
| Week Change: 1.55% Year-to-date Change: -30.9% | |
| INTC Links: Profile News Message Board | |
| Charts:- Daily , Weekly | |
| Add INTC to Watchlist: View: Get INTC Trend Analysis ➞ | |
 | INVH Invitation Homes Inc. |
| Sector: Financials | |
| SubSector: Real Estate Development | |
| MarketCap: 9782.89 Millions | |
| Recent Price: 34.09 Smart Investing & Trading Score: 75 | |
| Day Percent Change: -0.64% Day Change: -0.22 | |
| Week Change: 1.55% Year-to-date Change: -0.1% | |
| INVH Links: Profile News Message Board | |
| Charts:- Daily , Weekly | |
| Add INVH to Watchlist: View: Get INVH Trend Analysis ➞ | |
 | BXP Boston Properties, Inc. |
| Sector: Financials | |
| SubSector: REIT - Office | |
| MarketCap: 13788.6 Millions | |
| Recent Price: 61.13 Smart Investing & Trading Score: 22 | |
| Day Percent Change: -2.88% Day Change: -1.81 | |
| Week Change: 1.54% Year-to-date Change: -12.9% | |
| BXP Links: Profile News Message Board | |
| Charts:- Daily , Weekly | |
| Add BXP to Watchlist: View: Get BXP Trend Analysis ➞ | |
 | CMS CMS Energy Corporation |
| Sector: Utilities | |
| SubSector: Electric Utilities | |
| MarketCap: 15105.8 Millions | |
| Recent Price: 60.46 Smart Investing & Trading Score: 70 | |
| Day Percent Change: 0.30% Day Change: 0.18 | |
| Week Change: 1.53% Year-to-date Change: 4.1% | |
| CMS Links: Profile News Message Board | |
| Charts:- Daily , Weekly | |
| Add CMS to Watchlist: View: Get CMS Trend Analysis ➞ | |
 | PYPL PayPal Holdings, Inc. |
| Sector: Financials | |
| SubSector: Credit Services | |
| MarketCap: 108949 Millions | |
| Recent Price: 63.27 Smart Investing & Trading Score: 61 | |
| Day Percent Change: -2.43% Day Change: -1.58 | |
| Week Change: 1.53% Year-to-date Change: 3.0% | |
| PYPL Links: Profile News Message Board | |
| Charts:- Daily , Weekly | |
| Add PYPL to Watchlist: View: Get PYPL Trend Analysis ➞ | |
 | NI NiSource Inc. |
| Sector: Utilities | |
| SubSector: Diversified Utilities | |
| MarketCap: 9056.8 Millions | |
| Recent Price: 28.00 Smart Investing & Trading Score: 88 | |
| Day Percent Change: -0.66% Day Change: -0.18 | |
| Week Change: 1.5% Year-to-date Change: 5.4% | |
| NI Links: Profile News Message Board | |
| Charts:- Daily , Weekly | |
| Add NI to Watchlist: View: Get NI Trend Analysis ➞ | |
 | MCD McDonald s Corporation |
| Sector: Services & Goods | |
| SubSector: Restaurants | |
| MarketCap: 122481 Millions | |
| Recent Price: 276.04 Smart Investing & Trading Score: 44 | |
| Day Percent Change: -0.26% Day Change: -0.71 | |
| Week Change: 1.49% Year-to-date Change: -6.9% | |
| MCD Links: Profile News Message Board | |
| Charts:- Daily , Weekly | |
| Add MCD to Watchlist: View: Get MCD Trend Analysis ➞ | |
 | MS Morgan Stanley |
| Sector: Financials | |
| SubSector: Investment Brokerage - National | |
| MarketCap: 55876.7 Millions | |
| Recent Price: 92.00 Smart Investing & Trading Score: 68 | |
| Day Percent Change: -1.97% Day Change: -1.85 | |
| Week Change: 1.48% Year-to-date Change: -1.3% | |
| MS Links: Profile News Message Board | |
| Charts:- Daily , Weekly | |
| Add MS to Watchlist: View: Get MS Trend Analysis ➞ | |
| For tabular summary view of above stock list: Summary View ➞ 0 - 25 , 25 - 50 , 50 - 75 , 75 - 100 , 100 - 125 , 125 - 150 , 150 - 175 , 175 - 200 , 200 - 225 , 225 - 250 , 250 - 275 , 275 - 300 , 300 - 325 , 325 - 350 , 350 - 375 , 375 - 400 , 400 - 425 , 425 - 450 , 450 - 475 , 475 - 500 | ||
| Click To Change The Sort Order: By Market Cap or Company Size Performance: Year-to-date, Week and Day | |
| Select Chart Type: | ||
|
Best Stocks Today 12Stocks.com |
© 2024 12Stocks.com Terms & Conditions Privacy Contact Us
All Information Provided Only For Education And Not To Be Used For Investing or Trading. See Terms & Conditions


One More Thing ... Get Best Stocks Delivered Daily!
Never Ever Miss A Move With Our Top Ten Stocks Lists
Find Best Stocks In Any Market - Bull or Bear Market
Take A Peek At Our Top Ten Stocks Lists: Daily, Weekly, Year-to-Date & Top Trends
Find Best Stocks In Any Market - Bull or Bear Market
Take A Peek At Our Top Ten Stocks Lists: Daily, Weekly, Year-to-Date & Top Trends
S&P 500 Stocks With Best Up Trends [0-bearish to 100-bullish]: Newmont [100], Dover [100], Chipotle Mexican[100], Merck [100], Northrop Grumman[100], EQT [100], Boston Scientific[100], Coca-Cola [100], Altria [100], Hess [100], Campbell Soup[100]
Best S&P 500 Stocks Year-to-Date:
NVIDIA [65.24%], Constellation [60.24%], NRG [39.81%], Targa Resources[34.22%], Marathon [33.86%], Chipotle Mexican[32.43%], Diamondback [32.2%], Progressive [31.71%], Eaton [30.97%], Western Digital[30.89%], Micron [30.34%] Best S&P 500 Stocks This Week:
Hasbro [17.46%], Globe Life[14.66%], Tesla [13.26%], Wabtec [12.29%], Teradyne [12.18%], Microchip [10.53%], Tyler Technologies[10.37%], Monolithic Power[10.19%], NXP Semiconductors[9.67%], ON Semiconductor[8.85%], Boston Scientific[8.79%] Best S&P 500 Stocks Daily:
Newmont [8.50%], Carrier Global[7.19%], Teradyne [6.91%], Tyler Technologies[6.24%], Dover [4.35%], ProShares UltraPro[4.05%], Keurig Dr[3.77%], United Rentals[3.69%], Union Pacific[3.50%], Chipotle Mexican[3.48%], Rollins [3.34%]