
 Login Sign Up


| |||||
 |  | ||||

| 12Stocks.com Market Intelligence |
Best S&P 500 Stocks
|
On this page, you will find the most comprehensive analysis of S&P 500 stocks and ETFs - from latest trends to performances to charts ➞. First, here are the year-to-date (YTD) performances of the most requested S&P 500 stocks at 12Stocks.com (click stock for review):
| NVIDIA 70% | ||
| Caterpillar 21% | ||
| Amazon.com 19% | ||
| Merck 15% | ||
| Walmart 14% | ||
| Google 11% | ||
| Microsoft 10% | ||
| JPMorgan Chase 6% | ||
| Chevron 5% | ||
| Goldman Sachs 5% | ||
| Johnson & Johnson -8% | ||
| McDonald s -9% | ||
| Starbucks -10% | ||
| Apple -13% | ||
| Gilead -17% | ||
| Intel -29% | ||
| Boeing -35% | ||
| Quick: S&P 500 Stocks Lists: Performances & Trends, S&P 500 Stock Charts
Sort S&P 500 stocks: Daily, Weekly, Year-to-Date, Market Cap & Trends. Filter S&P 500 stocks list by sector: Show all, Tech, Finance, Energy, Staples, Retail, Industrial, Materials, Utilities and HealthCare |
| 12Stocks.com S&P 500 Stocks Performances & Trends Daily Report | |||||||||
|
| 
The overall Smart Investing & Trading Score is 26 (0-bearish to 100-bullish) which puts S&P 500 index in short term bearish to neutral trend. The Smart Investing & Trading Score from previous trading session is 31 and a deterioration of trend continues. | ||||||||
Here are the Smart Investing & Trading Scores of the most requested S&P 500 stocks at 12Stocks.com (click stock name for detailed review):
|


| 12Stocks.com: Top Performing S&P 500 Index Stocks | ||||||||||||||||||||||||||||||||||||||||||||||||
 The top performing S&P 500 Index stocks year to date are
Now, more recently, over last week, the top performing S&P 500 Index stocks on the move are


|
||||||||||||||||||||||||||||||||||||||||||||||||
| 12Stocks.com: Investing in S&P 500 Index with Stocks | |
|
The following table helps investors and traders sort through current performance and trends (as measured by Smart Investing & Trading Score) of various
stocks in the S&P 500 Index. Quick View: Move mouse or cursor over stock symbol (ticker) to view short-term technical chart and over stock name to view long term chart. Click on  to add stock symbol to your watchlist and to add stock symbol to your watchlist and  to view watchlist. Click on any ticker or stock name for detailed market intelligence report for that stock. to view watchlist. Click on any ticker or stock name for detailed market intelligence report for that stock. |
12Stocks.com Performance of Stocks in S&P 500 Index
| Ticker | Stock Name | Watchlist | Category | Recent Price | Smart Investing & Trading Score | Change % | Weekly Change% |
| MDLZ | Mondelez |   | Consumer Staples | 66.51 | 25 | 0.80% | -0.27% |
| MRK | Merck | | Health Care | 125.37 | 49 | 0.25% | -0.29% |
| CFG | Citizens Financial | | Financials | 33.02 | 61 | 1.88% | -0.36% |
| PNW | Pinnacle West | | Utilities | 71.97 | 61 | 1.07% | -0.37% |
| MMM | 3M | | Industrials | 90.96 | 25 | -0.10% | -0.38% |
| TXN | Texas Instruments | | Technology | 165.70 | 44 | -1.13% | -0.38% |
| CF | CF Industries | | Materials | 77.80 | 54 | 0.06% | -0.38% |
| REGN | Regeneron | | Health Care | 901.19 | 25 | 0.79% | -0.39% |
| ADP | Automatic Data | | Technology | 242.90 | 8 | -0.54% | -0.39% |
| LVS | Las Vegas | | Services & Goods | 50.23 | 41 | -0.55% | -0.40% |
| DUK | Duke | | Utilities | 94.50 | 35 | 1.76% | -0.42% |
| CTVA | Corteva | | Materials | 53.53 | 61 | 0.39% | -0.43% |
| MCO | Moody s | | Services & Goods | 375.41 | 25 | 1.26% | -0.46% |
| JNPR | Juniper Networks | | Technology | 36.48 | 28 | 0.14% | -0.46% |
| AMP | Ameriprise Financial | | Financials | 411.77 | 51 | 0.22% | -0.47% |
| ES | Eversource | | Utilities | 58.51 | 43 | 2.29% | -0.48% |
| RJF | Raymond James | | Financials | 121.94 | 61 | 0.06% | -0.50% |
| CME | CME | | Financials | 208.42 | 51 | 0.94% | -0.52% |
| EL | Estee Lauder | | Consumer Staples | 138.04 | 61 | 0.81% | -0.55% |
| IPG | Interpublic | | Services & Goods | 30.27 | 25 | -0.26% | -0.59% |
| CTLT | Catalent | | Health Care | 55.96 | 44 | 0.32% | -0.60% |
| LHX | L3Harris Technologies | | Technology | 201.40 | 18 | 0.53% | -0.60% |
| PANW | Palo Alto | | Technology | 277.33 | 30 | 0.84% | -0.62% |
| ABNB | Airbnb | | Technology | 158.37 | 56 | 1.09% | -0.63% |
| GPN | Global Payments | | Services & Goods | 122.95 | 18 | -0.39% | -0.64% |
| For chart view version of above stock list: Chart View ➞ 0 - 25 , 25 - 50 , 50 - 75 , 75 - 100 , 100 - 125 , 125 - 150 , 150 - 175 , 175 - 200 , 200 - 225 , 225 - 250 , 250 - 275 , 275 - 300 , 300 - 325 , 325 - 350 , 350 - 375 , 375 - 400 , 400 - 425 , 425 - 450 , 450 - 475 , 475 - 500 | ||
 | Click To Change The Sort Order: By Market Cap or Company Size Performance: Year-to-date, Week and Day |  |
|
Get the most comprehensive stock market coverage daily at 12Stocks.com ➞ Best Stocks Today ➞ Best Stocks Weekly ➞ Best Stocks Year-to-Date ➞ Best Stocks Trends ➞  Best Stocks Today 12Stocks.com Best Nasdaq Stocks ➞ Best S&P 500 Stocks ➞ Best Tech Stocks ➞ Best Biotech Stocks ➞ |
| Detailed Overview of S&P 500 Stocks |
| S&P 500 Technical Overview, Leaders & Laggards, Top S&P 500 ETF Funds & Detailed S&P 500 Stocks List, Charts, Trends & More |
| S&P 500: Technical Analysis, Trends & YTD Performance | |
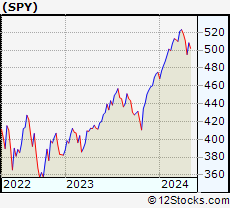
| S&P 500 index as represented by
SPY, an exchange-traded fund [ETF], holds basket of five hundred (mostly largecap) stocks from across all major sectors of the US stock market. The S&P 500 index (contains stocks like Apple and Exxon) is up by 5.31% and is currently outperforming the overall market by 0.9% year-to-date. Below is a quick view of technical charts and trends: | |
 SPY Weekly Chart |
|
| Long Term Trend: Good | |
| Medium Term Trend: Not Good | |
 SPY Daily Chart |
|
| Short Term Trend: Not Good | |
| Overall Trend Score: 26 | |
| YTD Performance: 5.31% | |
| **Trend Scores & Views Are Only For Educational Purposes And Not For Investing | |
| 12Stocks.com: Investing in S&P 500 Index using Exchange Traded Funds | |
|
The following table shows list of key exchange traded funds (ETF) that
help investors track S&P 500 index. The following list also includes leveraged ETF funds that track twice or thrice the daily returns of S&P 500 indices. Short or inverse ETF funds move in the opposite direction to the index they track and are useful during market pullbacks or during bear markets. Quick View: Move mouse or cursor over ETF symbol (ticker) to view short-term technical chart and over ETF name to view long term chart. Click on ticker or stock name for detailed view. Click on to add stock symbol to your watchlist and to view watchlist. |
12Stocks.com List of ETFs that track S&P 500 Index
| Ticker | ETF Name | Watchlist | Recent Price | Smart Investing & Trading Score | Change % | Week % | Year-to-date % |
| SPY | SPDR S&P 500 ETF | | 500.55 | 26 | -0.59 | -2.02 | 5.31% |
| IVV | iShares Core S&P 500 ETF | | 503.04 | 26 | -0.62 | -2 | 5.32% |
| VOO | Vanguard 500 ETF | | 459.99 | 26 | -0.65 | -2.04 | 5.31% |
| OEF | iShares S&P 100 | | 237.92 | 26 | -0.62 | -2.15 | 6.5% |
| SSO | ProShares Ultra S&P500 | | 70.66 | 26 | -1.24 | -4.07 | 8.59% |
| UPRO | ProShares UltraPro S&P500 | | 61.26 | 26 | -1.78 | -6.04 | 11.91% |
| SPXL | Direxion Daily S&P500 Bull 3X ETF | | 116.35 | 36 | -1.96 | -6.05 | 11.89% |
| SH | ProShares Short S&P500 | | 12.44 | 74 | 0.57 | 2.05 | -4.23% |
| SDS | ProShares UltraShort S&P500 | | 27.27 | 74 | 1.26 | 4.2 | -8.86% |
| SPXU | ProShares UltraPro Short S&P500 | | 37.07 | 74 | 1.90 | 6.34 | -13.79% |
| SPXS | Direxion Daily S&P 500 Bear 3X ETF | | 10.01 | 64 | 1.83 | 6.26 | -13.33% |
| 12Stocks.com: Charts, Trends, Fundamental Data and Performances of S&P 500 Stocks | |
|
We now take in-depth look at all S&P 500 stocks including charts, multi-period performances and overall trends (as measured by Smart Investing & Trading Score). One can sort S&P 500 stocks (click link to choose) by Daily, Weekly and by Year-to-Date performances. Also, one can sort by size of the company or by market capitalization. |
| Select Your Default Chart Type: | |||||
| |||||
| Click on stock symbol or name for detailed view. Click on to add stock symbol to your watchlist and to view watchlist. Quick View: Move mouse or cursor over "Daily" to quickly view daily technical stock chart and over "Weekly" to view weekly technical stock chart. | |||||

 | MDLZ Mondelez International, Inc. |
| Sector: Consumer Staples | |
| SubSector: Confectioners | |
| MarketCap: 68385.8 Millions | |
| Recent Price: 66.51 Smart Investing & Trading Score: 25 | |
| Day Percent Change: 0.80% Day Change: 0.53 | |
| Week Change: -0.27% Year-to-date Change: -8.2% | |
| MDLZ Links: Profile News Message Board | |
| Charts:- Daily , Weekly | |
| Add MDLZ to Watchlist: View: Get MDLZ Trend Analysis ➞ | |
 | MRK Merck & Co., Inc. |
| Sector: Health Care | |
| SubSector: Drug Manufacturers - Major | |
| MarketCap: 192657 Millions | |
| Recent Price: 125.37 Smart Investing & Trading Score: 49 | |
| Day Percent Change: 0.25% Day Change: 0.31 | |
| Week Change: -0.29% Year-to-date Change: 15.0% | |
| MRK Links: Profile News Message Board | |
| Charts:- Daily , Weekly | |
| Add MRK to Watchlist: View: Get MRK Trend Analysis ➞ | |
 | CFG Citizens Financial Group, Inc. |
| Sector: Financials | |
| SubSector: Regional - Mid-Atlantic Banks | |
| MarketCap: 8225.19 Millions | |
| Recent Price: 33.02 Smart Investing & Trading Score: 61 | |
| Day Percent Change: 1.88% Day Change: 0.61 | |
| Week Change: -0.36% Year-to-date Change: -0.4% | |
| CFG Links: Profile News Message Board | |
| Charts:- Daily , Weekly | |
| Add CFG to Watchlist: View: Get CFG Trend Analysis ➞ | |
 | PNW Pinnacle West Capital Corporation |
| Sector: Utilities | |
| SubSector: Electric Utilities | |
| MarketCap: 8240.24 Millions | |
| Recent Price: 71.97 Smart Investing & Trading Score: 61 | |
| Day Percent Change: 1.07% Day Change: 0.76 | |
| Week Change: -0.37% Year-to-date Change: 0.2% | |
| PNW Links: Profile News Message Board | |
| Charts:- Daily , Weekly | |
| Add PNW to Watchlist: View: Get PNW Trend Analysis ➞ | |
 | MMM 3M Company |
| Sector: Industrials | |
| SubSector: Diversified Machinery | |
| MarketCap: 79237.7 Millions | |
| Recent Price: 90.96 Smart Investing & Trading Score: 25 | |
| Day Percent Change: -0.10% Day Change: -0.09 | |
| Week Change: -0.38% Year-to-date Change: -16.8% | |
| MMM Links: Profile News Message Board | |
| Charts:- Daily , Weekly | |
| Add MMM to Watchlist: View: Get MMM Trend Analysis ➞ | |
 | TXN Texas Instruments Incorporated |
| Sector: Technology | |
| SubSector: Semiconductor - Broad Line | |
| MarketCap: 99509.1 Millions | |
| Recent Price: 165.70 Smart Investing & Trading Score: 44 | |
| Day Percent Change: -1.13% Day Change: -1.89 | |
| Week Change: -0.38% Year-to-date Change: -2.8% | |
| TXN Links: Profile News Message Board | |
| Charts:- Daily , Weekly | |
| Add TXN to Watchlist: View: Get TXN Trend Analysis ➞ | |
 | CF CF Industries Holdings, Inc. |
| Sector: Materials | |
| SubSector: Agricultural Chemicals | |
| MarketCap: 5581.89 Millions | |
| Recent Price: 77.80 Smart Investing & Trading Score: 54 | |
| Day Percent Change: 0.06% Day Change: 0.05 | |
| Week Change: -0.38% Year-to-date Change: -2.1% | |
| CF Links: Profile News Message Board | |
| Charts:- Daily , Weekly | |
| Add CF to Watchlist: View: Get CF Trend Analysis ➞ | |
 | REGN Regeneron Pharmaceuticals, Inc. |
| Sector: Health Care | |
| SubSector: Biotechnology | |
| MarketCap: 51903.7 Millions | |
| Recent Price: 901.19 Smart Investing & Trading Score: 25 | |
| Day Percent Change: 0.79% Day Change: 7.05 | |
| Week Change: -0.39% Year-to-date Change: 2.6% | |
| REGN Links: Profile News Message Board | |
| Charts:- Daily , Weekly | |
| Add REGN to Watchlist: View: Get REGN Trend Analysis ➞ | |
 | ADP Automatic Data Processing, Inc. |
| Sector: Technology | |
| SubSector: Business Software & Services | |
| MarketCap: 54966.5 Millions | |
| Recent Price: 242.90 Smart Investing & Trading Score: 8 | |
| Day Percent Change: -0.54% Day Change: -1.31 | |
| Week Change: -0.39% Year-to-date Change: 4.3% | |
| ADP Links: Profile News Message Board | |
| Charts:- Daily , Weekly | |
| Add ADP to Watchlist: View: Get ADP Trend Analysis ➞ | |
 | LVS Las Vegas Sands Corp. |
| Sector: Services & Goods | |
| SubSector: Resorts & Casinos | |
| MarketCap: 36431.6 Millions | |
| Recent Price: 50.23 Smart Investing & Trading Score: 41 | |
| Day Percent Change: -0.55% Day Change: -0.28 | |
| Week Change: -0.4% Year-to-date Change: 2.1% | |
| LVS Links: Profile News Message Board | |
| Charts:- Daily , Weekly | |
| Add LVS to Watchlist: View: Get LVS Trend Analysis ➞ | |
 | DUK Duke Energy Corporation |
| Sector: Utilities | |
| SubSector: Electric Utilities | |
| MarketCap: 56678.2 Millions | |
| Recent Price: 94.50 Smart Investing & Trading Score: 35 | |
| Day Percent Change: 1.76% Day Change: 1.63 | |
| Week Change: -0.42% Year-to-date Change: -2.6% | |
| DUK Links: Profile News Message Board | |
| Charts:- Daily , Weekly | |
| Add DUK to Watchlist: View: Get DUK Trend Analysis ➞ | |
 | CTVA Corteva, Inc. |
| Sector: Materials | |
| SubSector: Agricultural Chemicals | |
| MarketCap: 18894.3 Millions | |
| Recent Price: 53.53 Smart Investing & Trading Score: 61 | |
| Day Percent Change: 0.39% Day Change: 0.21 | |
| Week Change: -0.43% Year-to-date Change: 11.7% | |
| CTVA Links: Profile News Message Board | |
| Charts:- Daily , Weekly | |
| Add CTVA to Watchlist: View: Get CTVA Trend Analysis ➞ | |
 | MCO Moody s Corporation |
| Sector: Services & Goods | |
| SubSector: Business Services | |
| MarketCap: 35998.5 Millions | |
| Recent Price: 375.41 Smart Investing & Trading Score: 25 | |
| Day Percent Change: 1.26% Day Change: 4.68 | |
| Week Change: -0.46% Year-to-date Change: -3.9% | |
| MCO Links: Profile News Message Board | |
| Charts:- Daily , Weekly | |
| Add MCO to Watchlist: View: Get MCO Trend Analysis ➞ | |
 | JNPR Juniper Networks, Inc. |
| Sector: Technology | |
| SubSector: Communication Equipment | |
| MarketCap: 6161.49 Millions | |
| Recent Price: 36.48 Smart Investing & Trading Score: 28 | |
| Day Percent Change: 0.14% Day Change: 0.05 | |
| Week Change: -0.46% Year-to-date Change: 23.7% | |
| JNPR Links: Profile News Message Board | |
| Charts:- Daily , Weekly | |
| Add JNPR to Watchlist: View: Get JNPR Trend Analysis ➞ | |
 | AMP Ameriprise Financial, Inc. |
| Sector: Financials | |
| SubSector: Asset Management | |
| MarketCap: 13270.5 Millions | |
| Recent Price: 411.77 Smart Investing & Trading Score: 51 | |
| Day Percent Change: 0.22% Day Change: 0.92 | |
| Week Change: -0.47% Year-to-date Change: 8.4% | |
| AMP Links: Profile News Message Board | |
| Charts:- Daily , Weekly | |
| Add AMP to Watchlist: View: Get AMP Trend Analysis ➞ | |
 | ES Eversource Energy |
| Sector: Utilities | |
| SubSector: Diversified Utilities | |
| MarketCap: 23963.4 Millions | |
| Recent Price: 58.51 Smart Investing & Trading Score: 43 | |
| Day Percent Change: 2.29% Day Change: 1.31 | |
| Week Change: -0.48% Year-to-date Change: -5.2% | |
| ES Links: Profile News Message Board | |
| Charts:- Daily , Weekly | |
| Add ES to Watchlist: View: Get ES Trend Analysis ➞ | |
 | RJF Raymond James Financial, Inc. |
| Sector: Financials | |
| SubSector: Investment Brokerage - Regional | |
| MarketCap: 9490.65 Millions | |
| Recent Price: 121.94 Smart Investing & Trading Score: 61 | |
| Day Percent Change: 0.06% Day Change: 0.07 | |
| Week Change: -0.5% Year-to-date Change: 9.4% | |
| RJF Links: Profile News Message Board | |
| Charts:- Daily , Weekly | |
| Add RJF to Watchlist: View: Get RJF Trend Analysis ➞ | |
 | CME CME Group Inc. |
| Sector: Financials | |
| SubSector: Investment Brokerage - National | |
| MarketCap: 64145 Millions | |
| Recent Price: 208.42 Smart Investing & Trading Score: 51 | |
| Day Percent Change: 0.94% Day Change: 1.94 | |
| Week Change: -0.52% Year-to-date Change: -1.0% | |
| CME Links: Profile News Message Board | |
| Charts:- Daily , Weekly | |
| Add CME to Watchlist: View: Get CME Trend Analysis ➞ | |
 | EL The Estee Lauder Companies Inc. |
| Sector: Consumer Staples | |
| SubSector: Personal Products | |
| MarketCap: 59521.1 Millions | |
| Recent Price: 138.04 Smart Investing & Trading Score: 61 | |
| Day Percent Change: 0.81% Day Change: 1.11 | |
| Week Change: -0.55% Year-to-date Change: -5.6% | |
| EL Links: Profile News Message Board | |
| Charts:- Daily , Weekly | |
| Add EL to Watchlist: View: Get EL Trend Analysis ➞ | |
 | IPG The Interpublic Group of Companies, Inc. |
| Sector: Services & Goods | |
| SubSector: Advertising Agencies | |
| MarketCap: 5730.55 Millions | |
| Recent Price: 30.27 Smart Investing & Trading Score: 25 | |
| Day Percent Change: -0.26% Day Change: -0.08 | |
| Week Change: -0.59% Year-to-date Change: -7.3% | |
| IPG Links: Profile News Message Board | |
| Charts:- Daily , Weekly | |
| Add IPG to Watchlist: View: Get IPG Trend Analysis ➞ | |
 | CTLT Catalent, Inc. |
| Sector: Health Care | |
| SubSector: Drugs - Generic | |
| MarketCap: 6351.95 Millions | |
| Recent Price: 55.96 Smart Investing & Trading Score: 44 | |
| Day Percent Change: 0.32% Day Change: 0.18 | |
| Week Change: -0.6% Year-to-date Change: 24.6% | |
| CTLT Links: Profile News Message Board | |
| Charts:- Daily , Weekly | |
| Add CTLT to Watchlist: View: Get CTLT Trend Analysis ➞ | |
 | LHX L3Harris Technologies, Inc. |
| Sector: Technology | |
| SubSector: Communication Equipment | |
| MarketCap: 37906.1 Millions | |
| Recent Price: 201.40 Smart Investing & Trading Score: 18 | |
| Day Percent Change: 0.53% Day Change: 1.06 | |
| Week Change: -0.6% Year-to-date Change: -4.4% | |
| LHX Links: Profile News Message Board | |
| Charts:- Daily , Weekly | |
| Add LHX to Watchlist: View: Get LHX Trend Analysis ➞ | |
 | PANW Palo Alto Networks, Inc. |
| Sector: Technology | |
| SubSector: Networking & Communication Devices | |
| MarketCap: 16039.4 Millions | |
| Recent Price: 277.33 Smart Investing & Trading Score: 30 | |
| Day Percent Change: 0.84% Day Change: 2.31 | |
| Week Change: -0.62% Year-to-date Change: -6.0% | |
| PANW Links: Profile News Message Board | |
| Charts:- Daily , Weekly | |
| Add PANW to Watchlist: View: Get PANW Trend Analysis ➞ | |
 | ABNB Airbnb, Inc. |
| Sector: Technology | |
| SubSector: Internet Content & Information | |
| MarketCap: 86237 Millions | |
| Recent Price: 158.37 Smart Investing & Trading Score: 56 | |
| Day Percent Change: 1.09% Day Change: 1.71 | |
| Week Change: -0.63% Year-to-date Change: 16.3% | |
| ABNB Links: Profile News Message Board | |
| Charts:- Daily , Weekly | |
| Add ABNB to Watchlist: View: Get ABNB Trend Analysis ➞ | |
 | GPN Global Payments Inc. |
| Sector: Services & Goods | |
| SubSector: Business Services | |
| MarketCap: 39068.8 Millions | |
| Recent Price: 122.95 Smart Investing & Trading Score: 18 | |
| Day Percent Change: -0.39% Day Change: -0.48 | |
| Week Change: -0.64% Year-to-date Change: -3.2% | |
| GPN Links: Profile News Message Board | |
| Charts:- Daily , Weekly | |
| Add GPN to Watchlist: View: Get GPN Trend Analysis ➞ | |
| For tabular summary view of above stock list: Summary View ➞ 0 - 25 , 25 - 50 , 50 - 75 , 75 - 100 , 100 - 125 , 125 - 150 , 150 - 175 , 175 - 200 , 200 - 225 , 225 - 250 , 250 - 275 , 275 - 300 , 300 - 325 , 325 - 350 , 350 - 375 , 375 - 400 , 400 - 425 , 425 - 450 , 450 - 475 , 475 - 500 | ||
| Click To Change The Sort Order: By Market Cap or Company Size Performance: Year-to-date, Week and Day | |
| Select Chart Type: | ||
|
Best Stocks Today 12Stocks.com |
© 2024 12Stocks.com Terms & Conditions Privacy Contact Us
All Information Provided Only For Education And Not To Be Used For Investing or Trading. See Terms & Conditions


One More Thing ... Get Best Stocks Delivered Daily!
Never Ever Miss A Move With Our Top Ten Stocks Lists
Find Best Stocks In Any Market - Bull or Bear Market
Take A Peek At Our Top Ten Stocks Lists: Daily, Weekly, Year-to-Date & Top Trends
Find Best Stocks In Any Market - Bull or Bear Market
Take A Peek At Our Top Ten Stocks Lists: Daily, Weekly, Year-to-Date & Top Trends
S&P 500 Stocks With Best Up Trends [0-bearish to 100-bullish]: United Airlines[100], Conagra Brands[95], Bunge [93], Charles Schwab[88], Lockheed Martin[86], Progressive [83], NextEra [81], Newmont [76], Google [75], Google [75], Yum! Brands[75]
Best S&P 500 Stocks Year-to-Date:
NVIDIA [69.69%], Constellation [58.3%], NRG [42.01%], Meta Platforms[39.59%], Marathon [36.47%], Micron [36.31%], Western Digital[33.99%], Progressive [31.29%], Diamondback [29.71%], Targa Resources[29.19%], Eaton [28.8%] Best S&P 500 Stocks This Week:
United Airlines[16.6%], UnitedHealth [9.06%], Globe Life[7.01%], ProShares UltraPro[6.34%], American Airlines[5.63%], Morgan Stanley[4.51%], Southwest Airlines[4.5%], Goldman Sachs[3.7%], Charles Schwab[3.53%], General Mills[3.49%], Humana [3.48%] Best S&P 500 Stocks Daily:
United Airlines[17.45%], American Airlines[6.60%], Globe Life[5.44%], NextEra [3.39%], Consolidated Edison[3.33%], Norwegian Cruise[3.15%], Dominion [3.12%], Southern [3.00%], Delta Air[2.86%], First Solar[2.85%], Southwest Airlines[2.60%]