
 Login Sign Up


| |||||
 |  | ||||

| 12Stocks.com Market Intelligence |
Best S&P 500 Stocks
|
On this page, you will find the most comprehensive analysis of S&P 500 stocks and ETFs - from latest trends to performances to charts ➞. First, here are the year-to-date (YTD) performances of the most requested S&P 500 stocks at 12Stocks.com (click stock for review):
| NVIDIA 66% | ||
| Caterpillar 23% | ||
| Amazon.com 17% | ||
| Merck 17% | ||
| Google 13% | ||
| JPMorgan Chase 13% | ||
| Walmart 12% | ||
| Goldman Sachs 9% | ||
| Chevron 8% | ||
| Microsoft 8% | ||
| Johnson & Johnson -5% | ||
| McDonald s -7% | ||
| Starbucks -8% | ||
| Apple -13% | ||
| Gilead -17% | ||
| Intel -31% | ||
| Boeing -35% | ||
| Quick: S&P 500 Stocks Lists: Performances & Trends, S&P 500 Stock Charts
Sort S&P 500 stocks: Daily, Weekly, Year-to-Date, Market Cap & Trends. Filter S&P 500 stocks list by sector: Show all, Tech, Finance, Energy, Staples, Retail, Industrial, Materials, Utilities and HealthCare |
| 12Stocks.com S&P 500 Stocks Performances & Trends Daily Report | |||||||||
|
| 
The overall Smart Investing & Trading Score is 58 (0-bearish to 100-bullish) which puts S&P 500 index in short term neutral trend. The Smart Investing & Trading Score from previous trading session is 51 and hence an improvement of trend. | ||||||||
Here are the Smart Investing & Trading Scores of the most requested S&P 500 stocks at 12Stocks.com (click stock name for detailed review):
|


| 12Stocks.com: Top Performing S&P 500 Index Stocks | ||||||||||||||||||||||||||||||||||||||||||||||||
 The top performing S&P 500 Index stocks year to date are
Now, more recently, over last week, the top performing S&P 500 Index stocks on the move are


|
||||||||||||||||||||||||||||||||||||||||||||||||
| 12Stocks.com: Investing in S&P 500 Index with Stocks | |
|
The following table helps investors and traders sort through current performance and trends (as measured by Smart Investing & Trading Score) of various
stocks in the S&P 500 Index. Quick View: Move mouse or cursor over stock symbol (ticker) to view short-term technical chart and over stock name to view long term chart. Click on  to add stock symbol to your watchlist and to add stock symbol to your watchlist and  to view watchlist. Click on any ticker or stock name for detailed market intelligence report for that stock. to view watchlist. Click on any ticker or stock name for detailed market intelligence report for that stock. |
12Stocks.com Performance of Stocks in S&P 500 Index
| Ticker | Stock Name | Watchlist | Category | Recent Price | Smart Investing & Trading Score | Change % | Weekly Change% |
| HII | Huntington Ingalls |   | Industrials | 276.28 | 58 | 0.65% | 1.70% |
| MDT | Medtronic | | Health Care | 80.83 | 32 | 0.32% | 1.69% |
| MMM | 3M | | Industrials | 93.82 | 82 | 1.30% | 1.68% |
| SBAC | SBA | | Technology | 199.36 | 42 | 1.30% | 1.68% |
| EIX | Edison | | Utilities | 71.10 | 93 | 0.62% | 1.67% |
| USB | U.S. Bancorp | | Financials | 41.12 | 37 | 0.17% | 1.66% |
| EW | Edwards Life | | Health Care | 87.36 | 68 | 0.47% | 1.66% |
| PSX | Phillips 66 | | Energy | 157.28 | 68 | 0.14% | 1.66% |
| DTE | DTE | | Utilities | 110.36 | 100 | 0.22% | 1.65% |
| EXR | Extra Space | | Financials | 134.63 | 35 | 1.42% | 1.64% |
| MET | MetLife | | Financials | 72.26 | 75 | 0.42% | 1.62% |
| SWK | Stanley Black | | Industrials | 90.77 | 37 | 1.59% | 1.62% |
| NRG | NRG | | Utilities | 71.11 | 68 | 1.02% | 1.62% |
| LYV | Live Nation | | Services & Goods | 91.41 | 58 | 3.35% | 1.61% |
| CSGP | CoStar | | Financials | 85.61 | 58 | 0.35% | 1.60% |
| IFF | Flavors | | Materials | 85.30 | 95 | 0.48% | 1.58% |
| EQIX | Equinix | | Financials | 759.80 | 32 | 0.67% | 1.58% |
| MCD | McDonald s | | Services & Goods | 276.24 | 64 | 0.24% | 1.56% |
| GD | General Dynamics | | Industrials | 293.08 | 83 | 0.61% | 1.55% |
| PAYX | Paychex | | Services & Goods | 121.38 | 65 | 0.12% | 1.55% |
| INVH | Invitation Homes | | Financials | 34.09 | 68 | 0.92% | 1.55% |
| PEG | Public Service | | Utilities | 66.75 | 88 | 0.06% | 1.54% |
| HRL | Hormel Foods | | Consumer Staples | 35.27 | 95 | 0.37% | 1.53% |
| MKC | McCormick & | | Consumer Staples | 75.05 | 88 | 0.48% | 1.53% |
| ZTS | Zoetis | | Health Care | 148.72 | 20 | 2.18% | 1.52% |
| For chart view version of above stock list: Chart View ➞ 0 - 25 , 25 - 50 , 50 - 75 , 75 - 100 , 100 - 125 , 125 - 150 , 150 - 175 , 175 - 200 , 200 - 225 , 225 - 250 , 250 - 275 , 275 - 300 , 300 - 325 , 325 - 350 , 350 - 375 , 375 - 400 , 400 - 425 , 425 - 450 , 450 - 475 | ||
 | Click To Change The Sort Order: By Market Cap or Company Size Performance: Year-to-date, Week and Day |  |
|
Get the most comprehensive stock market coverage daily at 12Stocks.com ➞ Best Stocks Today ➞ Best Stocks Weekly ➞ Best Stocks Year-to-Date ➞ Best Stocks Trends ➞  Best Stocks Today 12Stocks.com Best Nasdaq Stocks ➞ Best S&P 500 Stocks ➞ Best Tech Stocks ➞ Best Biotech Stocks ➞ |
| Detailed Overview of S&P 500 Stocks |
| S&P 500 Technical Overview, Leaders & Laggards, Top S&P 500 ETF Funds & Detailed S&P 500 Stocks List, Charts, Trends & More |
| S&P 500: Technical Analysis, Trends & YTD Performance | |
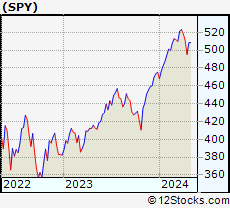
| S&P 500 index as represented by
SPY, an exchange-traded fund [ETF], holds basket of five hundred (mostly largecap) stocks from across all major sectors of the US stock market. The S&P 500 index (contains stocks like Apple and Exxon) is up by 6.12% and is currently outperforming the overall market by 0.63% year-to-date. Below is a quick view of technical charts and trends: | |
 SPY Weekly Chart |
|
| Long Term Trend: Good | |
| Medium Term Trend: Not Good | |
 SPY Daily Chart |
|
| Short Term Trend: Very Good | |
| Overall Trend Score: 58 | |
| YTD Performance: 6.12% | |
| **Trend Scores & Views Are Only For Educational Purposes And Not For Investing | |
| 12Stocks.com: Investing in S&P 500 Index using Exchange Traded Funds | |
|
The following table shows list of key exchange traded funds (ETF) that
help investors track S&P 500 index. The following list also includes leveraged ETF funds that track twice or thrice the daily returns of S&P 500 indices. Short or inverse ETF funds move in the opposite direction to the index they track and are useful during market pullbacks or during bear markets. Quick View: Move mouse or cursor over ETF symbol (ticker) to view short-term technical chart and over ETF name to view long term chart. Click on ticker or stock name for detailed view. Click on to add stock symbol to your watchlist and to view watchlist. |
12Stocks.com List of ETFs that track S&P 500 Index
| Ticker | ETF Name | Watchlist | Recent Price | Smart Investing & Trading Score | Change % | Week % | Year-to-date % |
| SPY | SPDR S&P 500 ETF | | 504.40 | 58 | 0.94 | 1.87 | 6.12% |
| IVV | iShares Core S&P 500 ETF | | 506.60 | 58 | 1.69 | 1.82 | 6.06% |
| VOO | Vanguard 500 ETF | | 463.37 | 58 | 1.70 | 1.82 | 6.08% |
| OEF | iShares S&P 100 | | 239.30 | 51 | 1.05 | 1.97 | 7.12% |
| SSO | ProShares Ultra S&P500 | | 71.67 | 58 | 1.91 | 3.7 | 10.14% |
| UPRO | ProShares UltraPro S&P500 | | 62.46 | 58 | 2.81 | 5.58 | 14.1% |
| SPXL | Direxion Daily S&P500 Bull 3X ETF | | 118.62 | 58 | 2.75 | 5.39 | 14.07% |
| SH | ProShares Short S&P500 | | 12.35 | 42 | -1.12 | -1.91 | -4.93% |
| SDS | ProShares UltraShort S&P500 | | 26.81 | 37 | -2.19 | -3.91 | -10.39% |
| SPXU | ProShares UltraPro Short S&P500 | | 36.10 | 42 | -3.31 | -5.8 | -16.03% |
| SPXS | Direxion Daily S&P 500 Bear 3X ETF | | 9.82 | 32 | -4.75 | -5.21 | -14.98% |
| 12Stocks.com: Charts, Trends, Fundamental Data and Performances of S&P 500 Stocks | |
|
We now take in-depth look at all S&P 500 stocks including charts, multi-period performances and overall trends (as measured by Smart Investing & Trading Score). One can sort S&P 500 stocks (click link to choose) by Daily, Weekly and by Year-to-Date performances. Also, one can sort by size of the company or by market capitalization. |
| Select Your Default Chart Type: | |||||
| |||||
| Click on stock symbol or name for detailed view. Click on to add stock symbol to your watchlist and to view watchlist. Quick View: Move mouse or cursor over "Daily" to quickly view daily technical stock chart and over "Weekly" to view weekly technical stock chart. | |||||

 | HII Huntington Ingalls Industries, Inc. |
| Sector: Industrials | |
| SubSector: Aerospace/Defense Products & Services | |
| MarketCap: 7276.11 Millions | |
| Recent Price: 276.28 Smart Investing & Trading Score: 58 | |
| Day Percent Change: 0.65% Day Change: 1.79 | |
| Week Change: 1.7% Year-to-date Change: 6.4% | |
| HII Links: Profile News Message Board | |
| Charts:- Daily , Weekly | |
| Add HII to Watchlist: View: Get HII Trend Analysis ➞ | |
 | MDT Medtronic plc |
| Sector: Health Care | |
| SubSector: Medical Appliances & Equipment | |
| MarketCap: 113698 Millions | |
| Recent Price: 80.83 Smart Investing & Trading Score: 32 | |
| Day Percent Change: 0.32% Day Change: 0.26 | |
| Week Change: 1.69% Year-to-date Change: -1.9% | |
| MDT Links: Profile News Message Board | |
| Charts:- Daily , Weekly | |
| Add MDT to Watchlist: View: Get MDT Trend Analysis ➞ | |
 | MMM 3M Company |
| Sector: Industrials | |
| SubSector: Diversified Machinery | |
| MarketCap: 79237.7 Millions | |
| Recent Price: 93.82 Smart Investing & Trading Score: 82 | |
| Day Percent Change: 1.30% Day Change: 1.20 | |
| Week Change: 1.68% Year-to-date Change: -14.2% | |
| MMM Links: Profile News Message Board | |
| Charts:- Daily , Weekly | |
| Add MMM to Watchlist: View: Get MMM Trend Analysis ➞ | |
 | SBAC SBA Communications Corporation |
| Sector: Technology | |
| SubSector: Diversified Communication Services | |
| MarketCap: 26712.3 Millions | |
| Recent Price: 199.36 Smart Investing & Trading Score: 42 | |
| Day Percent Change: 1.30% Day Change: 2.56 | |
| Week Change: 1.68% Year-to-date Change: -21.4% | |
| SBAC Links: Profile News Message Board | |
| Charts:- Daily , Weekly | |
| Add SBAC to Watchlist: View: Get SBAC Trend Analysis ➞ | |
 | EIX Edison International |
| Sector: Utilities | |
| SubSector: Electric Utilities | |
| MarketCap: 19358.1 Millions | |
| Recent Price: 71.10 Smart Investing & Trading Score: 93 | |
| Day Percent Change: 0.62% Day Change: 0.44 | |
| Week Change: 1.67% Year-to-date Change: -0.6% | |
| EIX Links: Profile News Message Board | |
| Charts:- Daily , Weekly | |
| Add EIX to Watchlist: View: Get EIX Trend Analysis ➞ | |
 | USB U.S. Bancorp |
| Sector: Financials | |
| SubSector: Regional - Midwest Banks | |
| MarketCap: 56757.8 Millions | |
| Recent Price: 41.12 Smart Investing & Trading Score: 37 | |
| Day Percent Change: 0.17% Day Change: 0.07 | |
| Week Change: 1.66% Year-to-date Change: -5.0% | |
| USB Links: Profile News Message Board | |
| Charts:- Daily , Weekly | |
| Add USB to Watchlist: View: Get USB Trend Analysis ➞ | |
 | EW Edwards Lifesciences Corporation |
| Sector: Health Care | |
| SubSector: Medical Appliances & Equipment | |
| MarketCap: 36735.5 Millions | |
| Recent Price: 87.36 Smart Investing & Trading Score: 68 | |
| Day Percent Change: 0.47% Day Change: 0.41 | |
| Week Change: 1.66% Year-to-date Change: 14.6% | |
| EW Links: Profile News Message Board | |
| Charts:- Daily , Weekly | |
| Add EW to Watchlist: View: Get EW Trend Analysis ➞ | |
 | PSX Phillips 66 |
| Sector: Energy | |
| SubSector: Oil & Gas Refining & Marketing | |
| MarketCap: 25253.6 Millions | |
| Recent Price: 157.28 Smart Investing & Trading Score: 68 | |
| Day Percent Change: 0.14% Day Change: 0.22 | |
| Week Change: 1.66% Year-to-date Change: 18.1% | |
| PSX Links: Profile News Message Board | |
| Charts:- Daily , Weekly | |
| Add PSX to Watchlist: View: Get PSX Trend Analysis ➞ | |
 | DTE DTE Energy Company |
| Sector: Utilities | |
| SubSector: Electric Utilities | |
| MarketCap: 18218.1 Millions | |
| Recent Price: 110.36 Smart Investing & Trading Score: 100 | |
| Day Percent Change: 0.22% Day Change: 0.24 | |
| Week Change: 1.65% Year-to-date Change: 0.1% | |
| DTE Links: Profile News Message Board | |
| Charts:- Daily , Weekly | |
| Add DTE to Watchlist: View: Get DTE Trend Analysis ➞ | |
 | EXR Extra Space Storage Inc. |
| Sector: Financials | |
| SubSector: REIT - Industrial | |
| MarketCap: 11203.9 Millions | |
| Recent Price: 134.63 Smart Investing & Trading Score: 35 | |
| Day Percent Change: 1.42% Day Change: 1.89 | |
| Week Change: 1.64% Year-to-date Change: -16.0% | |
| EXR Links: Profile News Message Board | |
| Charts:- Daily , Weekly | |
| Add EXR to Watchlist: View: Get EXR Trend Analysis ➞ | |
 | MET MetLife, Inc. |
| Sector: Financials | |
| SubSector: Life Insurance | |
| MarketCap: 26272.9 Millions | |
| Recent Price: 72.26 Smart Investing & Trading Score: 75 | |
| Day Percent Change: 0.42% Day Change: 0.30 | |
| Week Change: 1.62% Year-to-date Change: 9.3% | |
| MET Links: Profile News Message Board | |
| Charts:- Daily , Weekly | |
| Add MET to Watchlist: View: Get MET Trend Analysis ➞ | |
 | SWK Stanley Black & Decker, Inc. |
| Sector: Industrials | |
| SubSector: Machine Tools & Accessories | |
| MarketCap: 14274.8 Millions | |
| Recent Price: 90.77 Smart Investing & Trading Score: 37 | |
| Day Percent Change: 1.59% Day Change: 1.42 | |
| Week Change: 1.62% Year-to-date Change: -7.5% | |
| SWK Links: Profile News Message Board | |
| Charts:- Daily , Weekly | |
| Add SWK to Watchlist: View: Get SWK Trend Analysis ➞ | |
 | NRG NRG Energy, Inc. |
| Sector: Utilities | |
| SubSector: Diversified Utilities | |
| MarketCap: 6510.7 Millions | |
| Recent Price: 71.11 Smart Investing & Trading Score: 68 | |
| Day Percent Change: 1.02% Day Change: 0.72 | |
| Week Change: 1.62% Year-to-date Change: 37.5% | |
| NRG Links: Profile News Message Board | |
| Charts:- Daily , Weekly | |
| Add NRG to Watchlist: View: Get NRG Trend Analysis ➞ | |
 | LYV Live Nation Entertainment, Inc. |
| Sector: Services & Goods | |
| SubSector: Entertainment - Diversified | |
| MarketCap: 8457.17 Millions | |
| Recent Price: 91.41 Smart Investing & Trading Score: 58 | |
| Day Percent Change: 3.35% Day Change: 2.96 | |
| Week Change: 1.61% Year-to-date Change: -2.3% | |
| LYV Links: Profile News Message Board | |
| Charts:- Daily , Weekly | |
| Add LYV to Watchlist: View: Get LYV Trend Analysis ➞ | |
 | CSGP CoStar Group, Inc. |
| Sector: Financials | |
| SubSector: Property Management | |
| MarketCap: 21454.4 Millions | |
| Recent Price: 85.61 Smart Investing & Trading Score: 58 | |
| Day Percent Change: 0.35% Day Change: 0.30 | |
| Week Change: 1.6% Year-to-date Change: -2.0% | |
| CSGP Links: Profile News Message Board | |
| Charts:- Daily , Weekly | |
| Add CSGP to Watchlist: View: Get CSGP Trend Analysis ➞ | |
 | IFF International Flavors & Fragrances Inc. |
| Sector: Materials | |
| SubSector: Specialty Chemicals | |
| MarketCap: 12178.7 Millions | |
| Recent Price: 85.30 Smart Investing & Trading Score: 95 | |
| Day Percent Change: 0.48% Day Change: 0.41 | |
| Week Change: 1.58% Year-to-date Change: 5.3% | |
| IFF Links: Profile News Message Board | |
| Charts:- Daily , Weekly | |
| Add IFF to Watchlist: View: Get IFF Trend Analysis ➞ | |
 | EQIX Equinix, Inc. (REIT) |
| Sector: Financials | |
| SubSector: REIT - Diversified | |
| MarketCap: 45855.3 Millions | |
| Recent Price: 759.80 Smart Investing & Trading Score: 32 | |
| Day Percent Change: 0.67% Day Change: 5.06 | |
| Week Change: 1.58% Year-to-date Change: -5.7% | |
| EQIX Links: Profile News Message Board | |
| Charts:- Daily , Weekly | |
| Add EQIX to Watchlist: View: Get EQIX Trend Analysis ➞ | |
 | MCD McDonald s Corporation |
| Sector: Services & Goods | |
| SubSector: Restaurants | |
| MarketCap: 122481 Millions | |
| Recent Price: 276.24 Smart Investing & Trading Score: 64 | |
| Day Percent Change: 0.24% Day Change: 0.66 | |
| Week Change: 1.56% Year-to-date Change: -6.8% | |
| MCD Links: Profile News Message Board | |
| Charts:- Daily , Weekly | |
| Add MCD to Watchlist: View: Get MCD Trend Analysis ➞ | |
 | GD General Dynamics Corporation |
| Sector: Industrials | |
| SubSector: Aerospace/Defense Products & Services | |
| MarketCap: 37063.8 Millions | |
| Recent Price: 293.08 Smart Investing & Trading Score: 83 | |
| Day Percent Change: 0.61% Day Change: 1.77 | |
| Week Change: 1.55% Year-to-date Change: 12.9% | |
| GD Links: Profile News Message Board | |
| Charts:- Daily , Weekly | |
| Add GD to Watchlist: View: Get GD Trend Analysis ➞ | |
 | PAYX Paychex, Inc. |
| Sector: Services & Goods | |
| SubSector: Staffing & Outsourcing Services | |
| MarketCap: 20928.8 Millions | |
| Recent Price: 121.38 Smart Investing & Trading Score: 65 | |
| Day Percent Change: 0.12% Day Change: 0.14 | |
| Week Change: 1.55% Year-to-date Change: 1.9% | |
| PAYX Links: Profile News Message Board | |
| Charts:- Daily , Weekly | |
| Add PAYX to Watchlist: View: Get PAYX Trend Analysis ➞ | |
 | INVH Invitation Homes Inc. |
| Sector: Financials | |
| SubSector: Real Estate Development | |
| MarketCap: 9782.89 Millions | |
| Recent Price: 34.09 Smart Investing & Trading Score: 68 | |
| Day Percent Change: 0.92% Day Change: 0.31 | |
| Week Change: 1.55% Year-to-date Change: -0.1% | |
| INVH Links: Profile News Message Board | |
| Charts:- Daily , Weekly | |
| Add INVH to Watchlist: View: Get INVH Trend Analysis ➞ | |
 | PEG Public Service Enterprise Group Incorporated |
| Sector: Utilities | |
| SubSector: Diversified Utilities | |
| MarketCap: 20886 Millions | |
| Recent Price: 66.75 Smart Investing & Trading Score: 88 | |
| Day Percent Change: 0.06% Day Change: 0.04 | |
| Week Change: 1.54% Year-to-date Change: 9.2% | |
| PEG Links: Profile News Message Board | |
| Charts:- Daily , Weekly | |
| Add PEG to Watchlist: View: Get PEG Trend Analysis ➞ | |
 | HRL Hormel Foods Corporation |
| Sector: Consumer Staples | |
| SubSector: Meat Products | |
| MarketCap: 25590.2 Millions | |
| Recent Price: 35.27 Smart Investing & Trading Score: 95 | |
| Day Percent Change: 0.37% Day Change: 0.13 | |
| Week Change: 1.53% Year-to-date Change: 9.8% | |
| HRL Links: Profile News Message Board | |
| Charts:- Daily , Weekly | |
| Add HRL to Watchlist: View: Get HRL Trend Analysis ➞ | |
 | MKC McCormick & Company, Incorporated |
| Sector: Consumer Staples | |
| SubSector: Processed & Packaged Goods | |
| MarketCap: 18522.8 Millions | |
| Recent Price: 75.05 Smart Investing & Trading Score: 88 | |
| Day Percent Change: 0.48% Day Change: 0.36 | |
| Week Change: 1.53% Year-to-date Change: 9.7% | |
| MKC Links: Profile News Message Board | |
| Charts:- Daily , Weekly | |
| Add MKC to Watchlist: View: Get MKC Trend Analysis ➞ | |
 | ZTS Zoetis Inc. |
| Sector: Health Care | |
| SubSector: Drugs - Generic | |
| MarketCap: 51921.5 Millions | |
| Recent Price: 148.72 Smart Investing & Trading Score: 20 | |
| Day Percent Change: 2.18% Day Change: 3.18 | |
| Week Change: 1.52% Year-to-date Change: -24.7% | |
| ZTS Links: Profile News Message Board | |
| Charts:- Daily , Weekly | |
| Add ZTS to Watchlist: View: Get ZTS Trend Analysis ➞ | |
| For tabular summary view of above stock list: Summary View ➞ 0 - 25 , 25 - 50 , 50 - 75 , 75 - 100 , 100 - 125 , 125 - 150 , 150 - 175 , 175 - 200 , 200 - 225 , 225 - 250 , 250 - 275 , 275 - 300 , 300 - 325 , 325 - 350 , 350 - 375 , 375 - 400 , 400 - 425 , 425 - 450 , 450 - 475 | ||
| Click To Change The Sort Order: By Market Cap or Company Size Performance: Year-to-date, Week and Day | |
| Select Chart Type: | ||
|
Best Stocks Today 12Stocks.com |
© 2024 12Stocks.com Terms & Conditions Privacy Contact Us
All Information Provided Only For Education And Not To Be Used For Investing or Trading. See Terms & Conditions


One More Thing ... Get Best Stocks Delivered Daily!
Never Ever Miss A Move With Our Top Ten Stocks Lists
Find Best Stocks In Any Market - Bull or Bear Market
Take A Peek At Our Top Ten Stocks Lists: Daily, Weekly, Year-to-Date & Top Trends
Find Best Stocks In Any Market - Bull or Bear Market
Take A Peek At Our Top Ten Stocks Lists: Daily, Weekly, Year-to-Date & Top Trends
S&P 500 Stocks With Best Up Trends [0-bearish to 100-bullish]: Danaher [100], Kimberly-Clark [100], Quest Diagnostics[100], Philip Morris[100], NextEra [100], Generac Holdings[100], American Express[100], Equity Residential[100], Bank of America[100], EQT [100], Essex Property[100]
Best S&P 500 Stocks Year-to-Date:
NVIDIA [65.78%], Constellation [59.81%], Meta Platforms[38.84%], NRG [37.53%], Progressive [33.94%], Marathon [32.82%], Targa Resources[31.85%], Western Digital[31.75%], Micron [30.88%], United Airlines[30.85%], Diamondback [30.11%] Best S&P 500 Stocks This Week:
NVIDIA [7.74%], General Electric[7.36%], Enphase [7.28%], Kimberly-Clark [7.12%], Danaher [7.03%], General Motors[6.87%], Ford Motor[6.63%], Quest Diagnostics[6.08%], Pulte [5.96%], Charles River[5.72%], Illumina [5.69%] Best S&P 500 Stocks Daily:
Danaher [6.77%], General Electric[5.83%], Kimberly-Clark [5.38%], General Motors[4.79%], Quest Diagnostics[4.74%], United Rentals[4.51%], Waters [4.22%], Thermo Fisher[4.00%], Builders FirstSource[3.92%], Norwegian Cruise[3.75%], Bio-Rad [3.61%]