
 Login Sign Up


| |||||
 |  | ||||

| 12Stocks.com Market Intelligence |
Best S&P 500 Stocks
|
On this page, you will find the most comprehensive analysis of S&P 500 stocks and ETFs - from latest trends to performances to charts ➞. First, here are the year-to-date (YTD) performances of the most requested S&P 500 stocks at 12Stocks.com (click stock for review):
| NVIDIA 70% | ||
| Caterpillar 21% | ||
| Amazon.com 19% | ||
| Merck 15% | ||
| Walmart 14% | ||
| Google 11% | ||
| Microsoft 10% | ||
| JPMorgan Chase 6% | ||
| Chevron 5% | ||
| Goldman Sachs 5% | ||
| Johnson & Johnson -8% | ||
| McDonald s -9% | ||
| Starbucks -10% | ||
| Apple -13% | ||
| Gilead -17% | ||
| Intel -29% | ||
| Boeing -35% | ||
| Quick: S&P 500 Stocks Lists: Performances & Trends, S&P 500 Stock Charts
Sort S&P 500 stocks: Daily, Weekly, Year-to-Date, Market Cap & Trends. Filter S&P 500 stocks list by sector: Show all, Tech, Finance, Energy, Staples, Retail, Industrial, Materials, Utilities and HealthCare |
| 12Stocks.com S&P 500 Stocks Performances & Trends Daily Report | |||||||||
|
| 
The overall Smart Investing & Trading Score is 26 (0-bearish to 100-bullish) which puts S&P 500 index in short term bearish to neutral trend. The Smart Investing & Trading Score from previous trading session is 31 and a deterioration of trend continues. | ||||||||
Here are the Smart Investing & Trading Scores of the most requested S&P 500 stocks at 12Stocks.com (click stock name for detailed review):
|


| 12Stocks.com: Top Performing S&P 500 Index Stocks | ||||||||||||||||||||||||||||||||||||||||||||||||
 The top performing S&P 500 Index stocks year to date are
Now, more recently, over last week, the top performing S&P 500 Index stocks on the move are


|
||||||||||||||||||||||||||||||||||||||||||||||||
| 12Stocks.com: Investing in S&P 500 Index with Stocks | |
|
The following table helps investors and traders sort through current performance and trends (as measured by Smart Investing & Trading Score) of various
stocks in the S&P 500 Index. Quick View: Move mouse or cursor over stock symbol (ticker) to view short-term technical chart and over stock name to view long term chart. Click on  to add stock symbol to your watchlist and to add stock symbol to your watchlist and  to view watchlist. Click on any ticker or stock name for detailed market intelligence report for that stock. to view watchlist. Click on any ticker or stock name for detailed market intelligence report for that stock. |
12Stocks.com Performance of Stocks in S&P 500 Index
| Ticker | Stock Name | Watchlist | Category | Recent Price | Smart Investing & Trading Score | Change % | Weekly Change% |
| ORCL | Oracle |   | Technology | 118.67 | 26 | -1.62% | -2.01% |
| SPY | SPDR S&P | | Utilities | 500.55 | 26 | -0.59% | -2.02% |
| PKG | Packaging | | Consumer Staples | 178.51 | 26 | -0.60% | -2.03% |
| KMI | Kinder Morgan | | Energy | 17.76 | 36 | 0.40% | -2.04% |
| COF | Capital One | | Financials | 136.77 | 31 | 0.26% | -2.04% |
| EMN | Eastman Chemical | | Materials | 95.97 | 43 | -0.45% | -2.05% |
| HIG | Hartford Financial | | Financials | 95.78 | 26 | -2.00% | -2.05% |
| REG | Regency Centers | | Financials | 57.29 | 0 | 0.54% | -2.05% |
| PYPL | PayPal Holdings | | Financials | 63.26 | 36 | -0.27% | -2.06% |
| EQR | Equity Residential | | Financials | 60.41 | 30 | 1.22% | -2.07% |
| VRSN | VeriSign | | Technology | 181.57 | 0 | -0.58% | -2.08% |
| ICE | Intercontinental Exchange | | Financials | 130.74 | 43 | 0.65% | -2.10% |
| INCY | Incyte | | Health Care | 52.72 | 0 | -0.94% | -2.10% |
| SNA | Snap-on | | Industrials | 283.50 | 7 | 0.37% | -2.10% |
| PRU | Prudential Financial | | Financials | 107.35 | 36 | -0.22% | -2.13% |
| DVA | DaVita | | Health Care | 127.64 | 31 | -1.65% | -2.13% |
| EOG | EOG Resources | | Energy | 132.40 | 63 | -0.42% | -2.14% |
| TRGP | Targa Resources | | Energy | 112.23 | 44 | -1.61% | -2.14% |
| ROK | Rockwell Automation | | Industrials | 278.65 | 43 | -0.97% | -2.17% |
| FITB | Fifth Third | | Financials | 34.10 | 35 | 0.03% | -2.18% |
| COP | ConocoPhillips | | Energy | 128.33 | 51 | -0.93% | -2.19% |
| COST | Costco Wholesale | | Services & Goods | 715.19 | 33 | -0.11% | -2.20% |
| UNP | Union Pacific | | Transports | 229.23 | 0 | -0.88% | -2.21% |
| DG | Dollar General | | Services & Goods | 144.49 | 53 | -0.34% | -2.23% |
| PNC | PNC Financial | | Financials | 147.25 | 12 | 0.48% | -2.24% |
| For chart view version of above stock list: Chart View ➞ 0 - 25 , 25 - 50 , 50 - 75 , 75 - 100 , 100 - 125 , 125 - 150 , 150 - 175 , 175 - 200 , 200 - 225 , 225 - 250 , 250 - 275 , 275 - 300 , 300 - 325 , 325 - 350 , 350 - 375 , 375 - 400 , 400 - 425 , 425 - 450 , 450 - 475 , 475 - 500 | ||
 | Click To Change The Sort Order: By Market Cap or Company Size Performance: Year-to-date, Week and Day |  |
|
Get the most comprehensive stock market coverage daily at 12Stocks.com ➞ Best Stocks Today ➞ Best Stocks Weekly ➞ Best Stocks Year-to-Date ➞ Best Stocks Trends ➞  Best Stocks Today 12Stocks.com Best Nasdaq Stocks ➞ Best S&P 500 Stocks ➞ Best Tech Stocks ➞ Best Biotech Stocks ➞ |
| Detailed Overview of S&P 500 Stocks |
| S&P 500 Technical Overview, Leaders & Laggards, Top S&P 500 ETF Funds & Detailed S&P 500 Stocks List, Charts, Trends & More |
| S&P 500: Technical Analysis, Trends & YTD Performance | |
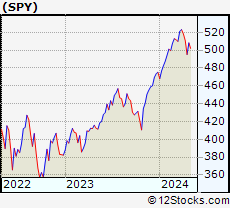
| S&P 500 index as represented by
SPY, an exchange-traded fund [ETF], holds basket of five hundred (mostly largecap) stocks from across all major sectors of the US stock market. The S&P 500 index (contains stocks like Apple and Exxon) is up by 5.31% and is currently outperforming the overall market by 0.9% year-to-date. Below is a quick view of technical charts and trends: | |
 SPY Weekly Chart |
|
| Long Term Trend: Good | |
| Medium Term Trend: Not Good | |
 SPY Daily Chart |
|
| Short Term Trend: Not Good | |
| Overall Trend Score: 26 | |
| YTD Performance: 5.31% | |
| **Trend Scores & Views Are Only For Educational Purposes And Not For Investing | |
| 12Stocks.com: Investing in S&P 500 Index using Exchange Traded Funds | |
|
The following table shows list of key exchange traded funds (ETF) that
help investors track S&P 500 index. The following list also includes leveraged ETF funds that track twice or thrice the daily returns of S&P 500 indices. Short or inverse ETF funds move in the opposite direction to the index they track and are useful during market pullbacks or during bear markets. Quick View: Move mouse or cursor over ETF symbol (ticker) to view short-term technical chart and over ETF name to view long term chart. Click on ticker or stock name for detailed view. Click on to add stock symbol to your watchlist and to view watchlist. |
12Stocks.com List of ETFs that track S&P 500 Index
| Ticker | ETF Name | Watchlist | Recent Price | Smart Investing & Trading Score | Change % | Week % | Year-to-date % |
| SPY | SPDR S&P 500 ETF | | 500.55 | 26 | -0.59 | -2.02 | 5.31% |
| IVV | iShares Core S&P 500 ETF | | 503.04 | 26 | -0.62 | -2 | 5.32% |
| VOO | Vanguard 500 ETF | | 459.99 | 26 | -0.65 | -2.04 | 5.31% |
| OEF | iShares S&P 100 | | 237.92 | 26 | -0.62 | -2.15 | 6.5% |
| SSO | ProShares Ultra S&P500 | | 70.66 | 26 | -1.24 | -4.07 | 8.59% |
| UPRO | ProShares UltraPro S&P500 | | 61.26 | 26 | -1.78 | -6.04 | 11.91% |
| SPXL | Direxion Daily S&P500 Bull 3X ETF | | 116.35 | 26 | -1.96 | -6.05 | 11.89% |
| SH | ProShares Short S&P500 | | 12.44 | 74 | 0.57 | 2.05 | -4.23% |
| SDS | ProShares UltraShort S&P500 | | 27.27 | 74 | 1.26 | 4.2 | -8.86% |
| SPXU | ProShares UltraPro Short S&P500 | | 37.07 | 74 | 1.90 | 6.34 | -13.79% |
| SPXS | Direxion Daily S&P 500 Bear 3X ETF | | 10.01 | 69 | 1.83 | 6.26 | -13.33% |
| 12Stocks.com: Charts, Trends, Fundamental Data and Performances of S&P 500 Stocks | |
|
We now take in-depth look at all S&P 500 stocks including charts, multi-period performances and overall trends (as measured by Smart Investing & Trading Score). One can sort S&P 500 stocks (click link to choose) by Daily, Weekly and by Year-to-Date performances. Also, one can sort by size of the company or by market capitalization. |
| Select Your Default Chart Type: | |||||
| |||||
| Click on stock symbol or name for detailed view. Click on to add stock symbol to your watchlist and to view watchlist. Quick View: Move mouse or cursor over "Daily" to quickly view daily technical stock chart and over "Weekly" to view weekly technical stock chart. | |||||
 | ORCL Oracle Corporation |
| Sector: Technology | |
| SubSector: Application Software | |
| MarketCap: 164530 Millions | |
| Recent Price: 118.67 Smart Investing & Trading Score: 26 | |
| Day Percent Change: -1.62% Day Change: -1.95 | |
| Week Change: -2.01% Year-to-date Change: 12.6% | |
| ORCL Links: Profile News Message Board | |
| Charts:- Daily , Weekly | |
| Add ORCL to Watchlist: View: Get ORCL Trend Analysis ➞ | |
 | SPY SPDR S&P 500 ETF |
| Sector: Utilities | |
| SubSector: Exchange Traded Fund | |
| MarketCap: 0 Millions | |
| Recent Price: 500.55 Smart Investing & Trading Score: 26 | |
| Day Percent Change: -0.59% Day Change: -2.98 | |
| Week Change: -2.02% Year-to-date Change: 5.3% | |
| SPY Links: Profile News Message Board | |
| Charts:- Daily , Weekly | |
| Add SPY to Watchlist: View: Get SPY Trend Analysis ➞ | |
 | PKG Packaging Corporation of America |
| Sector: Consumer Staples | |
| SubSector: Packaging & Containers | |
| MarketCap: 8963 Millions | |
| Recent Price: 178.51 Smart Investing & Trading Score: 26 | |
| Day Percent Change: -0.60% Day Change: -1.07 | |
| Week Change: -2.03% Year-to-date Change: 9.6% | |
| PKG Links: Profile News Message Board | |
| Charts:- Daily , Weekly | |
| Add PKG to Watchlist: View: Get PKG Trend Analysis ➞ | |
 | KMI Kinder Morgan, Inc. |
| Sector: Energy | |
| SubSector: Oil & Gas Pipelines | |
| MarketCap: 31283.5 Millions | |
| Recent Price: 17.76 Smart Investing & Trading Score: 36 | |
| Day Percent Change: 0.40% Day Change: 0.07 | |
| Week Change: -2.04% Year-to-date Change: 0.7% | |
| KMI Links: Profile News Message Board | |
| Charts:- Daily , Weekly | |
| Add KMI to Watchlist: View: Get KMI Trend Analysis ➞ | |
 | COF Capital One Financial Corporation |
| Sector: Financials | |
| SubSector: Credit Services | |
| MarketCap: 23094.2 Millions | |
| Recent Price: 136.77 Smart Investing & Trading Score: 31 | |
| Day Percent Change: 0.26% Day Change: 0.36 | |
| Week Change: -2.04% Year-to-date Change: 4.3% | |
| COF Links: Profile News Message Board | |
| Charts:- Daily , Weekly | |
| Add COF to Watchlist: View: Get COF Trend Analysis ➞ | |
 | EMN Eastman Chemical Company |
| Sector: Materials | |
| SubSector: Chemicals - Major Diversified | |
| MarketCap: 6217.06 Millions | |
| Recent Price: 95.97 Smart Investing & Trading Score: 43 | |
| Day Percent Change: -0.45% Day Change: -0.43 | |
| Week Change: -2.05% Year-to-date Change: 6.9% | |
| EMN Links: Profile News Message Board | |
| Charts:- Daily , Weekly | |
| Add EMN to Watchlist: View: Get EMN Trend Analysis ➞ | |
 | HIG The Hartford Financial Services Group, Inc. |
| Sector: Financials | |
| SubSector: Property & Casualty Insurance | |
| MarketCap: 12582.8 Millions | |
| Recent Price: 95.78 Smart Investing & Trading Score: 26 | |
| Day Percent Change: -2.00% Day Change: -1.95 | |
| Week Change: -2.05% Year-to-date Change: 19.2% | |
| HIG Links: Profile News Message Board | |
| Charts:- Daily , Weekly | |
| Add HIG to Watchlist: View: Get HIG Trend Analysis ➞ | |
 | REG Regency Centers Corporation |
| Sector: Financials | |
| SubSector: REIT - Retail | |
| MarketCap: 6345.84 Millions | |
| Recent Price: 57.29 Smart Investing & Trading Score: 0 | |
| Day Percent Change: 0.54% Day Change: 0.31 | |
| Week Change: -2.05% Year-to-date Change: -14.5% | |
| REG Links: Profile News Message Board | |
| Charts:- Daily , Weekly | |
| Add REG to Watchlist: View: Get REG Trend Analysis ➞ | |
 | PYPL PayPal Holdings, Inc. |
| Sector: Financials | |
| SubSector: Credit Services | |
| MarketCap: 108949 Millions | |
| Recent Price: 63.26 Smart Investing & Trading Score: 36 | |
| Day Percent Change: -0.27% Day Change: -0.17 | |
| Week Change: -2.06% Year-to-date Change: 3.0% | |
| PYPL Links: Profile News Message Board | |
| Charts:- Daily , Weekly | |
| Add PYPL to Watchlist: View: Get PYPL Trend Analysis ➞ | |
 | EQR Equity Residential |
| Sector: Financials | |
| SubSector: REIT - Residential | |
| MarketCap: 22061.9 Millions | |
| Recent Price: 60.41 Smart Investing & Trading Score: 30 | |
| Day Percent Change: 1.22% Day Change: 0.73 | |
| Week Change: -2.07% Year-to-date Change: -1.2% | |
| EQR Links: Profile News Message Board | |
| Charts:- Daily , Weekly | |
| Add EQR to Watchlist: View: Get EQR Trend Analysis ➞ | |
 | VRSN VeriSign, Inc. |
| Sector: Technology | |
| SubSector: Internet Information Providers | |
| MarketCap: 19657 Millions | |
| Recent Price: 181.57 Smart Investing & Trading Score: 0 | |
| Day Percent Change: -0.58% Day Change: -1.06 | |
| Week Change: -2.08% Year-to-date Change: -11.8% | |
| VRSN Links: Profile News Message Board | |
| Charts:- Daily , Weekly | |
| Add VRSN to Watchlist: View: Get VRSN Trend Analysis ➞ | |
 | ICE Intercontinental Exchange, Inc. |
| Sector: Financials | |
| SubSector: Diversified Investments | |
| MarketCap: 46054.6 Millions | |
| Recent Price: 130.74 Smart Investing & Trading Score: 43 | |
| Day Percent Change: 0.65% Day Change: 0.84 | |
| Week Change: -2.1% Year-to-date Change: 1.8% | |
| ICE Links: Profile News Message Board | |
| Charts:- Daily , Weekly | |
| Add ICE to Watchlist: View: Get ICE Trend Analysis ➞ | |
 | INCY Incyte Corporation |
| Sector: Health Care | |
| SubSector: Biotechnology | |
| MarketCap: 15343.2 Millions | |
| Recent Price: 52.72 Smart Investing & Trading Score: 0 | |
| Day Percent Change: -0.94% Day Change: -0.50 | |
| Week Change: -2.1% Year-to-date Change: -16.0% | |
| INCY Links: Profile News Message Board | |
| Charts:- Daily , Weekly | |
| Add INCY to Watchlist: View: Get INCY Trend Analysis ➞ | |
 | SNA Snap-on Incorporated |
| Sector: Industrials | |
| SubSector: Small Tools & Accessories | |
| MarketCap: 5947.26 Millions | |
| Recent Price: 283.50 Smart Investing & Trading Score: 7 | |
| Day Percent Change: 0.37% Day Change: 1.05 | |
| Week Change: -2.1% Year-to-date Change: -1.9% | |
| SNA Links: Profile News Message Board | |
| Charts:- Daily , Weekly | |
| Add SNA to Watchlist: View: Get SNA Trend Analysis ➞ | |
 | PRU Prudential Financial, Inc. |
| Sector: Financials | |
| SubSector: Life Insurance | |
| MarketCap: 21001.6 Millions | |
| Recent Price: 107.35 Smart Investing & Trading Score: 36 | |
| Day Percent Change: -0.22% Day Change: -0.24 | |
| Week Change: -2.13% Year-to-date Change: 3.5% | |
| PRU Links: Profile News Message Board | |
| Charts:- Daily , Weekly | |
| Add PRU to Watchlist: View: Get PRU Trend Analysis ➞ | |
 | DVA DaVita Inc. |
| Sector: Health Care | |
| SubSector: Specialized Health Services | |
| MarketCap: 8954.36 Millions | |
| Recent Price: 127.64 Smart Investing & Trading Score: 31 | |
| Day Percent Change: -1.65% Day Change: -2.14 | |
| Week Change: -2.13% Year-to-date Change: 21.8% | |
| DVA Links: Profile News Message Board | |
| Charts:- Daily , Weekly | |
| Add DVA to Watchlist: View: Get DVA Trend Analysis ➞ | |
 | EOG EOG Resources, Inc. |
| Sector: Energy | |
| SubSector: Independent Oil & Gas | |
| MarketCap: 24282.1 Millions | |
| Recent Price: 132.40 Smart Investing & Trading Score: 63 | |
| Day Percent Change: -0.42% Day Change: -0.56 | |
| Week Change: -2.14% Year-to-date Change: 9.5% | |
| EOG Links: Profile News Message Board | |
| Charts:- Daily , Weekly | |
| Add EOG to Watchlist: View: Get EOG Trend Analysis ➞ | |
 | TRGP Targa Resources Corp. |
| Sector: Energy | |
| SubSector: Oil & Gas Pipelines | |
| MarketCap: 2210.65 Millions | |
| Recent Price: 112.23 Smart Investing & Trading Score: 44 | |
| Day Percent Change: -1.61% Day Change: -1.84 | |
| Week Change: -2.14% Year-to-date Change: 29.2% | |
| TRGP Links: Profile News Message Board | |
| Charts:- Daily , Weekly | |
| Add TRGP to Watchlist: View: Get TRGP Trend Analysis ➞ | |
 | ROK Rockwell Automation, Inc. |
| Sector: Industrials | |
| SubSector: Diversified Machinery | |
| MarketCap: 15666.1 Millions | |
| Recent Price: 278.65 Smart Investing & Trading Score: 43 | |
| Day Percent Change: -0.97% Day Change: -2.74 | |
| Week Change: -2.17% Year-to-date Change: -10.3% | |
| ROK Links: Profile News Message Board | |
| Charts:- Daily , Weekly | |
| Add ROK to Watchlist: View: Get ROK Trend Analysis ➞ | |
 | FITB Fifth Third Bancorp |
| Sector: Financials | |
| SubSector: Regional - Midwest Banks | |
| MarketCap: 10197 Millions | |
| Recent Price: 34.10 Smart Investing & Trading Score: 35 | |
| Day Percent Change: 0.03% Day Change: 0.01 | |
| Week Change: -2.18% Year-to-date Change: -1.1% | |
| FITB Links: Profile News Message Board | |
| Charts:- Daily , Weekly | |
| Add FITB to Watchlist: View: Get FITB Trend Analysis ➞ | |
 | COP ConocoPhillips |
| Sector: Energy | |
| SubSector: Independent Oil & Gas | |
| MarketCap: 33504.3 Millions | |
| Recent Price: 128.33 Smart Investing & Trading Score: 51 | |
| Day Percent Change: -0.93% Day Change: -1.20 | |
| Week Change: -2.19% Year-to-date Change: 10.6% | |
| COP Links: Profile News Message Board | |
| Charts:- Daily , Weekly | |
| Add COP to Watchlist: View: Get COP Trend Analysis ➞ | |
 | COST Costco Wholesale Corporation |
| Sector: Services & Goods | |
| SubSector: Discount, Variety Stores | |
| MarketCap: 136355 Millions | |
| Recent Price: 715.19 Smart Investing & Trading Score: 33 | |
| Day Percent Change: -0.11% Day Change: -0.78 | |
| Week Change: -2.2% Year-to-date Change: 8.4% | |
| COST Links: Profile News Message Board | |
| Charts:- Daily , Weekly | |
| Add COST to Watchlist: View: Get COST Trend Analysis ➞ | |
 | UNP Union Pacific Corporation |
| Sector: Transports | |
| SubSector: Railroads | |
| MarketCap: 87198.1 Millions | |
| Recent Price: 229.23 Smart Investing & Trading Score: 0 | |
| Day Percent Change: -0.88% Day Change: -2.03 | |
| Week Change: -2.21% Year-to-date Change: -6.7% | |
| UNP Links: Profile News Message Board | |
| Charts:- Daily , Weekly | |
| Add UNP to Watchlist: View: Get UNP Trend Analysis ➞ | |
 | DG Dollar General Corporation |
| Sector: Services & Goods | |
| SubSector: Discount, Variety Stores | |
| MarketCap: 39611.9 Millions | |
| Recent Price: 144.49 Smart Investing & Trading Score: 53 | |
| Day Percent Change: -0.34% Day Change: -0.50 | |
| Week Change: -2.23% Year-to-date Change: 6.3% | |
| DG Links: Profile News Message Board | |
| Charts:- Daily , Weekly | |
| Add DG to Watchlist: View: Get DG Trend Analysis ➞ | |
 | PNC The PNC Financial Services Group, Inc. |
| Sector: Financials | |
| SubSector: Money Center Banks | |
| MarketCap: 41291.5 Millions | |
| Recent Price: 147.25 Smart Investing & Trading Score: 12 | |
| Day Percent Change: 0.48% Day Change: 0.71 | |
| Week Change: -2.24% Year-to-date Change: -4.9% | |
| PNC Links: Profile News Message Board | |
| Charts:- Daily , Weekly | |
| Add PNC to Watchlist: View: Get PNC Trend Analysis ➞ | |
| For tabular summary view of above stock list: Summary View ➞ 0 - 25 , 25 - 50 , 50 - 75 , 75 - 100 , 100 - 125 , 125 - 150 , 150 - 175 , 175 - 200 , 200 - 225 , 225 - 250 , 250 - 275 , 275 - 300 , 300 - 325 , 325 - 350 , 350 - 375 , 375 - 400 , 400 - 425 , 425 - 450 , 450 - 475 , 475 - 500 | ||
| Click To Change The Sort Order: By Market Cap or Company Size Performance: Year-to-date, Week and Day | |
| Select Chart Type: | ||
|
Best Stocks Today 12Stocks.com |
© 2024 12Stocks.com Terms & Conditions Privacy Contact Us
All Information Provided Only For Education And Not To Be Used For Investing or Trading. See Terms & Conditions


One More Thing ... Get Best Stocks Delivered Daily!
Never Ever Miss A Move With Our Top Ten Stocks Lists
Find Best Stocks In Any Market - Bull or Bear Market
Take A Peek At Our Top Ten Stocks Lists: Daily, Weekly, Year-to-Date & Top Trends
Find Best Stocks In Any Market - Bull or Bear Market
Take A Peek At Our Top Ten Stocks Lists: Daily, Weekly, Year-to-Date & Top Trends
S&P 500 Stocks With Best Up Trends [0-bearish to 100-bullish]: United Airlines[100], Conagra Brands[95], Bunge [93], Charles Schwab[88], Lockheed Martin[86], Progressive [83], NextEra [81], Newmont [76], Google [75], Google [75], Yum! Brands[75]
Best S&P 500 Stocks Year-to-Date:
NVIDIA [69.69%], Constellation [58.3%], NRG [42.01%], Meta Platforms[39.59%], Marathon [36.47%], Micron [36.31%], Western Digital[33.99%], Progressive [31.29%], Diamondback [29.71%], Targa Resources[29.19%], Eaton [28.8%] Best S&P 500 Stocks This Week:
United Airlines[16.6%], UnitedHealth [9.06%], Globe Life[7.01%], ProShares UltraPro[6.34%], American Airlines[5.63%], Morgan Stanley[4.51%], Southwest Airlines[4.5%], Goldman Sachs[3.7%], Charles Schwab[3.53%], General Mills[3.49%], Humana [3.48%] Best S&P 500 Stocks Daily:
United Airlines[17.45%], American Airlines[6.60%], Globe Life[5.44%], NextEra [3.39%], Consolidated Edison[3.33%], Norwegian Cruise[3.15%], Dominion [3.12%], Southern [3.00%], Delta Air[2.86%], First Solar[2.85%], Southwest Airlines[2.60%]