
 Login Sign Up


| |||||
 |  | ||||

| 12Stocks.com Market Intelligence |
Best S&P 500 Stocks
|
On this page, you will find the most comprehensive analysis of S&P 500 stocks and ETFs - from latest trends to performances to charts ➞. First, here are the year-to-date (YTD) performances of the most requested S&P 500 stocks at 12Stocks.com (click stock for review):
| NVIDIA 77% | ||
| Amazon.com 22% | ||
| Google 18% | ||
| Merck 17% | ||
| Goldman Sachs 14% | ||
| Caterpillar 13% | ||
| Walmart 13% | ||
| JPMorgan Chase 12% | ||
| Microsoft 8% | ||
| Chevron 5% | ||
| Apple -4% | ||
| Johnson & Johnson -5% | ||
| McDonald s -9% | ||
| Gilead -20% | ||
| Starbucks -23% | ||
| Boeing -31% | ||
| Intel -39% | ||
| Quick: S&P 500 Stocks Lists: Performances & Trends, S&P 500 Stock Charts
Sort S&P 500 stocks: Daily, Weekly, Year-to-Date, Market Cap & Trends. Filter S&P 500 stocks list by sector: Show all, Tech, Finance, Energy, Staples, Retail, Industrial, Materials, Utilities and HealthCare |
| 12Stocks.com S&P 500 Stocks Performances & Trends Daily Report | |||||||||
|
| 
The overall Smart Investing & Trading Score is 60 (0-bearish to 100-bullish) which puts S&P 500 index in short term neutral to bullish trend. The Smart Investing & Trading Score from previous trading session is 30 and hence an improvement of trend. | ||||||||
Here are the Smart Investing & Trading Scores of the most requested S&P 500 stocks at 12Stocks.com (click stock name for detailed review):
|


| 12Stocks.com: Top Performing S&P 500 Index Stocks | ||||||||||||||||||||||||||||||||||||||||||||||||
 The top performing S&P 500 Index stocks year to date are
Now, more recently, over last week, the top performing S&P 500 Index stocks on the move are


|
||||||||||||||||||||||||||||||||||||||||||||||||
| 12Stocks.com: Investing in S&P 500 Index with Stocks | |
|
The following table helps investors and traders sort through current performance and trends (as measured by Smart Investing & Trading Score) of various
stocks in the S&P 500 Index. Quick View: Move mouse or cursor over stock symbol (ticker) to view short-term technical chart and over stock name to view long term chart. Click on  to add stock symbol to your watchlist and to add stock symbol to your watchlist and  to view watchlist. Click on any ticker or stock name for detailed market intelligence report for that stock. to view watchlist. Click on any ticker or stock name for detailed market intelligence report for that stock. |
12Stocks.com Performance of Stocks in S&P 500 Index
| Ticker | Stock Name | Watchlist | Category | Recent Price | Smart Investing & Trading Score | Change % | Weekly Change% |
| TECH | Bio-Techne |   | Health Care | 76.45 | 100 | 1.12% | 19.34% |
| CHRW | C.H. Robinson | | Transports | 81.56 | 100 | 0.78% | 16.15% |
| AMGN | Amgen | | Health Care | 313.52 | 100 | 12.62% | 16.13% |
| GRMN | Garmin | | Technology | 165.09 | 100 | -0.15% | 15.09% |
| MRNA | Moderna | | Health Care | 124.26 | 100 | -1.06% | 15.09% |
| APTV | Aptiv | | Consumer Staples | 80.01 | 87 | 2.85% | 12.36% |
| ALB | Albemarle | | Materials | 129.58 | 74 | 3.42% | 10.87% |
| AMCR | Amcor | | Consumer Staples | 9.92 | 100 | 0.51% | 10.59% |
| BWA | BorgWarner | | Consumer Staples | 36.41 | 100 | 2.18% | 9.69% |
| WRK | WestRock | | Consumer Staples | 51.55 | 100 | 0.86% | 9.10% |
| LDOS | Leidos Holdings | | Technology | 142.06 | 95 | -0.42% | 8.98% |
| AAPL | Apple | | Technology | 184.37 | 100 | 6.55% | 8.90% |
| PFE | Pfizer | | Health Care | 27.61 | 100 | -0.34% | 8.68% |
| AES | AES | | Utilities | 18.61 | 95 | -1.72% | 8.11% |
| QCOM | QUALCOMM | | Technology | 178.28 | 100 | -1.01% | 7.62% |
| FICO | Fair Isaac | | Technology | 1190.91 | 57 | 2.19% | 7.21% |
| GLW | Corning | | Technology | 33.56 | 88 | -0.03% | 7.12% |
| BA | Boeing | | Industrials | 179.00 | 64 | 0.08% | 7.04% |
| VRSK | Verisk Analytics | | Services & Goods | 236.30 | 64 | 1.09% | 6.86% |
| NXPI | NXP Semiconductors | | Technology | 259.05 | 95 | 1.88% | 6.74% |
| LYV | Live Nation | | Services & Goods | 95.74 | 49 | 8.46% | 6.58% |
| EXR | Extra Space | | Financials | 142.16 | 100 | 1.70% | 6.51% |
| REGN | Regeneron | | Health Care | 939.29 | 64 | 0.18% | 6.35% |
| TSLA | Tesla | | Consumer Staples | 178.80 | 49 | -0.67% | 6.25% |
| IP | Paper | | Consumer Staples | 35.85 | 80 | 0.11% | 5.97% |
| For chart view version of above stock list: Chart View ➞ 0 - 25 , 25 - 50 , 50 - 75 , 75 - 100 , 100 - 125 , 125 - 150 , 150 - 175 , 175 - 200 , 200 - 225 , 225 - 250 , 250 - 275 , 275 - 300 , 300 - 325 , 325 - 350 , 350 - 375 , 375 - 400 , 400 - 425 , 425 - 450 , 450 - 475 , 475 - 500 | ||
 | Click To Change The Sort Order: By Market Cap or Company Size Performance: Year-to-date, Week and Day |  |
|
Get the most comprehensive stock market coverage daily at 12Stocks.com ➞ Best Stocks Today ➞ Best Stocks Weekly ➞ Best Stocks Year-to-Date ➞ Best Stocks Trends ➞  Best Stocks Today 12Stocks.com Best Nasdaq Stocks ➞ Best S&P 500 Stocks ➞ Best Tech Stocks ➞ Best Biotech Stocks ➞ |
| Detailed Overview of S&P 500 Stocks |
| S&P 500 Technical Overview, Leaders & Laggards, Top S&P 500 ETF Funds & Detailed S&P 500 Stocks List, Charts, Trends & More |
| S&P 500: Technical Analysis, Trends & YTD Performance | |
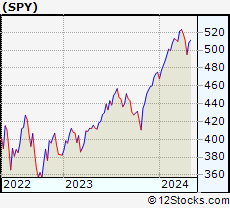
| S&P 500 index as represented by
SPY, an exchange-traded fund [ETF], holds basket of five hundred (mostly largecap) stocks from across all major sectors of the US stock market. The S&P 500 index (contains stocks like Apple and Exxon) is up by 7.05% and is currently outperforming the overall market by 0.56% year-to-date. Below is a quick view of technical charts and trends: | |
 SPY Weekly Chart |
|
| Long Term Trend: Good | |
| Medium Term Trend: Not Good | |
 SPY Daily Chart |
|
| Short Term Trend: Very Good | |
| Overall Trend Score: 60 | |
| YTD Performance: 7.05% | |
| **Trend Scores & Views Are Only For Educational Purposes And Not For Investing | |
| 12Stocks.com: Investing in S&P 500 Index using Exchange Traded Funds | |
|
The following table shows list of key exchange traded funds (ETF) that
help investors track S&P 500 index. The following list also includes leveraged ETF funds that track twice or thrice the daily returns of S&P 500 indices. Short or inverse ETF funds move in the opposite direction to the index they track and are useful during market pullbacks or during bear markets. Quick View: Move mouse or cursor over ETF symbol (ticker) to view short-term technical chart and over ETF name to view long term chart. Click on ticker or stock name for detailed view. Click on to add stock symbol to your watchlist and to view watchlist. |
12Stocks.com List of ETFs that track S&P 500 Index
| Ticker | ETF Name | Watchlist | Recent Price | Smart Investing & Trading Score | Change % | Week % | Year-to-date % |
| SPY | SPDR S&P 500 ETF | | 508.84 | 60 | 0.75 | 0.11 | 7.05% |
| IVV | iShares Core S&P 500 ETF | | 511.36 | 60 | 0.77 | 0.12 | 7.06% |
| VOO | Vanguard 500 ETF | | 467.73 | 60 | 0.76 | 0.11 | 7.08% |
| OEF | iShares S&P 100 | | 242.65 | 60 | 1.01 | 0.45 | 8.62% |
| SSO | ProShares Ultra S&P500 | | 72.86 | 39 | 1.67 | 0.21 | 11.97% |
| UPRO | ProShares UltraPro S&P500 | | 63.93 | 39 | 2.50 | 0.17 | 16.79% |
| SH | ProShares Short S&P500 | | 12.29 | 48 | -0.73 | 0.08 | -5.39% |
| SDS | ProShares UltraShort S&P500 | | 26.52 | 48 | -1.41 | -0.04 | -11.36% |
| SPXU | ProShares UltraPro Short S&P500 | | 35.38 | 30 | -2.43 | -0.34 | -17.72% |
| SPXS | Direxion Daily S&P 500 Bear 3X ETF | | 9.57 | 30 | -2.45 | -0.42 | -17.14% |
| 12Stocks.com: Charts, Trends, Fundamental Data and Performances of S&P 500 Stocks | |
|
We now take in-depth look at all S&P 500 stocks including charts, multi-period performances and overall trends (as measured by Smart Investing & Trading Score). One can sort S&P 500 stocks (click link to choose) by Daily, Weekly and by Year-to-Date performances. Also, one can sort by size of the company or by market capitalization. |
| Select Your Default Chart Type: | |||||
| |||||
| Click on stock symbol or name for detailed view. Click on to add stock symbol to your watchlist and to view watchlist. Quick View: Move mouse or cursor over "Daily" to quickly view daily technical stock chart and over "Weekly" to view weekly technical stock chart. | |||||

 | TECH Bio-Techne Corporation |
| Sector: Health Care | |
| SubSector: Biotechnology | |
| MarketCap: 6958.05 Millions | |
| Recent Price: 76.45 Smart Investing & Trading Score: 100 | |
| Day Percent Change: 1.12% Day Change: 0.85 | |
| Week Change: 19.34% Year-to-date Change: -0.9% | |
| TECH Links: Profile News Message Board | |
| Charts:- Daily , Weekly | |
| Add TECH to Watchlist: View: Get TECH Trend Analysis ➞ | |
 | CHRW C.H. Robinson Worldwide, Inc. |
| Sector: Transports | |
| SubSector: Air Delivery & Freight Services | |
| MarketCap: 9194.78 Millions | |
| Recent Price: 81.56 Smart Investing & Trading Score: 100 | |
| Day Percent Change: 0.78% Day Change: 0.63 | |
| Week Change: 16.15% Year-to-date Change: -5.6% | |
| CHRW Links: Profile News Message Board | |
| Charts:- Daily , Weekly | |
| Add CHRW to Watchlist: View: Get CHRW Trend Analysis ➞ | |
 | AMGN Amgen Inc. |
| Sector: Health Care | |
| SubSector: Biotechnology | |
| MarketCap: 121030 Millions | |
| Recent Price: 313.52 Smart Investing & Trading Score: 100 | |
| Day Percent Change: 12.62% Day Change: 35.13 | |
| Week Change: 16.13% Year-to-date Change: 8.9% | |
| AMGN Links: Profile News Message Board | |
| Charts:- Daily , Weekly | |
| Add AMGN to Watchlist: View: Get AMGN Trend Analysis ➞ | |
 | GRMN Garmin Ltd. |
| Sector: Technology | |
| SubSector: Scientific & Technical Instruments | |
| MarketCap: 13909.3 Millions | |
| Recent Price: 165.09 Smart Investing & Trading Score: 100 | |
| Day Percent Change: -0.15% Day Change: -0.24 | |
| Week Change: 15.09% Year-to-date Change: 28.4% | |
| GRMN Links: Profile News Message Board | |
| Charts:- Daily , Weekly | |
| Add GRMN to Watchlist: View: Get GRMN Trend Analysis ➞ | |
 | MRNA Moderna, Inc. |
| Sector: Health Care | |
| SubSector: Biotechnology | |
| MarketCap: 11006.4 Millions | |
| Recent Price: 124.26 Smart Investing & Trading Score: 100 | |
| Day Percent Change: -1.06% Day Change: -1.33 | |
| Week Change: 15.09% Year-to-date Change: 25.0% | |
| MRNA Links: Profile News Message Board | |
| Charts:- Daily , Weekly | |
| Add MRNA to Watchlist: View: Get MRNA Trend Analysis ➞ | |
 | APTV Aptiv PLC |
| Sector: Consumer Staples | |
| SubSector: Auto Parts | |
| MarketCap: 13047.9 Millions | |
| Recent Price: 80.01 Smart Investing & Trading Score: 87 | |
| Day Percent Change: 2.85% Day Change: 2.22 | |
| Week Change: 12.36% Year-to-date Change: -10.8% | |
| APTV Links: Profile News Message Board | |
| Charts:- Daily , Weekly | |
| Add APTV to Watchlist: View: Get APTV Trend Analysis ➞ | |
 | ALB Albemarle Corporation |
| Sector: Materials | |
| SubSector: Specialty Chemicals | |
| MarketCap: 6139.27 Millions | |
| Recent Price: 129.58 Smart Investing & Trading Score: 74 | |
| Day Percent Change: 3.42% Day Change: 4.28 | |
| Week Change: 10.87% Year-to-date Change: -10.3% | |
| ALB Links: Profile News Message Board | |
| Charts:- Daily , Weekly | |
| Add ALB to Watchlist: View: Get ALB Trend Analysis ➞ | |
 | AMCR Amcor plc |
| Sector: Consumer Staples | |
| SubSector: Packaging & Containers | |
| MarketCap: 13964 Millions | |
| Recent Price: 9.92 Smart Investing & Trading Score: 100 | |
| Day Percent Change: 0.51% Day Change: 0.05 | |
| Week Change: 10.59% Year-to-date Change: 2.9% | |
| AMCR Links: Profile News Message Board | |
| Charts:- Daily , Weekly | |
| Add AMCR to Watchlist: View: Get AMCR Trend Analysis ➞ | |
 | BWA BorgWarner Inc. |
| Sector: Consumer Staples | |
| SubSector: Auto Parts | |
| MarketCap: 4604.09 Millions | |
| Recent Price: 36.41 Smart Investing & Trading Score: 100 | |
| Day Percent Change: 2.18% Day Change: 0.77 | |
| Week Change: 9.69% Year-to-date Change: 1.6% | |
| BWA Links: Profile News Message Board | |
| Charts:- Daily , Weekly | |
| Add BWA to Watchlist: View: Get BWA Trend Analysis ➞ | |
 | WRK WestRock Company |
| Sector: Consumer Staples | |
| SubSector: Packaging & Containers | |
| MarketCap: 7835.43 Millions | |
| Recent Price: 51.55 Smart Investing & Trading Score: 100 | |
| Day Percent Change: 0.86% Day Change: 0.44 | |
| Week Change: 9.1% Year-to-date Change: 24.2% | |
| WRK Links: Profile News Message Board | |
| Charts:- Daily , Weekly | |
| Add WRK to Watchlist: View: Get WRK Trend Analysis ➞ | |
 | LDOS Leidos Holdings, Inc. |
| Sector: Technology | |
| SubSector: Information Technology Services | |
| MarketCap: 11707.5 Millions | |
| Recent Price: 142.06 Smart Investing & Trading Score: 95 | |
| Day Percent Change: -0.42% Day Change: -0.60 | |
| Week Change: 8.98% Year-to-date Change: 31.3% | |
| LDOS Links: Profile News Message Board | |
| Charts:- Daily , Weekly | |
| Add LDOS to Watchlist: View: Get LDOS Trend Analysis ➞ | |
 | AAPL Apple Inc. |
| Sector: Technology | |
| SubSector: Electronic Equipment | |
| MarketCap: 1112940 Millions | |
| Recent Price: 184.37 Smart Investing & Trading Score: 100 | |
| Day Percent Change: 6.55% Day Change: 11.34 | |
| Week Change: 8.9% Year-to-date Change: -4.2% | |
| AAPL Links: Profile News Message Board | |
| Charts:- Daily , Weekly | |
| Add AAPL to Watchlist: View: Get AAPL Trend Analysis ➞ | |
 | PFE Pfizer Inc. |
| Sector: Health Care | |
| SubSector: Drug Manufacturers - Major | |
| MarketCap: 172467 Millions | |
| Recent Price: 27.61 Smart Investing & Trading Score: 100 | |
| Day Percent Change: -0.34% Day Change: -0.09 | |
| Week Change: 8.68% Year-to-date Change: -4.1% | |
| PFE Links: Profile News Message Board | |
| Charts:- Daily , Weekly | |
| Add PFE to Watchlist: View: Get PFE Trend Analysis ➞ | |
 | AES The AES Corporation |
| Sector: Utilities | |
| SubSector: Electric Utilities | |
| MarketCap: 9173.44 Millions | |
| Recent Price: 18.61 Smart Investing & Trading Score: 95 | |
| Day Percent Change: -1.72% Day Change: -0.32 | |
| Week Change: 8.11% Year-to-date Change: -3.4% | |
| AES Links: Profile News Message Board | |
| Charts:- Daily , Weekly | |
| Add AES to Watchlist: View: Get AES Trend Analysis ➞ | |
 | QCOM QUALCOMM Incorporated |
| Sector: Technology | |
| SubSector: Communication Equipment | |
| MarketCap: 77517.7 Millions | |
| Recent Price: 178.28 Smart Investing & Trading Score: 100 | |
| Day Percent Change: -1.01% Day Change: -1.82 | |
| Week Change: 7.62% Year-to-date Change: 23.3% | |
| QCOM Links: Profile News Message Board | |
| Charts:- Daily , Weekly | |
| Add QCOM to Watchlist: View: Get QCOM Trend Analysis ➞ | |
 | FICO Fair Isaac Corporation |
| Sector: Technology | |
| SubSector: Business Software & Services | |
| MarketCap: 7930.98 Millions | |
| Recent Price: 1190.91 Smart Investing & Trading Score: 57 | |
| Day Percent Change: 2.19% Day Change: 25.56 | |
| Week Change: 7.21% Year-to-date Change: 2.3% | |
| FICO Links: Profile News Message Board | |
| Charts:- Daily , Weekly | |
| Add FICO to Watchlist: View: Get FICO Trend Analysis ➞ | |
 | GLW Corning Incorporated |
| Sector: Technology | |
| SubSector: Diversified Electronics | |
| MarketCap: 16287.6 Millions | |
| Recent Price: 33.56 Smart Investing & Trading Score: 88 | |
| Day Percent Change: -0.03% Day Change: -0.01 | |
| Week Change: 7.12% Year-to-date Change: 10.2% | |
| GLW Links: Profile News Message Board | |
| Charts:- Daily , Weekly | |
| Add GLW to Watchlist: View: Get GLW Trend Analysis ➞ | |
 | BA The Boeing Company |
| Sector: Industrials | |
| SubSector: Aerospace/Defense Products & Services | |
| MarketCap: 65336.4 Millions | |
| Recent Price: 179.00 Smart Investing & Trading Score: 64 | |
| Day Percent Change: 0.08% Day Change: 0.15 | |
| Week Change: 7.04% Year-to-date Change: -31.3% | |
| BA Links: Profile News Message Board | |
| Charts:- Daily , Weekly | |
| Add BA to Watchlist: View: Get BA Trend Analysis ➞ | |
 | VRSK Verisk Analytics, Inc. |
| Sector: Services & Goods | |
| SubSector: Business Services | |
| MarketCap: 22033.2 Millions | |
| Recent Price: 236.30 Smart Investing & Trading Score: 64 | |
| Day Percent Change: 1.09% Day Change: 2.54 | |
| Week Change: 6.86% Year-to-date Change: -1.1% | |
| VRSK Links: Profile News Message Board | |
| Charts:- Daily , Weekly | |
| Add VRSK to Watchlist: View: Get VRSK Trend Analysis ➞ | |
 | NXPI NXP Semiconductors N.V. |
| Sector: Technology | |
| SubSector: Semiconductor - Broad Line | |
| MarketCap: 22497.9 Millions | |
| Recent Price: 259.05 Smart Investing & Trading Score: 95 | |
| Day Percent Change: 1.88% Day Change: 4.79 | |
| Week Change: 6.74% Year-to-date Change: 12.8% | |
| NXPI Links: Profile News Message Board | |
| Charts:- Daily , Weekly | |
| Add NXPI to Watchlist: View: Get NXPI Trend Analysis ➞ | |
 | LYV Live Nation Entertainment, Inc. |
| Sector: Services & Goods | |
| SubSector: Entertainment - Diversified | |
| MarketCap: 8457.17 Millions | |
| Recent Price: 95.74 Smart Investing & Trading Score: 49 | |
| Day Percent Change: 8.46% Day Change: 7.47 | |
| Week Change: 6.58% Year-to-date Change: 2.3% | |
| LYV Links: Profile News Message Board | |
| Charts:- Daily , Weekly | |
| Add LYV to Watchlist: View: Get LYV Trend Analysis ➞ | |
 | EXR Extra Space Storage Inc. |
| Sector: Financials | |
| SubSector: REIT - Industrial | |
| MarketCap: 11203.9 Millions | |
| Recent Price: 142.16 Smart Investing & Trading Score: 100 | |
| Day Percent Change: 1.70% Day Change: 2.37 | |
| Week Change: 6.51% Year-to-date Change: -11.3% | |
| EXR Links: Profile News Message Board | |
| Charts:- Daily , Weekly | |
| Add EXR to Watchlist: View: Get EXR Trend Analysis ➞ | |
 | REGN Regeneron Pharmaceuticals, Inc. |
| Sector: Health Care | |
| SubSector: Biotechnology | |
| MarketCap: 51903.7 Millions | |
| Recent Price: 939.29 Smart Investing & Trading Score: 64 | |
| Day Percent Change: 0.18% Day Change: 1.68 | |
| Week Change: 6.35% Year-to-date Change: 7.0% | |
| REGN Links: Profile News Message Board | |
| Charts:- Daily , Weekly | |
| Add REGN to Watchlist: View: Get REGN Trend Analysis ➞ | |
 | TSLA Tesla, Inc. |
| Sector: Consumer Staples | |
| SubSector: Auto Manufacturers - Major | |
| MarketCap: 89058.8 Millions | |
| Recent Price: 178.80 Smart Investing & Trading Score: 49 | |
| Day Percent Change: -0.67% Day Change: -1.21 | |
| Week Change: 6.25% Year-to-date Change: -28.0% | |
| TSLA Links: Profile News Message Board | |
| Charts:- Daily , Weekly | |
| Add TSLA to Watchlist: View: Get TSLA Trend Analysis ➞ | |
 | IP International Paper Company |
| Sector: Consumer Staples | |
| SubSector: Packaging & Containers | |
| MarketCap: 13031.3 Millions | |
| Recent Price: 35.85 Smart Investing & Trading Score: 80 | |
| Day Percent Change: 0.11% Day Change: 0.04 | |
| Week Change: 5.97% Year-to-date Change: -0.8% | |
| IP Links: Profile News Message Board | |
| Charts:- Daily , Weekly | |
| Add IP to Watchlist: View: Get IP Trend Analysis ➞ | |
| For tabular summary view of above stock list: Summary View ➞ 0 - 25 , 25 - 50 , 50 - 75 , 75 - 100 , 100 - 125 , 125 - 150 , 150 - 175 , 175 - 200 , 200 - 225 , 225 - 250 , 250 - 275 , 275 - 300 , 300 - 325 , 325 - 350 , 350 - 375 , 375 - 400 , 400 - 425 , 425 - 450 , 450 - 475 , 475 - 500 | ||
| Click To Change The Sort Order: By Market Cap or Company Size Performance: Year-to-date, Week and Day | |
| Select Chart Type: | ||
|
Best Stocks Today 12Stocks.com |
© 2024 12Stocks.com Terms & Conditions Privacy Contact Us
All Information Provided Only For Education And Not To Be Used For Investing or Trading. See Terms & Conditions


One More Thing ... Get Best Stocks Delivered Daily!
Never Ever Miss A Move With Our Top Ten Stocks Lists
Find Best Stocks In Any Market - Bull or Bear Market
Take A Peek At Our Top Ten Stocks Lists: Daily, Weekly, Year-to-Date & Top Trends
Find Best Stocks In Any Market - Bull or Bear Market
Take A Peek At Our Top Ten Stocks Lists: Daily, Weekly, Year-to-Date & Top Trends
S&P 500 Stocks With Best Up Trends [0-bearish to 100-bullish]: Amgen [100], Apple [100], First Solar[100], Camden Property[100], Comerica [100], BorgWarner [100], Zions Ban[100], Teradyne [100], Extra Space[100], Fifth Third[100], Mid-America Apartment[100]
Best S&P 500 Stocks Year-to-Date:
NVIDIA [77.16%], Constellation [66.92%], NRG [48.12%], Chipotle Mexican[37.99%], Western Digital[34.49%], Micron [33.23%], Eaton [33.05%], Leidos Holdings[31.25%], Progressive [29.83%], Garmin [28.43%], Diamondback [28.35%] Best S&P 500 Stocks This Week:
Bio-Techne [19.34%], C.H. Robinson[16.15%], Amgen [16.13%], Garmin [15.09%], Moderna [15.09%], Aptiv [12.36%], Albemarle [10.87%], Amcor [10.59%], BorgWarner [9.69%], WestRock [9.1%], Leidos Holdings[8.98%] Best S&P 500 Stocks Daily:
Amgen [12.62%], Live Nation[8.46%], Enphase [6.67%], Apple [6.55%], Constellation [5.23%], Digital Realty[5.18%], Booking Holdings[5.15%], Motorola Solutions[5.04%], First Solar[4.37%], Builders FirstSource[4.21%], Arista Networks[4.10%]