
 Login Sign Up


| |||||
 |  | ||||

| 12Stocks.com Market Intelligence |
Best S&P 500 Stocks
|
On this page, you will find the most comprehensive analysis of S&P 500 stocks and ETFs - from latest trends to performances to charts ➞. First, here are the year-to-date (YTD) performances of the most requested S&P 500 stocks at 12Stocks.com (click stock for review):
| NVIDIA 70% | ||
| Caterpillar 21% | ||
| Amazon.com 19% | ||
| Merck 15% | ||
| Walmart 14% | ||
| Google 11% | ||
| Microsoft 10% | ||
| JPMorgan Chase 6% | ||
| Chevron 5% | ||
| Goldman Sachs 5% | ||
| Johnson & Johnson -8% | ||
| McDonald s -9% | ||
| Starbucks -10% | ||
| Apple -13% | ||
| Gilead -17% | ||
| Intel -29% | ||
| Boeing -35% | ||
| Quick: S&P 500 Stocks Lists: Performances & Trends, S&P 500 Stock Charts
Sort S&P 500 stocks: Daily, Weekly, Year-to-Date, Market Cap & Trends. Filter S&P 500 stocks list by sector: Show all, Tech, Finance, Energy, Staples, Retail, Industrial, Materials, Utilities and HealthCare |
| 12Stocks.com S&P 500 Stocks Performances & Trends Daily Report | |||||||||
|
| 
The overall Smart Investing & Trading Score is 36 (0-bearish to 100-bullish) which puts S&P 500 index in short term bearish to neutral trend. The Smart Investing & Trading Score from previous trading session is 26 and hence an improvement of trend. | ||||||||
Here are the Smart Investing & Trading Scores of the most requested S&P 500 stocks at 12Stocks.com (click stock name for detailed review):
|


| 12Stocks.com: Top Performing S&P 500 Index Stocks | ||||||||||||||||||||||||||||||||||||||||||||||||
 The top performing S&P 500 Index stocks year to date are
Now, more recently, over last week, the top performing S&P 500 Index stocks on the move are


|
||||||||||||||||||||||||||||||||||||||||||||||||
| 12Stocks.com: Investing in S&P 500 Index with Stocks | |
|
The following table helps investors and traders sort through current performance and trends (as measured by Smart Investing & Trading Score) of various
stocks in the S&P 500 Index. Quick View: Move mouse or cursor over stock symbol (ticker) to view short-term technical chart and over stock name to view long term chart. Click on  to add stock symbol to your watchlist and to add stock symbol to your watchlist and  to view watchlist. Click on any ticker or stock name for detailed market intelligence report for that stock. to view watchlist. Click on any ticker or stock name for detailed market intelligence report for that stock. |
12Stocks.com Performance of Stocks in S&P 500 Index
| Ticker | Stock Name | Watchlist | Category | Recent Price | Smart Investing & Trading Score | Change % | Weekly Change% |
| RL | Ralph Lauren |   | Consumer Staples | 159.25 | 43 | -1.02% | -0.65% |
| MCHP | Microchip | | Technology | 85.08 | 21 | -0.99% | -0.65% |
| IVZ | Invesco | | Financials | 15.24 | 30 | 0.33% | -0.65% |
| WST | West Pharmaceutical | | Health Care | 377.36 | 61 | -0.56% | -0.69% |
| NRG | NRG | | Utilities | 73.42 | 58 | -1.48% | -0.69% |
| PPL | PPL | | Utilities | 26.42 | 61 | 1.58% | -0.79% |
| AZO | AutoZone | | Services & Goods | 2938.26 | 51 | 0.96% | -0.81% |
| WMT | Walmart | | Services & Goods | 59.65 | 70 | -0.32% | -0.81% |
| DFS | Discover Financial | | Financials | 119.89 | 61 | 0.27% | -0.84% |
| FIS | Fidelity National | | Technology | 70.35 | 46 | -0.50% | -0.85% |
| EIX | Edison | | Utilities | 68.04 | 40 | 1.84% | -0.86% |
| NTAP | NetApp | | Technology | 100.93 | 54 | -1.57% | -0.86% |
| NWSA | News | | Services & Goods | 24.15 | 25 | 0.21% | -0.86% |
| VRTX | Vertex | | Health Care | 393.10 | 18 | -0.27% | -0.87% |
| NOC | Northrop Grumman | | Industrials | 452.05 | 44 | 0.38% | -0.89% |
| GPC | Genuine Parts | | Services & Goods | 144.07 | 54 | -0.33% | -0.90% |
| ADM | Archer-Daniels-Midland | | Consumer Staples | 60.42 | 56 | 0.25% | -0.90% |
| NUE | Nucor | | Materials | 192.78 | 38 | 0.35% | -0.90% |
| AMCR | Amcor | | Consumer Staples | 8.83 | 28 | 0.00% | -0.90% |
| FOX | Twenty-First Century | | Services & Goods | 27.98 | 35 | 0.13% | -0.90% |
| BMY | Bristol-Myers | | Health Care | 47.84 | 28 | -0.87% | -0.91% |
| IFF | Flavors | | Materials | 82.85 | 36 | -0.13% | -0.91% |
| FOXA | Fox | | Services & Goods | 30.46 | 35 | 0.20% | -0.91% |
| DTE | DTE | | Utilities | 105.27 | 40 | 2.01% | -0.92% |
| AME | AMETEK | | Industrials | 178.05 | 36 | -0.58% | -0.92% |
| For chart view version of above stock list: Chart View ➞ 0 - 25 , 25 - 50 , 50 - 75 , 75 - 100 , 100 - 125 , 125 - 150 , 150 - 175 , 175 - 200 , 200 - 225 , 225 - 250 , 250 - 275 , 275 - 300 , 300 - 325 , 325 - 350 , 350 - 375 , 375 - 400 , 400 - 425 , 425 - 450 , 450 - 475 , 475 - 500 | ||
 | Click To Change The Sort Order: By Market Cap or Company Size Performance: Year-to-date, Week and Day |  |
|
Get the most comprehensive stock market coverage daily at 12Stocks.com ➞ Best Stocks Today ➞ Best Stocks Weekly ➞ Best Stocks Year-to-Date ➞ Best Stocks Trends ➞  Best Stocks Today 12Stocks.com Best Nasdaq Stocks ➞ Best S&P 500 Stocks ➞ Best Tech Stocks ➞ Best Biotech Stocks ➞ |
| Detailed Overview of S&P 500 Stocks |
| S&P 500 Technical Overview, Leaders & Laggards, Top S&P 500 ETF Funds & Detailed S&P 500 Stocks List, Charts, Trends & More |
| S&P 500: Technical Analysis, Trends & YTD Performance | |
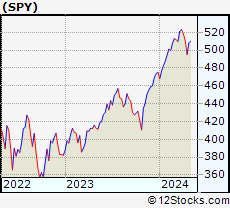
| S&P 500 index as represented by
SPY, an exchange-traded fund [ETF], holds basket of five hundred (mostly largecap) stocks from across all major sectors of the US stock market. The S&P 500 index (contains stocks like Apple and Exxon) is up by 5.31% and is currently outperforming the overall market by 0.9% year-to-date. Below is a quick view of technical charts and trends: | |
 SPY Weekly Chart |
|
| Long Term Trend: Good | |
| Medium Term Trend: Not Good | |
 SPY Daily Chart |
|
| Short Term Trend: Not Good | |
| Overall Trend Score: 36 | |
| YTD Performance: 5.31% | |
| **Trend Scores & Views Are Only For Educational Purposes And Not For Investing | |
| 12Stocks.com: Investing in S&P 500 Index using Exchange Traded Funds | |
|
The following table shows list of key exchange traded funds (ETF) that
help investors track S&P 500 index. The following list also includes leveraged ETF funds that track twice or thrice the daily returns of S&P 500 indices. Short or inverse ETF funds move in the opposite direction to the index they track and are useful during market pullbacks or during bear markets. Quick View: Move mouse or cursor over ETF symbol (ticker) to view short-term technical chart and over ETF name to view long term chart. Click on ticker or stock name for detailed view. Click on to add stock symbol to your watchlist and to view watchlist. |
12Stocks.com List of ETFs that track S&P 500 Index
| Ticker | ETF Name | Watchlist | Recent Price | Smart Investing & Trading Score | Change % | Week % | Year-to-date % |
| SPY | SPDR S&P 500 ETF | | 500.55 | 36 | -0.59 | -2.02 | 5.31% |
| IVV | iShares Core S&P 500 ETF | | 505.60 | 33 | -0.12 | -1.5 | 5.85% |
| VOO | Vanguard 500 ETF | | 462.39 | 33 | -0.13 | -1.53 | 5.86% |
| OEF | iShares S&P 100 | | 237.92 | 43 | -0.62 | -2.15 | 6.5% |
| SSO | ProShares Ultra S&P500 | | 70.66 | 36 | -1.24 | -4.07 | 8.59% |
| UPRO | ProShares UltraPro S&P500 | | 61.26 | 36 | -1.78 | -6.04 | 11.91% |
| SPXL | Direxion Daily S&P500 Bull 3X ETF | | 118.46 | 43 | -0.19 | -4.34 | 13.91% |
| SH | ProShares Short S&P500 | | 12.44 | 69 | 0.57 | 2.05 | -4.23% |
| SDS | ProShares UltraShort S&P500 | | 27.27 | 69 | 1.26 | 4.2 | -8.86% |
| SPXU | ProShares UltraPro Short S&P500 | | 37.07 | 69 | 1.90 | 6.34 | -13.79% |
| SPXS | Direxion Daily S&P 500 Bear 3X ETF | | 9.87 | 57 | 0.41 | 4.78 | -14.55% |
| 12Stocks.com: Charts, Trends, Fundamental Data and Performances of S&P 500 Stocks | |
|
We now take in-depth look at all S&P 500 stocks including charts, multi-period performances and overall trends (as measured by Smart Investing & Trading Score). One can sort S&P 500 stocks (click link to choose) by Daily, Weekly and by Year-to-Date performances. Also, one can sort by size of the company or by market capitalization. |
| Select Your Default Chart Type: | |||||
| |||||
| Click on stock symbol or name for detailed view. Click on to add stock symbol to your watchlist and to view watchlist. Quick View: Move mouse or cursor over "Daily" to quickly view daily technical stock chart and over "Weekly" to view weekly technical stock chart. | |||||

 | RL Ralph Lauren Corporation |
| Sector: Consumer Staples | |
| SubSector: Textile - Apparel Clothing | |
| MarketCap: 5589.95 Millions | |
| Recent Price: 159.25 Smart Investing & Trading Score: 43 | |
| Day Percent Change: -1.02% Day Change: -1.64 | |
| Week Change: -0.65% Year-to-date Change: 10.4% | |
| RL Links: Profile News Message Board | |
| Charts:- Daily , Weekly | |
| Add RL to Watchlist: View: Get RL Trend Analysis ➞ | |
 | MCHP Microchip Technology Incorporated |
| Sector: Technology | |
| SubSector: Semiconductor - Broad Line | |
| MarketCap: 16826.3 Millions | |
| Recent Price: 85.08 Smart Investing & Trading Score: 21 | |
| Day Percent Change: -0.99% Day Change: -0.85 | |
| Week Change: -0.65% Year-to-date Change: -5.7% | |
| MCHP Links: Profile News Message Board | |
| Charts:- Daily , Weekly | |
| Add MCHP to Watchlist: View: Get MCHP Trend Analysis ➞ | |
 | IVZ Invesco Ltd. |
| Sector: Financials | |
| SubSector: Asset Management | |
| MarketCap: 4578.23 Millions | |
| Recent Price: 15.24 Smart Investing & Trading Score: 30 | |
| Day Percent Change: 0.33% Day Change: 0.05 | |
| Week Change: -0.65% Year-to-date Change: -14.6% | |
| IVZ Links: Profile News Message Board | |
| Charts:- Daily , Weekly | |
| Add IVZ to Watchlist: View: Get IVZ Trend Analysis ➞ | |
 | WST West Pharmaceutical Services, Inc. |
| Sector: Health Care | |
| SubSector: Medical Instruments & Supplies | |
| MarketCap: 9989 Millions | |
| Recent Price: 377.36 Smart Investing & Trading Score: 61 | |
| Day Percent Change: -0.56% Day Change: -2.12 | |
| Week Change: -0.69% Year-to-date Change: 7.2% | |
| WST Links: Profile News Message Board | |
| Charts:- Daily , Weekly | |
| Add WST to Watchlist: View: Get WST Trend Analysis ➞ | |
 | NRG NRG Energy, Inc. |
| Sector: Utilities | |
| SubSector: Diversified Utilities | |
| MarketCap: 6510.7 Millions | |
| Recent Price: 73.42 Smart Investing & Trading Score: 58 | |
| Day Percent Change: -1.48% Day Change: -1.10 | |
| Week Change: -0.69% Year-to-date Change: 42.0% | |
| NRG Links: Profile News Message Board | |
| Charts:- Daily , Weekly | |
| Add NRG to Watchlist: View: Get NRG Trend Analysis ➞ | |
 | PPL PPL Corporation |
| Sector: Utilities | |
| SubSector: Electric Utilities | |
| MarketCap: 16588.8 Millions | |
| Recent Price: 26.42 Smart Investing & Trading Score: 61 | |
| Day Percent Change: 1.58% Day Change: 0.41 | |
| Week Change: -0.79% Year-to-date Change: -2.5% | |
| PPL Links: Profile News Message Board | |
| Charts:- Daily , Weekly | |
| Add PPL to Watchlist: View: Get PPL Trend Analysis ➞ | |
 | AZO AutoZone, Inc. |
| Sector: Services & Goods | |
| SubSector: Auto Parts Stores | |
| MarketCap: 19128 Millions | |
| Recent Price: 2938.26 Smart Investing & Trading Score: 51 | |
| Day Percent Change: 0.96% Day Change: 27.99 | |
| Week Change: -0.81% Year-to-date Change: 13.6% | |
| AZO Links: Profile News Message Board | |
| Charts:- Daily , Weekly | |
| Add AZO to Watchlist: View: Get AZO Trend Analysis ➞ | |
 | WMT Walmart Inc. |
| Sector: Services & Goods | |
| SubSector: Discount, Variety Stores | |
| MarketCap: 355610 Millions | |
| Recent Price: 59.65 Smart Investing & Trading Score: 70 | |
| Day Percent Change: -0.32% Day Change: -0.19 | |
| Week Change: -0.81% Year-to-date Change: 13.5% | |
| WMT Links: Profile News Message Board | |
| Charts:- Daily , Weekly | |
| Add WMT to Watchlist: View: Get WMT Trend Analysis ➞ | |
 | DFS Discover Financial Services |
| Sector: Financials | |
| SubSector: Credit Services | |
| MarketCap: 9228.88 Millions | |
| Recent Price: 119.89 Smart Investing & Trading Score: 61 | |
| Day Percent Change: 0.27% Day Change: 0.32 | |
| Week Change: -0.84% Year-to-date Change: 6.7% | |
| DFS Links: Profile News Message Board | |
| Charts:- Daily , Weekly | |
| Add DFS to Watchlist: View: Get DFS Trend Analysis ➞ | |
 | FIS Fidelity National Information Services, Inc. |
| Sector: Technology | |
| SubSector: Information Technology Services | |
| MarketCap: 71126.8 Millions | |
| Recent Price: 70.35 Smart Investing & Trading Score: 46 | |
| Day Percent Change: -0.50% Day Change: -0.35 | |
| Week Change: -0.85% Year-to-date Change: 17.1% | |
| FIS Links: Profile News Message Board | |
| Charts:- Daily , Weekly | |
| Add FIS to Watchlist: View: Get FIS Trend Analysis ➞ | |
 | EIX Edison International |
| Sector: Utilities | |
| SubSector: Electric Utilities | |
| MarketCap: 19358.1 Millions | |
| Recent Price: 68.04 Smart Investing & Trading Score: 40 | |
| Day Percent Change: 1.84% Day Change: 1.23 | |
| Week Change: -0.86% Year-to-date Change: -4.8% | |
| EIX Links: Profile News Message Board | |
| Charts:- Daily , Weekly | |
| Add EIX to Watchlist: View: Get EIX Trend Analysis ➞ | |
 | NTAP NetApp, Inc. |
| Sector: Technology | |
| SubSector: Data Storage Devices | |
| MarketCap: 9028.89 Millions | |
| Recent Price: 100.93 Smart Investing & Trading Score: 54 | |
| Day Percent Change: -1.57% Day Change: -1.61 | |
| Week Change: -0.86% Year-to-date Change: 14.5% | |
| NTAP Links: Profile News Message Board | |
| Charts:- Daily , Weekly | |
| Add NTAP to Watchlist: View: Get NTAP Trend Analysis ➞ | |
 | NWSA News Corporation |
| Sector: Services & Goods | |
| SubSector: Broadcasting - TV | |
| MarketCap: 5857.53 Millions | |
| Recent Price: 24.15 Smart Investing & Trading Score: 25 | |
| Day Percent Change: 0.21% Day Change: 0.05 | |
| Week Change: -0.86% Year-to-date Change: -1.6% | |
| NWSA Links: Profile News Message Board | |
| Charts:- Daily , Weekly | |
| Add NWSA to Watchlist: View: Get NWSA Trend Analysis ➞ | |
 | VRTX Vertex Pharmaceuticals Incorporated |
| Sector: Health Care | |
| SubSector: Biotechnology | |
| MarketCap: 57669.6 Millions | |
| Recent Price: 393.10 Smart Investing & Trading Score: 18 | |
| Day Percent Change: -0.27% Day Change: -1.07 | |
| Week Change: -0.87% Year-to-date Change: -3.4% | |
| VRTX Links: Profile News Message Board | |
| Charts:- Daily , Weekly | |
| Add VRTX to Watchlist: View: Get VRTX Trend Analysis ➞ | |
 | NOC Northrop Grumman Corporation |
| Sector: Industrials | |
| SubSector: Aerospace/Defense - Major Diversified | |
| MarketCap: 52094.9 Millions | |
| Recent Price: 452.05 Smart Investing & Trading Score: 44 | |
| Day Percent Change: 0.38% Day Change: 1.70 | |
| Week Change: -0.89% Year-to-date Change: -3.4% | |
| NOC Links: Profile News Message Board | |
| Charts:- Daily , Weekly | |
| Add NOC to Watchlist: View: Get NOC Trend Analysis ➞ | |
 | GPC Genuine Parts Company |
| Sector: Services & Goods | |
| SubSector: Auto Parts Stores | |
| MarketCap: 8605.9 Millions | |
| Recent Price: 144.07 Smart Investing & Trading Score: 54 | |
| Day Percent Change: -0.33% Day Change: -0.48 | |
| Week Change: -0.9% Year-to-date Change: 4.0% | |
| GPC Links: Profile News Message Board | |
| Charts:- Daily , Weekly | |
| Add GPC to Watchlist: View: Get GPC Trend Analysis ➞ | |
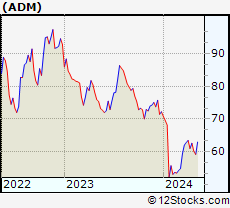 | ADM Archer-Daniels-Midland Company |
| Sector: Consumer Staples | |
| SubSector: Farm Products | |
| MarketCap: 18988.7 Millions | |
| Recent Price: 60.42 Smart Investing & Trading Score: 56 | |
| Day Percent Change: 0.25% Day Change: 0.15 | |
| Week Change: -0.9% Year-to-date Change: -16.3% | |
| ADM Links: Profile News Message Board | |
| Charts:- Daily , Weekly | |
| Add ADM to Watchlist: View: Get ADM Trend Analysis ➞ | |
 | NUE Nucor Corporation |
| Sector: Materials | |
| SubSector: Steel & Iron | |
| MarketCap: 10281.8 Millions | |
| Recent Price: 192.78 Smart Investing & Trading Score: 38 | |
| Day Percent Change: 0.35% Day Change: 0.67 | |
| Week Change: -0.9% Year-to-date Change: 10.8% | |
| NUE Links: Profile News Message Board | |
| Charts:- Daily , Weekly | |
| Add NUE to Watchlist: View: Get NUE Trend Analysis ➞ | |
 | AMCR Amcor plc |
| Sector: Consumer Staples | |
| SubSector: Packaging & Containers | |
| MarketCap: 13964 Millions | |
| Recent Price: 8.83 Smart Investing & Trading Score: 28 | |
| Day Percent Change: 0.00% Day Change: 0.00 | |
| Week Change: -0.9% Year-to-date Change: -8.4% | |
| AMCR Links: Profile News Message Board | |
| Charts:- Daily , Weekly | |
| Add AMCR to Watchlist: View: Get AMCR Trend Analysis ➞ | |
 | FOX Twenty-First Century Fox, Inc. |
| Sector: Services & Goods | |
| SubSector: Entertainment - Diversified | |
| MarketCap: 24211.2 Millions | |
| Recent Price: 27.98 Smart Investing & Trading Score: 35 | |
| Day Percent Change: 0.13% Day Change: 0.04 | |
| Week Change: -0.9% Year-to-date Change: 1.2% | |
| FOX Links: Profile News Message Board | |
| Charts:- Daily , Weekly | |
| Add FOX to Watchlist: View: Get FOX Trend Analysis ➞ | |
 | BMY Bristol-Myers Squibb Company |
| Sector: Health Care | |
| SubSector: Drug Manufacturers - Major | |
| MarketCap: 117052 Millions | |
| Recent Price: 47.84 Smart Investing & Trading Score: 28 | |
| Day Percent Change: -0.87% Day Change: -0.42 | |
| Week Change: -0.91% Year-to-date Change: -6.8% | |
| BMY Links: Profile News Message Board | |
| Charts:- Daily , Weekly | |
| Add BMY to Watchlist: View: Get BMY Trend Analysis ➞ | |
 | IFF International Flavors & Fragrances Inc. |
| Sector: Materials | |
| SubSector: Specialty Chemicals | |
| MarketCap: 12178.7 Millions | |
| Recent Price: 82.85 Smart Investing & Trading Score: 36 | |
| Day Percent Change: -0.13% Day Change: -0.11 | |
| Week Change: -0.91% Year-to-date Change: 2.3% | |
| IFF Links: Profile News Message Board | |
| Charts:- Daily , Weekly | |
| Add IFF to Watchlist: View: Get IFF Trend Analysis ➞ | |
 | FOXA Fox Corporation |
| Sector: Services & Goods | |
| SubSector: Entertainment - Diversified | |
| MarketCap: 13440.7 Millions | |
| Recent Price: 30.46 Smart Investing & Trading Score: 35 | |
| Day Percent Change: 0.20% Day Change: 0.06 | |
| Week Change: -0.91% Year-to-date Change: 2.7% | |
| FOXA Links: Profile News Message Board | |
| Charts:- Daily , Weekly | |
| Add FOXA to Watchlist: View: Get FOXA Trend Analysis ➞ | |
 | DTE DTE Energy Company |
| Sector: Utilities | |
| SubSector: Electric Utilities | |
| MarketCap: 18218.1 Millions | |
| Recent Price: 105.27 Smart Investing & Trading Score: 40 | |
| Day Percent Change: 2.01% Day Change: 2.07 | |
| Week Change: -0.92% Year-to-date Change: -4.5% | |
| DTE Links: Profile News Message Board | |
| Charts:- Daily , Weekly | |
| Add DTE to Watchlist: View: Get DTE Trend Analysis ➞ | |
 | AME AMETEK, Inc. |
| Sector: Industrials | |
| SubSector: Diversified Machinery | |
| MarketCap: 16611.8 Millions | |
| Recent Price: 178.05 Smart Investing & Trading Score: 36 | |
| Day Percent Change: -0.58% Day Change: -1.04 | |
| Week Change: -0.92% Year-to-date Change: 8.0% | |
| AME Links: Profile News Message Board | |
| Charts:- Daily , Weekly | |
| Add AME to Watchlist: View: Get AME Trend Analysis ➞ | |
| For tabular summary view of above stock list: Summary View ➞ 0 - 25 , 25 - 50 , 50 - 75 , 75 - 100 , 100 - 125 , 125 - 150 , 150 - 175 , 175 - 200 , 200 - 225 , 225 - 250 , 250 - 275 , 275 - 300 , 300 - 325 , 325 - 350 , 350 - 375 , 375 - 400 , 400 - 425 , 425 - 450 , 450 - 475 , 475 - 500 | ||
| Click To Change The Sort Order: By Market Cap or Company Size Performance: Year-to-date, Week and Day | |
| Select Chart Type: | ||
|
Best Stocks Today 12Stocks.com |
© 2024 12Stocks.com Terms & Conditions Privacy Contact Us
All Information Provided Only For Education And Not To Be Used For Investing or Trading. See Terms & Conditions


One More Thing ... Get Best Stocks Delivered Daily!
Never Ever Miss A Move With Our Top Ten Stocks Lists
Find Best Stocks In Any Market - Bull or Bear Market
Take A Peek At Our Top Ten Stocks Lists: Daily, Weekly, Year-to-Date & Top Trends
Find Best Stocks In Any Market - Bull or Bear Market
Take A Peek At Our Top Ten Stocks Lists: Daily, Weekly, Year-to-Date & Top Trends
S&P 500 Stocks With Best Up Trends [0-bearish to 100-bullish]: United Airlines[100], Charles Schwab[100], Conagra Brands[95], Lockheed Martin[86], Bunge [83], Progressive [83], Church & Dwight Co[83], NextEra [81], Delta Air[81], Freeport-McMoRan [78], Wells Fargo[76]
Best S&P 500 Stocks Year-to-Date:
NVIDIA [69.76%], Constellation [58.3%], NRG [42.01%], Meta Platforms[39.59%], Marathon [36.47%], Micron [36.3%], Western Digital[33.97%], Progressive [31.29%], Diamondback [29.73%], Targa Resources[29.19%], Eaton [28.8%] Best S&P 500 Stocks This Week:
United Airlines[16.58%], UnitedHealth [9.06%], Globe Life[7.01%], ProShares UltraPro[6.34%], American Airlines[5.63%], Morgan Stanley[4.51%], Southwest Airlines[4.5%], Goldman Sachs[3.7%], Charles Schwab[3.53%], General Mills[3.49%], Humana [3.48%] Best S&P 500 Stocks Daily:
United Airlines[17.42%], American Airlines[6.60%], Globe Life[5.44%], NextEra [3.39%], Consolidated Edison[3.33%], Norwegian Cruise[3.15%], Dominion [3.12%], Southern [3.00%], Delta Air[2.86%], First Solar[2.76%], Southwest Airlines[2.60%]