
 Login Sign Up


| |||||
 |  | ||||

| 12Stocks.com Market Intelligence |
Best SmallCap Stocks
|
| In a hurry? Small Cap Stock Lists: Performance Trends Table, Stock Charts
Sort Small Cap stocks: Daily, Weekly, Year-to-Date, Market Cap & Trends. Filter Small Cap stocks list by sector: Show all, Tech, Finance, Energy, Staples, Retail, Industrial, Materials, Utilities and HealthCare Filter Small Cap stocks list by size: All Large Medium Small and MicroCap |
| 12Stocks.com Small Cap Stocks Performances & Trends Daily | |||||||||
|
|  The overall Smart Investing & Trading Score is 69 (0-bearish to 100-bullish) which puts Small Cap index in short term neutral to bullish trend. The Smart Investing & Trading Score from previous trading session is 49 and hence an improvement of trend.
| ||||||||
Here are the Smart Investing & Trading Scores of the most requested small cap stocks at 12Stocks.com (click stock name for detailed review):
|


| 12Stocks.com: Investing in Smallcap Index with Stocks | |
|
The following table helps investors and traders sort through current performance and trends (as measured by Smart Investing & Trading Score) of various
stocks in the Smallcap Index. Quick View: Move mouse or cursor over stock symbol (ticker) to view short-term technical chart and over stock name to view long term chart. Click on  to add stock symbol to your watchlist and to add stock symbol to your watchlist and  to view watchlist. Click on any ticker or stock name for detailed market intelligence report for that stock. to view watchlist. Click on any ticker or stock name for detailed market intelligence report for that stock. |
12Stocks.com Performance of Stocks in Smallcap Index
| Ticker | Stock Name | Watchlist | Category | Recent Price | Smart Investing & Trading Score | Change % | Weekly Change% |
| ZNTL | Zentalis |   | Health Care | 11.69 | 42 | 5.22% | 5.70% |
| TRDA | Entrada | | Health Care | 13.16 | 77 | 1.70% | 5.70% |
| CIO | City Office | | Financials | 4.84 | 100 | 1.68% | 5.68% |
| VRCA | Verrica | | Health Care | 7.26 | 100 | 7.40% | 5.68% |
| CCS | Century Communities | | Industrials | 83.27 | 49 | 1.66% | 5.65% |
| LILA | Liberty Latin | | Technology | 8.04 | 100 | 0.88% | 5.65% |
| GSHD | Goosehead Insurance | | Financials | 58.63 | 45 | -0.71% | 5.64% |
| SRRK | Scholar Rock | | Health Care | 15.35 | 64 | 1.66% | 5.64% |
| MIRM | Mirum | | Health Care | 25.84 | 64 | 0.94% | 5.64% |
| VNDA | Vanda | | Health Care | 4.88 | 95 | 4.27% | 5.63% |
| AMKR | Amkor | | Technology | 32.34 | 75 | 2.15% | 5.62% |
| IDYA | IDEAYA Biosciences | | Health Care | 42.18 | 57 | 1.66% | 5.61% |
| VLY | Valley National | | Financials | 7.73 | 67 | 3.07% | 5.60% |
| MG | Mistras Group | | Services & Goods | 9.45 | 85 | 2.27% | 5.59% |
| XMTR | Xometry | | Industrials | 18.50 | 64 | 2.78% | 5.59% |
| SLDP | Solid Power | | Industrials | 1.80 | 95 | 1.98% | 5.56% |
| KTB | Kontoor Brands | | Consumer Staples | 65.65 | 95 | -2.55% | 5.55% |
| HSTM | HealthStream | | Technology | 27.03 | 69 | 0.07% | 5.54% |
| DDD | 3D Systems | | Technology | 3.62 | 59 | 1.97% | 5.54% |
| NL | NL Industries | | Services & Goods | 8.24 | 88 | 2.49% | 5.51% |
| CWT | California Water | | Utilities | 50.57 | 95 | 0.24% | 5.51% |
| HTBK | Heritage Commerce | | Financials | 8.44 | 100 | 2.80% | 5.50% |
| OB | Outbrain | | Services & Goods | 4.41 | 100 | -0.68% | 5.50% |
| IDT | IDT | | Technology | 38.13 | 100 | 1.30% | 5.48% |
| ANF | Abercrombie & Fitch Co | | Services & Goods | 128.76 | 90 | 3.09% | 5.47% |


| Too many stocks? View smallcap stocks filtered by marketcap & sector |
| Marketcap: All SmallCap Stocks (default-no microcap), Large, Mid-Range, Small |
| Smallcap Sector: Tech, Finance, Energy, Staples, Retail, Industrial, Materials, & Medical |
|
Get the most comprehensive stock market coverage daily at 12Stocks.com ➞ Best Stocks Today ➞ Best Stocks Weekly ➞ Best Stocks Year-to-Date ➞ Best Stocks Trends ➞  Best Stocks Today 12Stocks.com Best Nasdaq Stocks ➞ Best S&P 500 Stocks ➞ Best Tech Stocks ➞ Best Biotech Stocks ➞ |
| Detailed Overview of SmallCap Stocks |
| SmallCap Technical Overview, Leaders & Laggards, Top SmallCap ETF Funds & Detailed SmallCap Stocks List, Charts, Trends & More |
| Smallcap: Technical Analysis, Trends & YTD Performance | |
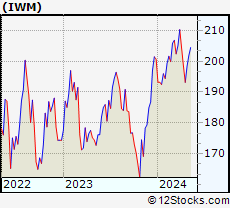
| SmallCap segment as represented by
IWM, an exchange-traded fund [ETF], holds basket of thousands of smallcap stocks from across all major sectors of the US stock market. The smallcap index (contains stocks like Riverbed & Sotheby's) is up by 0.59% and is currently underperforming the overall market by -6.29% year-to-date. Below is a quick view of technical charts and trends: | |
 IWM Weekly Chart |
|
| Long Term Trend: Not Good | |
| Medium Term Trend: Very Good | |
 IWM Daily Chart |
|
| Short Term Trend: Very Good | |
| Overall Trend Score: 69 | |
| YTD Performance: 0.59% | |
| **Trend Scores & Views Are Only For Educational Purposes And Not For Investing | |
| 12Stocks.com: Top Performing Small Cap Index Stocks | ||||||||||||||||||||||||||||||||||||||||||||||||
 The top performing Small Cap Index stocks year to date are
Now, more recently, over last week, the top performing Small Cap Index stocks on the move are


|
||||||||||||||||||||||||||||||||||||||||||||||||
| 12Stocks.com: Investing in Smallcap Index using Exchange Traded Funds | |
|
The following table shows list of key exchange traded funds (ETF) that
help investors track Smallcap index. The following list also includes leveraged ETF funds that track twice or thrice the daily returns of Smallcap indices. Short or inverse ETF funds move in the opposite direction to the index they track and are useful during market pullbacks or during bear markets. Quick View: Move mouse or cursor over ETF symbol (ticker) to view short-term technical chart and over ETF name to view long term chart. Click on ticker or stock name for detailed view. Click on to add stock symbol to your watchlist and to view watchlist. |
12Stocks.com List of ETFs that track Smallcap Index
| Ticker | ETF Name | Watchlist | Recent Price | Smart Investing & Trading Score | Change % | Week % | Year-to-date % |
| IWM | iShares Russell 2000 | | 201.90 | 69 | 0.99 | 1.77 | 0.59% |
| IJR | iShares Core S&P Small-Cap | | 107.13 | 82 | 0.75 | 1.4 | -1.03% |
| VTWO | Vanguard Russell 2000 ETF | | 81.61 | 69 | 0.94 | 1.73 | 0.63% |
| IWN | iShares Russell 2000 Value | | 154.21 | 100 | 0.87 | 2.03 | -0.72% |
| IJS | iShares S&P Small-Cap 600 Value | | 98.72 | 64 | 0.71 | 1.57 | -4.22% |
| IWO | iShares Russell 2000 Growth | | 256.87 | 57 | 0.99 | 1.49 | 1.84% |
| IJT | iShares S&P Small-Cap 600 Growth | | 127.76 | 95 | 0.82 | 1.32 | 2.09% |
| XSLV | PowerShares S&P SmallCap Low Volatil ETF | | 43.22 | 87 | 0.19 | 1.17 | -2.11% |
| SBB | ProShares Short SmallCap600 | | 16.16 | 13 | -1.28 | -1.37 | 1.44% |
| SDD | ProShares UltraShort SmallCap600 | | 18.84 | 23 | -2.41 | -2.61 | 2.27% |
| SAA | ProShares Ultra SmallCap600 | | 23.59 | 69 | 2.86 | 2.39 | -5.45% |
| SMLV | SPDR SSGA US Small Cap Low Volatil ETF | | 109.69 | 87 | 0.78 | 2.01 | -2.52% |
| 12Stocks.com: Charts, Trends, Fundamental Data and Performances of SmallCap Stocks | |
|
We now take in-depth look at all SmallCap stocks including charts, multi-period performances and overall trends (as measured by Smart Investing & Trading Score). One can sort SmallCap stocks (click link to choose) by Daily, Weekly and by Year-to-Date performances. Also, one can sort by size of the company or by market capitalization. |
| Select Your Default Chart Type: | |||||
| |||||
| Click on stock symbol or name for detailed view. Click on to add stock symbol to your watchlist and to view watchlist. Quick View: Move mouse or cursor over "Daily" to quickly view daily technical stock chart and over "Weekly" to view weekly technical stock chart. | |||||

 | ZNTL Zentalis Pharmaceuticals, Inc. |
| Sector: Health Care | |
| SubSector: Biotechnology | |
| MarketCap: 22187 Millions | |
| Recent Price: 11.69 Smart Investing & Trading Score: 42 | |
| Day Percent Change: 5.22% Day Change: 0.58 | |
| Week Change: 5.7% Year-to-date Change: -22.9% | |
| ZNTL Links: Profile News Message Board | |
| Charts:- Daily , Weekly | |
| Add ZNTL to Watchlist: View: Get Complete ZNTL Trend Analysis ➞ | |
 | TRDA Entrada Therapeutics, Inc. |
| Sector: Health Care | |
| SubSector: Biotechnology | |
| MarketCap: 481 Millions | |
| Recent Price: 13.16 Smart Investing & Trading Score: 77 | |
| Day Percent Change: 1.70% Day Change: 0.22 | |
| Week Change: 5.7% Year-to-date Change: -19.8% | |
| TRDA Links: Profile News Message Board | |
| Charts:- Daily , Weekly | |
| Add TRDA to Watchlist: View: Get Complete TRDA Trend Analysis ➞ | |
 | CIO City Office REIT, Inc. |
| Sector: Financials | |
| SubSector: REIT - Office | |
| MarketCap: 478.566 Millions | |
| Recent Price: 4.84 Smart Investing & Trading Score: 100 | |
| Day Percent Change: 1.68% Day Change: 0.08 | |
| Week Change: 5.68% Year-to-date Change: -20.8% | |
| CIO Links: Profile News Message Board | |
| Charts:- Daily , Weekly | |
| Add CIO to Watchlist: View: Get Complete CIO Trend Analysis ➞ | |
 | VRCA Verrica Pharmaceuticals Inc. |
| Sector: Health Care | |
| SubSector: Biotechnology | |
| MarketCap: 289.585 Millions | |
| Recent Price: 7.26 Smart Investing & Trading Score: 100 | |
| Day Percent Change: 7.40% Day Change: 0.50 | |
| Week Change: 5.68% Year-to-date Change: -0.8% | |
| VRCA Links: Profile News Message Board | |
| Charts:- Daily , Weekly | |
| Add VRCA to Watchlist: View: Get Complete VRCA Trend Analysis ➞ | |
 | CCS Century Communities, Inc. |
| Sector: Industrials | |
| SubSector: Residential Construction | |
| MarketCap: 459.206 Millions | |
| Recent Price: 83.27 Smart Investing & Trading Score: 49 | |
| Day Percent Change: 1.66% Day Change: 1.36 | |
| Week Change: 5.65% Year-to-date Change: -8.6% | |
| CCS Links: Profile News Message Board | |
| Charts:- Daily , Weekly | |
| Add CCS to Watchlist: View: Get Complete CCS Trend Analysis ➞ | |
 | LILA Liberty Latin America Ltd. |
| Sector: Technology | |
| SubSector: CATV Systems | |
| MarketCap: 2092.62 Millions | |
| Recent Price: 8.04 Smart Investing & Trading Score: 100 | |
| Day Percent Change: 0.88% Day Change: 0.07 | |
| Week Change: 5.65% Year-to-date Change: 10.0% | |
| LILA Links: Profile News Message Board | |
| Charts:- Daily , Weekly | |
| Add LILA to Watchlist: View: Get Complete LILA Trend Analysis ➞ | |
 | GSHD Goosehead Insurance, Inc |
| Sector: Financials | |
| SubSector: Insurance Brokers | |
| MarketCap: 1863.57 Millions | |
| Recent Price: 58.63 Smart Investing & Trading Score: 45 | |
| Day Percent Change: -0.71% Day Change: -0.42 | |
| Week Change: 5.64% Year-to-date Change: -22.7% | |
| GSHD Links: Profile News Message Board | |
| Charts:- Daily , Weekly | |
| Add GSHD to Watchlist: View: Get Complete GSHD Trend Analysis ➞ | |
 | SRRK Scholar Rock Holding Corporation |
| Sector: Health Care | |
| SubSector: Biotechnology | |
| MarketCap: 441.385 Millions | |
| Recent Price: 15.35 Smart Investing & Trading Score: 64 | |
| Day Percent Change: 1.66% Day Change: 0.25 | |
| Week Change: 5.64% Year-to-date Change: -18.4% | |
| SRRK Links: Profile News Message Board | |
| Charts:- Daily , Weekly | |
| Add SRRK to Watchlist: View: Get Complete SRRK Trend Analysis ➞ | |
 | MIRM Mirum Pharmaceuticals, Inc. |
| Sector: Health Care | |
| SubSector: Biotechnology | |
| MarketCap: 309.585 Millions | |
| Recent Price: 25.84 Smart Investing & Trading Score: 64 | |
| Day Percent Change: 0.94% Day Change: 0.24 | |
| Week Change: 5.64% Year-to-date Change: -12.5% | |
| MIRM Links: Profile News Message Board | |
| Charts:- Daily , Weekly | |
| Add MIRM to Watchlist: View: Get Complete MIRM Trend Analysis ➞ | |
 | VNDA Vanda Pharmaceuticals Inc. |
| Sector: Health Care | |
| SubSector: Biotechnology | |
| MarketCap: 464.585 Millions | |
| Recent Price: 4.88 Smart Investing & Trading Score: 95 | |
| Day Percent Change: 4.27% Day Change: 0.20 | |
| Week Change: 5.63% Year-to-date Change: 15.6% | |
| VNDA Links: Profile News Message Board | |
| Charts:- Daily , Weekly | |
| Add VNDA to Watchlist: View: Get Complete VNDA Trend Analysis ➞ | |
 | AMKR Amkor Technology, Inc. |
| Sector: Technology | |
| SubSector: Semiconductor - Integrated Circuits | |
| MarketCap: 1966.2 Millions | |
| Recent Price: 32.34 Smart Investing & Trading Score: 75 | |
| Day Percent Change: 2.15% Day Change: 0.68 | |
| Week Change: 5.62% Year-to-date Change: -2.8% | |
| AMKR Links: Profile News Message Board | |
| Charts:- Daily , Weekly | |
| Add AMKR to Watchlist: View: Get Complete AMKR Trend Analysis ➞ | |
 | IDYA IDEAYA Biosciences, Inc. |
| Sector: Health Care | |
| SubSector: Biotechnology | |
| MarketCap: 89.1785 Millions | |
| Recent Price: 42.18 Smart Investing & Trading Score: 57 | |
| Day Percent Change: 1.66% Day Change: 0.69 | |
| Week Change: 5.61% Year-to-date Change: 18.6% | |
| IDYA Links: Profile News Message Board | |
| Charts:- Daily , Weekly | |
| Add IDYA to Watchlist: View: Get Complete IDYA Trend Analysis ➞ | |
 | VLY Valley National Bancorp |
| Sector: Financials | |
| SubSector: Regional - Northeast Banks | |
| MarketCap: 2843.09 Millions | |
| Recent Price: 7.73 Smart Investing & Trading Score: 67 | |
| Day Percent Change: 3.07% Day Change: 0.23 | |
| Week Change: 5.6% Year-to-date Change: -28.8% | |
| VLY Links: Profile News Message Board | |
| Charts:- Daily , Weekly | |
| Add VLY to Watchlist: View: Get Complete VLY Trend Analysis ➞ | |
 | MG Mistras Group, Inc. |
| Sector: Services & Goods | |
| SubSector: Security & Protection Services | |
| MarketCap: 136.903 Millions | |
| Recent Price: 9.45 Smart Investing & Trading Score: 85 | |
| Day Percent Change: 2.27% Day Change: 0.21 | |
| Week Change: 5.59% Year-to-date Change: 29.1% | |
| MG Links: Profile News Message Board | |
| Charts:- Daily , Weekly | |
| Add MG to Watchlist: View: Get Complete MG Trend Analysis ➞ | |
 | XMTR Xometry, Inc. |
| Sector: Industrials | |
| SubSector: Specialty Industrial Machinery | |
| MarketCap: 1050 Millions | |
| Recent Price: 18.50 Smart Investing & Trading Score: 64 | |
| Day Percent Change: 2.78% Day Change: 0.50 | |
| Week Change: 5.59% Year-to-date Change: -49.6% | |
| XMTR Links: Profile News Message Board | |
| Charts:- Daily , Weekly | |
| Add XMTR to Watchlist: View: Get Complete XMTR Trend Analysis ➞ | |
 | SLDP Solid Power, Inc. |
| Sector: Industrials | |
| SubSector: Electrical Equipment & Parts | |
| MarketCap: 445 Millions | |
| Recent Price: 1.80 Smart Investing & Trading Score: 95 | |
| Day Percent Change: 1.98% Day Change: 0.03 | |
| Week Change: 5.56% Year-to-date Change: 26.7% | |
| SLDP Links: Profile News Message Board | |
| Charts:- Daily , Weekly | |
| Add SLDP to Watchlist: View: Get Complete SLDP Trend Analysis ➞ | |
 | KTB Kontoor Brands, Inc. |
| Sector: Consumer Staples | |
| SubSector: Textile - Apparel Clothing | |
| MarketCap: 1668.65 Millions | |
| Recent Price: 65.65 Smart Investing & Trading Score: 95 | |
| Day Percent Change: -2.55% Day Change: -1.72 | |
| Week Change: 5.55% Year-to-date Change: 5.2% | |
| KTB Links: Profile News Message Board | |
| Charts:- Daily , Weekly | |
| Add KTB to Watchlist: View: Get Complete KTB Trend Analysis ➞ | |
 | HSTM HealthStream, Inc. |
| Sector: Technology | |
| SubSector: Healthcare Information Services | |
| MarketCap: 770.255 Millions | |
| Recent Price: 27.03 Smart Investing & Trading Score: 69 | |
| Day Percent Change: 0.07% Day Change: 0.02 | |
| Week Change: 5.54% Year-to-date Change: 0.0% | |
| HSTM Links: Profile News Message Board | |
| Charts:- Daily , Weekly | |
| Add HSTM to Watchlist: View: Get Complete HSTM Trend Analysis ➞ | |
 | DDD 3D Systems Corporation |
| Sector: Technology | |
| SubSector: Computer Peripherals | |
| MarketCap: 842.989 Millions | |
| Recent Price: 3.62 Smart Investing & Trading Score: 59 | |
| Day Percent Change: 1.97% Day Change: 0.07 | |
| Week Change: 5.54% Year-to-date Change: -43.0% | |
| DDD Links: Profile News Message Board | |
| Charts:- Daily , Weekly | |
| Add DDD to Watchlist: View: Get Complete DDD Trend Analysis ➞ | |
 | NL NL Industries, Inc. |
| Sector: Services & Goods | |
| SubSector: Industrial Equipment Wholesale | |
| MarketCap: 126.258 Millions | |
| Recent Price: 8.24 Smart Investing & Trading Score: 88 | |
| Day Percent Change: 2.49% Day Change: 0.20 | |
| Week Change: 5.51% Year-to-date Change: 46.9% | |
| NL Links: Profile News Message Board | |
| Charts:- Daily , Weekly | |
| Add NL to Watchlist: View: Get Complete NL Trend Analysis ➞ | |
 | CWT California Water Service Group |
| Sector: Utilities | |
| SubSector: Water Utilities | |
| MarketCap: 2790.92 Millions | |
| Recent Price: 50.57 Smart Investing & Trading Score: 95 | |
| Day Percent Change: 0.24% Day Change: 0.12 | |
| Week Change: 5.51% Year-to-date Change: -2.5% | |
| CWT Links: Profile News Message Board | |
| Charts:- Daily , Weekly | |
| Add CWT to Watchlist: View: Get Complete CWT Trend Analysis ➞ | |
 | HTBK Heritage Commerce Corp |
| Sector: Financials | |
| SubSector: Regional - Pacific Banks | |
| MarketCap: 416.129 Millions | |
| Recent Price: 8.44 Smart Investing & Trading Score: 100 | |
| Day Percent Change: 2.80% Day Change: 0.23 | |
| Week Change: 5.5% Year-to-date Change: -14.9% | |
| HTBK Links: Profile News Message Board | |
| Charts:- Daily , Weekly | |
| Add HTBK to Watchlist: View: Get Complete HTBK Trend Analysis ➞ | |
 | OB Outbrain Inc. |
| Sector: Services & Goods | |
| SubSector: Internet Content & Information | |
| MarketCap: 250 Millions | |
| Recent Price: 4.41 Smart Investing & Trading Score: 100 | |
| Day Percent Change: -0.68% Day Change: -0.03 | |
| Week Change: 5.5% Year-to-date Change: 0.7% | |
| OB Links: Profile News Message Board | |
| Charts:- Daily , Weekly | |
| Add OB to Watchlist: View: Get Complete OB Trend Analysis ➞ | |
 | IDT IDT Corporation |
| Sector: Technology | |
| SubSector: Diversified Communication Services | |
| MarketCap: 130.064 Millions | |
| Recent Price: 38.13 Smart Investing & Trading Score: 100 | |
| Day Percent Change: 1.30% Day Change: 0.49 | |
| Week Change: 5.48% Year-to-date Change: 11.9% | |
| IDT Links: Profile News Message Board | |
| Charts:- Daily , Weekly | |
| Add IDT to Watchlist: View: Get Complete IDT Trend Analysis ➞ | |
 | ANF Abercrombie & Fitch Co. |
| Sector: Services & Goods | |
| SubSector: Apparel Stores | |
| MarketCap: 589.108 Millions | |
| Recent Price: 128.76 Smart Investing & Trading Score: 90 | |
| Day Percent Change: 3.09% Day Change: 3.86 | |
| Week Change: 5.47% Year-to-date Change: 46.0% | |
| ANF Links: Profile News Message Board | |
| Charts:- Daily , Weekly | |
| Add ANF to Watchlist: View: Get Complete ANF Trend Analysis ➞ | |
| Too many stocks? View smallcap stocks filtered by marketcap & sector |
| Marketcap: All SmallCap Stocks (default-no microcap), Large, Mid-Range, Small & MicroCap |
| Sector: Tech, Finance, Energy, Staples, Retail, Industrial, Materials, Utilities & Medical |
|
Best Stocks Today 12Stocks.com |
© 2024 12Stocks.com Terms & Conditions Privacy Contact Us
All Information Provided Only For Education And Not To Be Used For Investing or Trading. See Terms & Conditions


One More Thing ... Get Best Stocks Delivered Daily!
Never Ever Miss A Move With Our Top Ten Stocks Lists
Find Best Stocks In Any Market - Bull or Bear Market
Take A Peek At Our Top Ten Stocks Lists: Daily, Weekly, Year-to-Date & Top Trends
Find Best Stocks In Any Market - Bull or Bear Market
Take A Peek At Our Top Ten Stocks Lists: Daily, Weekly, Year-to-Date & Top Trends
Smallcap Stocks With Best Up Trends [0-bearish to 100-bullish]: Twist Bioscience[100], WideOpenWest [100], Joint [100], FTC Solar[100], Origin Materials[100], Alignment Healthcare[100], Clarus [100], IES [100], Emergent BioSolutions[100], Enovix [100], El Pollo[100]
Best Smallcap Stocks Year-to-Date:
Janux [482.74%], Viking [313.59%], Longboard [272.5%], Alpine Immune[239.29%], Bakkt [199.55%], Avidity Biosciences[192.48%], Vera [189.47%], Cullinan Oncology[176.9%], Super Micro[175.35%], Y-mAbs [151.47%], Sana [149.33%] Best Smallcap Stocks This Week:
Emergent BioSolutions[102.6%], Deciphera [73.24%], Origin Materials[66.52%], Eyenovia [60.78%], Cue Biopharma[56.04%], Aspen Aerogels[55.96%], Enovix [54.02%], Luna Innovations[53.77%], Codexis [47.37%], Carvana Co[44.31%], Office Properties[42.79%] Best Smallcap Stocks Daily:
Luna Innovations[36.00%], Twist Bioscience[28.74%], Ardelyx [28.42%], WideOpenWest [28.23%], 2U [26.63%], Joint [25.35%], FTC Solar[25.09%], Origin Materials[22.23%], Alignment Healthcare[21.97%], Clarus [18.67%], Aurora Innovation[18.09%]