
 Login Sign Up


| |||||
 |  | ||||

| 12Stocks.com Market Intelligence |
Best SmallCap Stocks
|
| In a hurry? Small Cap Stock Lists: Performance Trends Table, Stock Charts
Sort Small Cap stocks: Daily, Weekly, Year-to-Date, Market Cap & Trends. Filter Small Cap stocks list by sector: Show all, Tech, Finance, Energy, Staples, Retail, Industrial, Materials, Utilities and HealthCare Filter Small Cap stocks list by size: All Large Medium Small and MicroCap |
| 12Stocks.com Small Cap Stocks Performances & Trends Daily | |||||||||
|
|  The overall Smart Investing & Trading Score is 88 (0-bearish to 100-bullish) which puts Small Cap index in short term bullish trend. The Smart Investing & Trading Score from previous trading session is 56 and hence an improvement of trend.
| ||||||||
Here are the Smart Investing & Trading Scores of the most requested small cap stocks at 12Stocks.com (click stock name for detailed review):
|


| 12Stocks.com: Investing in Smallcap Index with Stocks | |
|
The following table helps investors and traders sort through current performance and trends (as measured by Smart Investing & Trading Score) of various
stocks in the Smallcap Index. Quick View: Move mouse or cursor over stock symbol (ticker) to view short-term technical chart and over stock name to view long term chart. Click on  to add stock symbol to your watchlist and to add stock symbol to your watchlist and  to view watchlist. Click on any ticker or stock name for detailed market intelligence report for that stock. to view watchlist. Click on any ticker or stock name for detailed market intelligence report for that stock. |
12Stocks.com Performance of Stocks in Smallcap Index
| Ticker | Stock Name | Watchlist | Category | Recent Price | Smart Investing & Trading Score | Change % | Weekly Change% |
| GLT | P. H. |   | Consumer Staples | 1.50 | 53 | 0.67% | 0.67% |
| SPNS | Sapiens | | Technology | 31.51 | 90 | 0.67% | 0.67% |
| VRA | Vera Bradley | | Consumer Staples | 6.79 | 64 | 0.67% | 0.67% |
| AHH | Armada Hoffler | | Financials | 10.64 | 74 | 0.66% | 0.66% |
| ETRN | Equitrans Midstream | | Energy | 13.83 | 100 | 0.66% | 0.66% |
| HROW | Harrow Health | | Health Care | 10.60 | 68 | 0.66% | 0.66% |
| SNCY | Sun Country | | Industrials | 13.75 | 38 | 0.66% | 0.66% |
| ANDE | Andersons | | Consumer Staples | 57.28 | 63 | 0.65% | 0.65% |
| SCL | Stepan | | Materials | 84.53 | 67 | 0.65% | 0.65% |
| JYNT | Joint | | Health Care | 12.31 | 83 | 0.65% | 0.65% |
| RYTM | Rhythm | | Health Care | 38.53 | 34 | 0.65% | 0.65% |
| MBC | MasterBrand | | Services & Goods | 17.15 | 53 | 0.65% | 0.65% |
| ALE | ALLETE | | Utilities | 59.40 | 93 | 0.64% | 0.64% |
| FOR | Forestar Group | | Financials | 31.53 | 58 | 0.64% | 0.64% |
| CERE | Cerevel | | Health Care | 42.74 | 100 | 0.64% | 0.64% |
| CNX | CNX Resources | | Energy | 24.15 | 68 | 0.63% | 0.63% |
| JBSS | John B. | | Consumer Staples | 99.89 | 57 | 0.63% | 0.63% |
| GTY | Getty Realty | | Financials | 27.09 | 67 | 0.63% | 0.63% |
| IRT | Independence Realty | | Financials | 15.96 | 68 | 0.63% | 0.63% |
| WK | Workiva | | Technology | 81.13 | 64 | 0.63% | 0.63% |
| CMCO | Columbus McKinnon | | Industrials | 42.19 | 75 | 0.62% | 0.62% |
| CLNE | Clean Energy | | Utilities | 2.44 | 60 | 0.62% | 0.62% |
| NOG | Northern Oil | | Energy | 43.54 | 95 | 0.62% | 0.62% |
| BV | BrightView | | Industrials | 11.35 | 75 | 0.62% | 0.62% |
| SIBN | SI-BONE | | Health Care | 14.66 | 27 | 0.62% | 0.62% |


| Too many stocks? View smallcap stocks filtered by marketcap & sector |
| Marketcap: All SmallCap Stocks (default-no microcap), Large, Mid-Range, Small |
| Smallcap Sector: Tech, Finance, Energy, Staples, Retail, Industrial, Materials, & Medical |
|
Get the most comprehensive stock market coverage daily at 12Stocks.com ➞ Best Stocks Today ➞ Best Stocks Weekly ➞ Best Stocks Year-to-Date ➞ Best Stocks Trends ➞  Best Stocks Today 12Stocks.com Best Nasdaq Stocks ➞ Best S&P 500 Stocks ➞ Best Tech Stocks ➞ Best Biotech Stocks ➞ |
| Detailed Overview of SmallCap Stocks |
| SmallCap Technical Overview, Leaders & Laggards, Top SmallCap ETF Funds & Detailed SmallCap Stocks List, Charts, Trends & More |
| Smallcap: Technical Analysis, Trends & YTD Performance | |
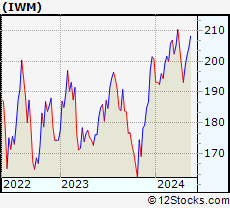
| SmallCap segment as represented by
IWM, an exchange-traded fund [ETF], holds basket of thousands of smallcap stocks from across all major sectors of the US stock market. The smallcap index (contains stocks like Riverbed & Sotheby's) is down by -0.37% and is currently underperforming the overall market by -6.93% year-to-date. Below is a quick view of technical charts and trends: | |
 IWM Weekly Chart |
|
| Long Term Trend: Very Good | |
| Medium Term Trend: Good | |
 IWM Daily Chart |
|
| Short Term Trend: Very Good | |
| Overall Trend Score: 88 | |
| YTD Performance: -0.37% | |
| **Trend Scores & Views Are Only For Educational Purposes And Not For Investing | |
| 12Stocks.com: Top Performing Small Cap Index Stocks | ||||||||||||||||||||||||||||||||||||||||||||||||
 The top performing Small Cap Index stocks year to date are
Now, more recently, over last week, the top performing Small Cap Index stocks on the move are


|
||||||||||||||||||||||||||||||||||||||||||||||||
| 12Stocks.com: Investing in Smallcap Index using Exchange Traded Funds | |
|
The following table shows list of key exchange traded funds (ETF) that
help investors track Smallcap index. The following list also includes leveraged ETF funds that track twice or thrice the daily returns of Smallcap indices. Short or inverse ETF funds move in the opposite direction to the index they track and are useful during market pullbacks or during bear markets. Quick View: Move mouse or cursor over ETF symbol (ticker) to view short-term technical chart and over ETF name to view long term chart. Click on ticker or stock name for detailed view. Click on to add stock symbol to your watchlist and to view watchlist. |
12Stocks.com List of ETFs that track Smallcap Index
| Ticker | ETF Name | Watchlist | Recent Price | Smart Investing & Trading Score | Change % | Week % | Year-to-date % |
| IWM | iShares Russell 2000 | | 199.96 | 88 | 0.79 | 0.79 | -0.37% |
| IJR | iShares Core S&P Small-Cap | | 106.41 | 93 | 0.72 | 0.72 | -1.7% |
| VTWO | Vanguard Russell 2000 ETF | | 80.78 | 88 | 0.70 | 0.7 | -0.39% |
| IWN | iShares Russell 2000 Value | | 152.05 | 93 | 0.60 | 0.6 | -2.11% |
| IWO | iShares Russell 2000 Growth | | 255.74 | 78 | 1.05 | 1.05 | 1.4% |
| IJS | iShares S&P Small-Cap 600 Value | | 97.95 | 70 | 0.78 | 0.78 | -4.97% |
| IJT | iShares S&P Small-Cap 600 Growth | | 126.96 | 88 | 0.69 | 0.69 | 1.45% |
| XSLV | PowerShares S&P SmallCap Low Volatil ETF | | 42.87 | 80 | 0.35 | 0.35 | -2.9% |
| SMLV | SPDR SSGA US Small Cap Low Volatil ETF | | 107.77 | 68 | 0.23 | 0.23 | -4.22% |
| SAA | ProShares Ultra SmallCap600 | | 23.27 | 88 | 1.00 | 1 | -6.73% |
| SBB | ProShares Short SmallCap600 | | 16.28 | 8 | -0.64 | -0.64 | 2.2% |
| SDD | ProShares UltraShort SmallCap600 | | 19.09 | 15 | -1.34 | -1.34 | 3.6% |
| 12Stocks.com: Charts, Trends, Fundamental Data and Performances of SmallCap Stocks | |
|
We now take in-depth look at all SmallCap stocks including charts, multi-period performances and overall trends (as measured by Smart Investing & Trading Score). One can sort SmallCap stocks (click link to choose) by Daily, Weekly and by Year-to-Date performances. Also, one can sort by size of the company or by market capitalization. |
| Select Your Default Chart Type: | |||||
| |||||
| Click on stock symbol or name for detailed view. Click on to add stock symbol to your watchlist and to view watchlist. Quick View: Move mouse or cursor over "Daily" to quickly view daily technical stock chart and over "Weekly" to view weekly technical stock chart. | |||||

 | GLT P. H. Glatfelter Company |
| Sector: Consumer Staples | |
| SubSector: Paper & Paper Products | |
| MarketCap: 525.003 Millions | |
| Recent Price: 1.50 Smart Investing & Trading Score: 53 | |
| Day Percent Change: 0.67% Day Change: 0.01 | |
| Week Change: 0.67% Year-to-date Change: -22.7% | |
| GLT Links: Profile News Message Board | |
| Charts:- Daily , Weekly | |
| Add GLT to Watchlist: View: Get Complete GLT Trend Analysis ➞ | |
 | SPNS Sapiens International Corporation N.V. |
| Sector: Technology | |
| SubSector: Business Software & Services | |
| MarketCap: 841.858 Millions | |
| Recent Price: 31.51 Smart Investing & Trading Score: 90 | |
| Day Percent Change: 0.67% Day Change: 0.21 | |
| Week Change: 0.67% Year-to-date Change: 8.9% | |
| SPNS Links: Profile News Message Board | |
| Charts:- Daily , Weekly | |
| Add SPNS to Watchlist: View: Get Complete SPNS Trend Analysis ➞ | |
 | VRA Vera Bradley, Inc. |
| Sector: Consumer Staples | |
| SubSector: Textile - Apparel Footwear & Accessories | |
| MarketCap: 151.17 Millions | |
| Recent Price: 6.79 Smart Investing & Trading Score: 64 | |
| Day Percent Change: 0.67% Day Change: 0.04 | |
| Week Change: 0.67% Year-to-date Change: -11.8% | |
| VRA Links: Profile News Message Board | |
| Charts:- Daily , Weekly | |
| Add VRA to Watchlist: View: Get Complete VRA Trend Analysis ➞ | |
 | AHH Armada Hoffler Properties, Inc. |
| Sector: Financials | |
| SubSector: REIT - Diversified | |
| MarketCap: 550.653 Millions | |
| Recent Price: 10.64 Smart Investing & Trading Score: 74 | |
| Day Percent Change: 0.66% Day Change: 0.07 | |
| Week Change: 0.66% Year-to-date Change: -14.0% | |
| AHH Links: Profile News Message Board | |
| Charts:- Daily , Weekly | |
| Add AHH to Watchlist: View: Get Complete AHH Trend Analysis ➞ | |
 | ETRN Equitrans Midstream Corporation |
| Sector: Energy | |
| SubSector: Independent Oil & Gas | |
| MarketCap: 1772.73 Millions | |
| Recent Price: 13.83 Smart Investing & Trading Score: 100 | |
| Day Percent Change: 0.66% Day Change: 0.09 | |
| Week Change: 0.66% Year-to-date Change: 35.9% | |
| ETRN Links: Profile News Message Board | |
| Charts:- Daily , Weekly | |
| Add ETRN to Watchlist: View: Get Complete ETRN Trend Analysis ➞ | |
 | HROW Harrow Health, Inc. |
| Sector: Health Care | |
| SubSector: Drug Manufacturers - Other | |
| MarketCap: 104.033 Millions | |
| Recent Price: 10.60 Smart Investing & Trading Score: 68 | |
| Day Percent Change: 0.66% Day Change: 0.07 | |
| Week Change: 0.66% Year-to-date Change: -5.4% | |
| HROW Links: Profile News Message Board | |
| Charts:- Daily , Weekly | |
| Add HROW to Watchlist: View: Get Complete HROW Trend Analysis ➞ | |
 | SNCY Sun Country Airlines Holdings, Inc. |
| Sector: Industrials | |
| SubSector: Airlines | |
| MarketCap: 1230 Millions | |
| Recent Price: 13.75 Smart Investing & Trading Score: 38 | |
| Day Percent Change: 0.66% Day Change: 0.09 | |
| Week Change: 0.66% Year-to-date Change: -13.1% | |
| SNCY Links: Profile News Message Board | |
| Charts:- Daily , Weekly | |
| Add SNCY to Watchlist: View: Get Complete SNCY Trend Analysis ➞ | |
 | ANDE The Andersons, Inc. |
| Sector: Consumer Staples | |
| SubSector: Farm Products | |
| MarketCap: 630.887 Millions | |
| Recent Price: 57.28 Smart Investing & Trading Score: 63 | |
| Day Percent Change: 0.65% Day Change: 0.37 | |
| Week Change: 0.65% Year-to-date Change: -0.5% | |
| ANDE Links: Profile News Message Board | |
| Charts:- Daily , Weekly | |
| Add ANDE to Watchlist: View: Get Complete ANDE Trend Analysis ➞ | |
 | SCL Stepan Company |
| Sector: Materials | |
| SubSector: Specialty Chemicals | |
| MarketCap: 1812.97 Millions | |
| Recent Price: 84.53 Smart Investing & Trading Score: 67 | |
| Day Percent Change: 0.65% Day Change: 0.55 | |
| Week Change: 0.65% Year-to-date Change: -10.6% | |
| SCL Links: Profile News Message Board | |
| Charts:- Daily , Weekly | |
| Add SCL to Watchlist: View: Get Complete SCL Trend Analysis ➞ | |
 | JYNT The Joint Corp. |
| Sector: Health Care | |
| SubSector: Hospitals | |
| MarketCap: 125.146 Millions | |
| Recent Price: 12.31 Smart Investing & Trading Score: 83 | |
| Day Percent Change: 0.65% Day Change: 0.08 | |
| Week Change: 0.65% Year-to-date Change: 28.1% | |
| JYNT Links: Profile News Message Board | |
| Charts:- Daily , Weekly | |
| Add JYNT to Watchlist: View: Get Complete JYNT Trend Analysis ➞ | |
 | RYTM Rhythm Pharmaceuticals, Inc. |
| Sector: Health Care | |
| SubSector: Biotechnology | |
| MarketCap: 643.685 Millions | |
| Recent Price: 38.53 Smart Investing & Trading Score: 34 | |
| Day Percent Change: 0.65% Day Change: 0.25 | |
| Week Change: 0.65% Year-to-date Change: -16.2% | |
| RYTM Links: Profile News Message Board | |
| Charts:- Daily , Weekly | |
| Add RYTM to Watchlist: View: Get Complete RYTM Trend Analysis ➞ | |
 | MBC MasterBrand, Inc. |
| Sector: Services & Goods | |
| SubSector: Furnishings, Fixtures & Appliances | |
| MarketCap: 1480 Millions | |
| Recent Price: 17.15 Smart Investing & Trading Score: 53 | |
| Day Percent Change: 0.65% Day Change: 0.11 | |
| Week Change: 0.65% Year-to-date Change: 14.9% | |
| MBC Links: Profile News Message Board | |
| Charts:- Daily , Weekly | |
| Add MBC to Watchlist: View: Get Complete MBC Trend Analysis ➞ | |
 | ALE ALLETE, Inc. |
| Sector: Utilities | |
| SubSector: Diversified Utilities | |
| MarketCap: 3145.4 Millions | |
| Recent Price: 59.40 Smart Investing & Trading Score: 93 | |
| Day Percent Change: 0.64% Day Change: 0.38 | |
| Week Change: 0.64% Year-to-date Change: -2.9% | |
| ALE Links: Profile News Message Board | |
| Charts:- Daily , Weekly | |
| Add ALE to Watchlist: View: Get Complete ALE Trend Analysis ➞ | |
 | FOR Forestar Group Inc. |
| Sector: Financials | |
| SubSector: Real Estate Development | |
| MarketCap: 661.019 Millions | |
| Recent Price: 31.53 Smart Investing & Trading Score: 58 | |
| Day Percent Change: 0.64% Day Change: 0.20 | |
| Week Change: 0.64% Year-to-date Change: -4.7% | |
| FOR Links: Profile News Message Board | |
| Charts:- Daily , Weekly | |
| Add FOR to Watchlist: View: Get Complete FOR Trend Analysis ➞ | |
 | CERE Cerevel Therapeutics Holdings, Inc. |
| Sector: Health Care | |
| SubSector: Biotechnology | |
| MarketCap: 21587 Millions | |
| Recent Price: 42.74 Smart Investing & Trading Score: 100 | |
| Day Percent Change: 0.64% Day Change: 0.27 | |
| Week Change: 0.64% Year-to-date Change: 0.8% | |
| CERE Links: Profile News Message Board | |
| Charts:- Daily , Weekly | |
| Add CERE to Watchlist: View: Get Complete CERE Trend Analysis ➞ | |
 | CNX CNX Resources Corporation |
| Sector: Energy | |
| SubSector: Independent Oil & Gas | |
| MarketCap: 1344.33 Millions | |
| Recent Price: 24.15 Smart Investing & Trading Score: 68 | |
| Day Percent Change: 0.63% Day Change: 0.15 | |
| Week Change: 0.63% Year-to-date Change: 20.8% | |
| CNX Links: Profile News Message Board | |
| Charts:- Daily , Weekly | |
| Add CNX to Watchlist: View: Get Complete CNX Trend Analysis ➞ | |
 | JBSS John B. Sanfilippo & Son, Inc. |
| Sector: Consumer Staples | |
| SubSector: Processed & Packaged Goods | |
| MarketCap: 899.748 Millions | |
| Recent Price: 99.89 Smart Investing & Trading Score: 57 | |
| Day Percent Change: 0.63% Day Change: 0.63 | |
| Week Change: 0.63% Year-to-date Change: -3.1% | |
| JBSS Links: Profile News Message Board | |
| Charts:- Daily , Weekly | |
| Add JBSS to Watchlist: View: Get Complete JBSS Trend Analysis ➞ | |
 | GTY Getty Realty Corp. |
| Sector: Financials | |
| SubSector: REIT - Retail | |
| MarketCap: 926.114 Millions | |
| Recent Price: 27.09 Smart Investing & Trading Score: 67 | |
| Day Percent Change: 0.63% Day Change: 0.17 | |
| Week Change: 0.63% Year-to-date Change: -7.3% | |
| GTY Links: Profile News Message Board | |
| Charts:- Daily , Weekly | |
| Add GTY to Watchlist: View: Get Complete GTY Trend Analysis ➞ | |
 | IRT Independence Realty Trust, Inc. |
| Sector: Financials | |
| SubSector: REIT - Residential | |
| MarketCap: 980.161 Millions | |
| Recent Price: 15.96 Smart Investing & Trading Score: 68 | |
| Day Percent Change: 0.63% Day Change: 0.10 | |
| Week Change: 0.63% Year-to-date Change: 4.3% | |
| IRT Links: Profile News Message Board | |
| Charts:- Daily , Weekly | |
| Add IRT to Watchlist: View: Get Complete IRT Trend Analysis ➞ | |
 | WK Workiva Inc. |
| Sector: Technology | |
| SubSector: Application Software | |
| MarketCap: 1537.42 Millions | |
| Recent Price: 81.13 Smart Investing & Trading Score: 64 | |
| Day Percent Change: 0.63% Day Change: 0.51 | |
| Week Change: 0.63% Year-to-date Change: -20.1% | |
| WK Links: Profile News Message Board | |
| Charts:- Daily , Weekly | |
| Add WK to Watchlist: View: Get Complete WK Trend Analysis ➞ | |
 | CMCO Columbus McKinnon Corporation |
| Sector: Industrials | |
| SubSector: Farm & Construction Machinery | |
| MarketCap: 598.807 Millions | |
| Recent Price: 42.19 Smart Investing & Trading Score: 75 | |
| Day Percent Change: 0.62% Day Change: 0.26 | |
| Week Change: 0.62% Year-to-date Change: 8.1% | |
| CMCO Links: Profile News Message Board | |
| Charts:- Daily , Weekly | |
| Add CMCO to Watchlist: View: Get Complete CMCO Trend Analysis ➞ | |
 | CLNE Clean Energy Fuels Corp. |
| Sector: Utilities | |
| SubSector: Gas Utilities | |
| MarketCap: 371.977 Millions | |
| Recent Price: 2.44 Smart Investing & Trading Score: 60 | |
| Day Percent Change: 0.62% Day Change: 0.01 | |
| Week Change: 0.62% Year-to-date Change: -36.2% | |
| CLNE Links: Profile News Message Board | |
| Charts:- Daily , Weekly | |
| Add CLNE to Watchlist: View: Get Complete CLNE Trend Analysis ➞ | |
 | NOG Northern Oil and Gas, Inc. |
| Sector: Energy | |
| SubSector: Oil & Gas Drilling & Exploration | |
| MarketCap: 301.939 Millions | |
| Recent Price: 43.54 Smart Investing & Trading Score: 95 | |
| Day Percent Change: 0.62% Day Change: 0.27 | |
| Week Change: 0.62% Year-to-date Change: 17.5% | |
| NOG Links: Profile News Message Board | |
| Charts:- Daily , Weekly | |
| Add NOG to Watchlist: View: Get Complete NOG Trend Analysis ➞ | |
 | BV BrightView Holdings, Inc. |
| Sector: Industrials | |
| SubSector: General Contractors | |
| MarketCap: 973.763 Millions | |
| Recent Price: 11.35 Smart Investing & Trading Score: 75 | |
| Day Percent Change: 0.62% Day Change: 0.07 | |
| Week Change: 0.62% Year-to-date Change: 34.8% | |
| BV Links: Profile News Message Board | |
| Charts:- Daily , Weekly | |
| Add BV to Watchlist: View: Get Complete BV Trend Analysis ➞ | |
 | SIBN SI-BONE, Inc. |
| Sector: Health Care | |
| SubSector: Medical Appliances & Equipment | |
| MarketCap: 234.78 Millions | |
| Recent Price: 14.66 Smart Investing & Trading Score: 27 | |
| Day Percent Change: 0.62% Day Change: 0.09 | |
| Week Change: 0.62% Year-to-date Change: -30.2% | |
| SIBN Links: Profile News Message Board | |
| Charts:- Daily , Weekly | |
| Add SIBN to Watchlist: View: Get Complete SIBN Trend Analysis ➞ | |
| Too many stocks? View smallcap stocks filtered by marketcap & sector |
| Marketcap: All SmallCap Stocks (default-no microcap), Large, Mid-Range, Small & MicroCap |
| Sector: Tech, Finance, Energy, Staples, Retail, Industrial, Materials, Utilities & Medical |
|
Best Stocks Today 12Stocks.com |
© 2024 12Stocks.com Terms & Conditions Privacy Contact Us
All Information Provided Only For Education And Not To Be Used For Investing or Trading. See Terms & Conditions


One More Thing ... Get Best Stocks Delivered Daily!
Never Ever Miss A Move With Our Top Ten Stocks Lists
Find Best Stocks In Any Market - Bull or Bear Market
Take A Peek At Our Top Ten Stocks Lists: Daily, Weekly, Year-to-Date & Top Trends
Find Best Stocks In Any Market - Bull or Bear Market
Take A Peek At Our Top Ten Stocks Lists: Daily, Weekly, Year-to-Date & Top Trends
Smallcap Stocks With Best Up Trends [0-bearish to 100-bullish]: Bakkt [100], Deciphera [100], Phibro Animal[100], Heartland Financial[100], PTC [100], Sight Sciences[100], Richardson Electronics[100], Fulton Financial[100], Cullinan Oncology[100], TPI Composites[100], Lands [100]
Best Smallcap Stocks Year-to-Date:
CareMax [572.16%], Janux [422.57%], Bakkt [346.64%], Viking [305.75%], Longboard [248.45%], Alpine Immune[239.81%], Super Micro[213.31%], Avidity Biosciences[173.17%], Arcutis Bio[170.43%], Vera [167.34%], Cullinan Oncology[166.41%] Best Smallcap Stocks This Week:
Deciphera [71.95%], Vaxxinity [35.33%], Phibro Animal[31.89%], Zevia PBC[20.94%], Velo3D [19.97%], Janux [18.32%], Acrivon [18.09%], MultiPlan [15.53%], Heartland Financial[15.24%], Codexis [14.29%], Eyenovia [13.66%] Best Smallcap Stocks Daily:
Bakkt [2391.87%], Deciphera [71.95%], Vaxxinity [35.33%], Phibro Animal[31.89%], Zevia PBC[20.94%], Velo3D [19.97%], Janux [18.32%], Acrivon [18.09%], MultiPlan [15.53%], Heartland Financial[15.24%], Codexis [14.29%]