
 Login Sign Up


| |||||
 |  | ||||

| 12Stocks.com Market Intelligence |
Best SmallCap Stocks
|
| In a hurry? Small Cap Stock Lists: Performance Trends Table, Stock Charts
Sort Small Cap stocks: Daily, Weekly, Year-to-Date, Market Cap & Trends. Filter Small Cap stocks list by sector: Show all, Tech, Finance, Energy, Staples, Retail, Industrial, Materials, Utilities and HealthCare Filter Small Cap stocks list by size: All Large Medium Small and MicroCap |
| 12Stocks.com Small Cap Stocks Performances & Trends Daily | |||||||||
|
|  The overall Smart Investing & Trading Score is 88 (0-bearish to 100-bullish) which puts Small Cap index in short term bullish trend. The Smart Investing & Trading Score from previous trading session is 56 and hence an improvement of trend.
| ||||||||
Here are the Smart Investing & Trading Scores of the most requested small cap stocks at 12Stocks.com (click stock name for detailed review):
|


| 12Stocks.com: Investing in Smallcap Index with Stocks | |
|
The following table helps investors and traders sort through current performance and trends (as measured by Smart Investing & Trading Score) of various
stocks in the Smallcap Index. Quick View: Move mouse or cursor over stock symbol (ticker) to view short-term technical chart and over stock name to view long term chart. Click on  to add stock symbol to your watchlist and to add stock symbol to your watchlist and  to view watchlist. Click on any ticker or stock name for detailed market intelligence report for that stock. to view watchlist. Click on any ticker or stock name for detailed market intelligence report for that stock. |
12Stocks.com Performance of Stocks in Smallcap Index
| Ticker | Stock Name | Watchlist | Category | Recent Price | Smart Investing & Trading Score | Change % | Weekly Change% |
| CFFN | Capitol Federal |   | Financials | 4.83 | 0 | 0.31% | 0.31% |
| KVHI | KVH Industries | | Technology | 4.79 | 28 | 0.31% | 0.31% |
| NOVT | Novanta | | Technology | 159.91 | 58 | 0.31% | 0.31% |
| FSLY | Fastly | | Technology | 12.99 | 42 | 0.31% | 0.31% |
| ONL | Orion Office | | Financials | 3.26 | 42 | 0.31% | 0.31% |
| ATRO | Astronics | | Industrials | 16.63 | 25 | 0.30% | 0.30% |
| UHG | United Homes | | Services & Goods | 6.69 | 20 | 0.30% | 0.30% |
| HONE | HarborOne Bancorp | | Financials | 10.29 | 62 | 0.29% | 0.29% |
| XERS | Xeris | | Health Care | 1.75 | 27 | 0.29% | 0.29% |
| UDMY | Udemy | | Consumer Staples | 10.22 | 23 | 0.29% | 0.29% |
| AEL | American Equity | | Financials | 56.47 | 83 | 0.28% | 0.28% |
| IDCC | InterDigital | | Technology | 100.99 | 59 | 0.28% | 0.28% |
| PBPB | Potbelly | | Services & Goods | 10.66 | 52 | 0.28% | 0.28% |
| BXMT | Blackstone Mortgage | | Financials | 17.96 | 20 | 0.28% | 0.28% |
| HP | Helmerich & Payne | | Energy | 40.50 | 23 | 0.27% | 0.27% |
| JOE | St. Joe | | Financials | 58.69 | 100 | 0.27% | 0.27% |
| BANF | BancFirst | | Financials | 89.32 | 55 | 0.27% | 0.27% |
| NHI | National Health | | Financials | 63.06 | 83 | 0.27% | 0.27% |
| FBMS | First Bancshares | | Financials | 23.97 | 42 | 0.27% | 0.27% |
| FLNG | Flex LNG | | Energy | 26.22 | 69 | 0.27% | 0.27% |
| CRSR | Corsair Gaming | | Technology | 11.33 | 49 | 0.27% | 0.27% |
| ATRC | AtriCure | | Health Care | 23.23 | 42 | 0.26% | 0.26% |
| WSR | Whitestone REIT | | Financials | 11.40 | 57 | 0.26% | 0.26% |
| KOS | Kosmos Energy | | Energy | 5.89 | 45 | 0.26% | 0.26% |
| TPH | TRI Pointe | | Industrials | 37.98 | 100 | 0.26% | 0.26% |


| Too many stocks? View smallcap stocks filtered by marketcap & sector |
| Marketcap: All SmallCap Stocks (default-no microcap), Large, Mid-Range, Small |
| Smallcap Sector: Tech, Finance, Energy, Staples, Retail, Industrial, Materials, & Medical |
|
Get the most comprehensive stock market coverage daily at 12Stocks.com ➞ Best Stocks Today ➞ Best Stocks Weekly ➞ Best Stocks Year-to-Date ➞ Best Stocks Trends ➞  Best Stocks Today 12Stocks.com Best Nasdaq Stocks ➞ Best S&P 500 Stocks ➞ Best Tech Stocks ➞ Best Biotech Stocks ➞ |
| Detailed Overview of SmallCap Stocks |
| SmallCap Technical Overview, Leaders & Laggards, Top SmallCap ETF Funds & Detailed SmallCap Stocks List, Charts, Trends & More |
| Smallcap: Technical Analysis, Trends & YTD Performance | |
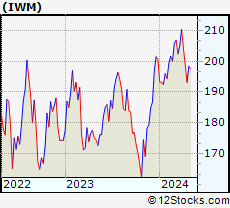
| SmallCap segment as represented by
IWM, an exchange-traded fund [ETF], holds basket of thousands of smallcap stocks from across all major sectors of the US stock market. The smallcap index (contains stocks like Riverbed & Sotheby's) is down by -0.36% and is currently underperforming the overall market by -6.65% year-to-date. Below is a quick view of technical charts and trends: | |
 IWM Weekly Chart |
|
| Long Term Trend: Very Good | |
| Medium Term Trend: Good | |
 IWM Daily Chart |
|
| Short Term Trend: Very Good | |
| Overall Trend Score: 88 | |
| YTD Performance: -0.36% | |
| **Trend Scores & Views Are Only For Educational Purposes And Not For Investing | |
| 12Stocks.com: Top Performing Small Cap Index Stocks | ||||||||||||||||||||||||||||||||||||||||||||||||
 The top performing Small Cap Index stocks year to date are
Now, more recently, over last week, the top performing Small Cap Index stocks on the move are


|
||||||||||||||||||||||||||||||||||||||||||||||||
| 12Stocks.com: Investing in Smallcap Index using Exchange Traded Funds | |
|
The following table shows list of key exchange traded funds (ETF) that
help investors track Smallcap index. The following list also includes leveraged ETF funds that track twice or thrice the daily returns of Smallcap indices. Short or inverse ETF funds move in the opposite direction to the index they track and are useful during market pullbacks or during bear markets. Quick View: Move mouse or cursor over ETF symbol (ticker) to view short-term technical chart and over ETF name to view long term chart. Click on ticker or stock name for detailed view. Click on to add stock symbol to your watchlist and to view watchlist. |
12Stocks.com List of ETFs that track Smallcap Index
| Ticker | ETF Name | Watchlist | Recent Price | Smart Investing & Trading Score | Change % | Week % | Year-to-date % |
| IWM | iShares Russell 2000 | | 199.98 | 88 | 0.80 | 0.8 | -0.36% |
| VTWO | Vanguard Russell 2000 ETF | | 80.77 | 88 | 0.69 | 0.69 | -0.41% |
| IWN | iShares Russell 2000 Value | | 152.09 | 93 | 0.63 | 0.63 | -2.09% |
| IJR | iShares Core S&P Small-Cap | | 106.37 | 93 | 0.68 | 0.68 | -1.74% |
| IWO | iShares Russell 2000 Growth | | 255.17 | 78 | 0.82 | 0.82 | 1.17% |
| IJS | iShares S&P Small-Cap 600 Value | | 97.96 | 70 | 0.79 | 0.79 | -4.96% |
| XSLV | PowerShares S&P SmallCap Low Volatil ETF | | 42.97 | 80 | 0.59 | 0.59 | -2.67% |
| IJT | iShares S&P Small-Cap 600 Growth | | 126.09 | 88 | 0.00 | 0 | 0.76% |
| SAA | ProShares Ultra SmallCap600 | | 23.27 | 88 | 1.00 | 1 | -6.73% |
| SBB | ProShares Short SmallCap600 | | 16.28 | 8 | -0.64 | -0.64 | 2.2% |
| SMLV | SPDR SSGA US Small Cap Low Volatil ETF | | 107.62 | 75 | 0.10 | 0.1 | -4.35% |
| SDD | ProShares UltraShort SmallCap600 | | 19.09 | 15 | -1.34 | -1.34 | 3.6% |
| 12Stocks.com: Charts, Trends, Fundamental Data and Performances of SmallCap Stocks | |
|
We now take in-depth look at all SmallCap stocks including charts, multi-period performances and overall trends (as measured by Smart Investing & Trading Score). One can sort SmallCap stocks (click link to choose) by Daily, Weekly and by Year-to-Date performances. Also, one can sort by size of the company or by market capitalization. |
| Select Your Default Chart Type: | |||||
| |||||
| Click on stock symbol or name for detailed view. Click on to add stock symbol to your watchlist and to view watchlist. Quick View: Move mouse or cursor over "Daily" to quickly view daily technical stock chart and over "Weekly" to view weekly technical stock chart. | |||||

 | CFFN Capitol Federal Financial, Inc. |
| Sector: Financials | |
| SubSector: Savings & Loans | |
| MarketCap: 1639.1 Millions | |
| Recent Price: 4.83 Smart Investing & Trading Score: 0 | |
| Day Percent Change: 0.31% Day Change: 0.02 | |
| Week Change: 0.31% Year-to-date Change: -25.2% | |
| CFFN Links: Profile News Message Board | |
| Charts:- Daily , Weekly | |
| Add CFFN to Watchlist: View: Get Complete CFFN Trend Analysis ➞ | |
 | KVHI KVH Industries, Inc. |
| Sector: Technology | |
| SubSector: Communication Equipment | |
| MarketCap: 169.939 Millions | |
| Recent Price: 4.79 Smart Investing & Trading Score: 28 | |
| Day Percent Change: 0.31% Day Change: 0.01 | |
| Week Change: 0.31% Year-to-date Change: -8.8% | |
| KVHI Links: Profile News Message Board | |
| Charts:- Daily , Weekly | |
| Add KVHI to Watchlist: View: Get Complete KVHI Trend Analysis ➞ | |
 | NOVT Novanta Inc. |
| Sector: Technology | |
| SubSector: Scientific & Technical Instruments | |
| MarketCap: 2680.83 Millions | |
| Recent Price: 159.91 Smart Investing & Trading Score: 58 | |
| Day Percent Change: 0.31% Day Change: 0.50 | |
| Week Change: 0.31% Year-to-date Change: -5.1% | |
| NOVT Links: Profile News Message Board | |
| Charts:- Daily , Weekly | |
| Add NOVT to Watchlist: View: Get Complete NOVT Trend Analysis ➞ | |
 | FSLY Fastly, Inc. |
| Sector: Technology | |
| SubSector: Application Software | |
| MarketCap: 1973.72 Millions | |
| Recent Price: 12.99 Smart Investing & Trading Score: 42 | |
| Day Percent Change: 0.31% Day Change: 0.04 | |
| Week Change: 0.31% Year-to-date Change: -27.0% | |
| FSLY Links: Profile News Message Board | |
| Charts:- Daily , Weekly | |
| Add FSLY to Watchlist: View: Get Complete FSLY Trend Analysis ➞ | |
 | ONL Orion Office REIT Inc. |
| Sector: Financials | |
| SubSector: REIT - Office | |
| MarketCap: 375 Millions | |
| Recent Price: 3.26 Smart Investing & Trading Score: 42 | |
| Day Percent Change: 0.31% Day Change: 0.01 | |
| Week Change: 0.31% Year-to-date Change: -43.0% | |
| ONL Links: Profile News Message Board | |
| Charts:- Daily , Weekly | |
| Add ONL to Watchlist: View: Get Complete ONL Trend Analysis ➞ | |
 | ATRO Astronics Corporation |
| Sector: Industrials | |
| SubSector: Aerospace/Defense Products & Services | |
| MarketCap: 287.201 Millions | |
| Recent Price: 16.63 Smart Investing & Trading Score: 25 | |
| Day Percent Change: 0.30% Day Change: 0.05 | |
| Week Change: 0.3% Year-to-date Change: -4.5% | |
| ATRO Links: Profile News Message Board | |
| Charts:- Daily , Weekly | |
| Add ATRO to Watchlist: View: Get Complete ATRO Trend Analysis ➞ | |
 | UHG United Homes Group, Inc. |
| Sector: Services & Goods | |
| SubSector: Residential Construction | |
| MarketCap: 566 Millions | |
| Recent Price: 6.69 Smart Investing & Trading Score: 20 | |
| Day Percent Change: 0.30% Day Change: 0.02 | |
| Week Change: 0.3% Year-to-date Change: -20.3% | |
| UHG Links: Profile News Message Board | |
| Charts:- Daily , Weekly | |
| Add UHG to Watchlist: View: Get Complete UHG Trend Analysis ➞ | |
 | HONE HarborOne Bancorp, Inc. |
| Sector: Financials | |
| SubSector: Savings & Loans | |
| MarketCap: 456.03 Millions | |
| Recent Price: 10.29 Smart Investing & Trading Score: 62 | |
| Day Percent Change: 0.29% Day Change: 0.03 | |
| Week Change: 0.29% Year-to-date Change: -14.1% | |
| HONE Links: Profile News Message Board | |
| Charts:- Daily , Weekly | |
| Add HONE to Watchlist: View: Get Complete HONE Trend Analysis ➞ | |
 | XERS Xeris Pharmaceuticals, Inc. |
| Sector: Health Care | |
| SubSector: Biotechnology | |
| MarketCap: 74.5785 Millions | |
| Recent Price: 1.75 Smart Investing & Trading Score: 27 | |
| Day Percent Change: 0.29% Day Change: 0.00 | |
| Week Change: 0.29% Year-to-date Change: -25.5% | |
| XERS Links: Profile News Message Board | |
| Charts:- Daily , Weekly | |
| Add XERS to Watchlist: View: Get Complete XERS Trend Analysis ➞ | |
 | UDMY Udemy, Inc. |
| Sector: Consumer Staples | |
| SubSector: Education & Training Services | |
| MarketCap: 1570 Millions | |
| Recent Price: 10.22 Smart Investing & Trading Score: 23 | |
| Day Percent Change: 0.29% Day Change: 0.03 | |
| Week Change: 0.29% Year-to-date Change: -31.4% | |
| UDMY Links: Profile News Message Board | |
| Charts:- Daily , Weekly | |
| Add UDMY to Watchlist: View: Get Complete UDMY Trend Analysis ➞ | |
 | AEL American Equity Investment Life Holding Company |
| Sector: Financials | |
| SubSector: Life Insurance | |
| MarketCap: 1304.46 Millions | |
| Recent Price: 56.47 Smart Investing & Trading Score: 83 | |
| Day Percent Change: 0.28% Day Change: 0.16 | |
| Week Change: 0.28% Year-to-date Change: 1.2% | |
| AEL Links: Profile News Message Board | |
| Charts:- Daily , Weekly | |
| Add AEL to Watchlist: View: Get Complete AEL Trend Analysis ➞ | |
 | IDCC InterDigital, Inc. |
| Sector: Technology | |
| SubSector: Wireless Communications | |
| MarketCap: 1225.27 Millions | |
| Recent Price: 100.99 Smart Investing & Trading Score: 59 | |
| Day Percent Change: 0.28% Day Change: 0.28 | |
| Week Change: 0.28% Year-to-date Change: -7.0% | |
| IDCC Links: Profile News Message Board | |
| Charts:- Daily , Weekly | |
| Add IDCC to Watchlist: View: Get Complete IDCC Trend Analysis ➞ | |
 | PBPB Potbelly Corporation |
| Sector: Services & Goods | |
| SubSector: Specialty Eateries | |
| MarketCap: 58.8 Millions | |
| Recent Price: 10.66 Smart Investing & Trading Score: 52 | |
| Day Percent Change: 0.28% Day Change: 0.03 | |
| Week Change: 0.28% Year-to-date Change: 2.3% | |
| PBPB Links: Profile News Message Board | |
| Charts:- Daily , Weekly | |
| Add PBPB to Watchlist: View: Get Complete PBPB Trend Analysis ➞ | |
 | BXMT Blackstone Mortgage Trust, Inc. |
| Sector: Financials | |
| SubSector: Mortgage Investment | |
| MarketCap: 2820.69 Millions | |
| Recent Price: 17.96 Smart Investing & Trading Score: 20 | |
| Day Percent Change: 0.28% Day Change: 0.05 | |
| Week Change: 0.28% Year-to-date Change: -15.6% | |
| BXMT Links: Profile News Message Board | |
| Charts:- Daily , Weekly | |
| Add BXMT to Watchlist: View: Get Complete BXMT Trend Analysis ➞ | |
 | HP Helmerich & Payne, Inc. |
| Sector: Energy | |
| SubSector: Oil & Gas Drilling & Exploration | |
| MarketCap: 1796.39 Millions | |
| Recent Price: 40.50 Smart Investing & Trading Score: 23 | |
| Day Percent Change: 0.27% Day Change: 0.11 | |
| Week Change: 0.27% Year-to-date Change: 11.8% | |
| HP Links: Profile News Message Board | |
| Charts:- Daily , Weekly | |
| Add HP to Watchlist: View: Get Complete HP Trend Analysis ➞ | |
 | JOE The St. Joe Company |
| Sector: Financials | |
| SubSector: Real Estate Development | |
| MarketCap: 1029.39 Millions | |
| Recent Price: 58.69 Smart Investing & Trading Score: 100 | |
| Day Percent Change: 0.27% Day Change: 0.16 | |
| Week Change: 0.27% Year-to-date Change: -2.5% | |
| JOE Links: Profile News Message Board | |
| Charts:- Daily , Weekly | |
| Add JOE to Watchlist: View: Get Complete JOE Trend Analysis ➞ | |
 | BANF BancFirst Corporation |
| Sector: Financials | |
| SubSector: Regional - Southwest Banks | |
| MarketCap: 1068.65 Millions | |
| Recent Price: 89.32 Smart Investing & Trading Score: 55 | |
| Day Percent Change: 0.27% Day Change: 0.24 | |
| Week Change: 0.27% Year-to-date Change: -8.2% | |
| BANF Links: Profile News Message Board | |
| Charts:- Daily , Weekly | |
| Add BANF to Watchlist: View: Get Complete BANF Trend Analysis ➞ | |
 | NHI National Health Investors, Inc. |
| Sector: Financials | |
| SubSector: REIT - Healthcare Facilities | |
| MarketCap: 2156.54 Millions | |
| Recent Price: 63.06 Smart Investing & Trading Score: 83 | |
| Day Percent Change: 0.27% Day Change: 0.17 | |
| Week Change: 0.27% Year-to-date Change: 12.9% | |
| NHI Links: Profile News Message Board | |
| Charts:- Daily , Weekly | |
| Add NHI to Watchlist: View: Get Complete NHI Trend Analysis ➞ | |
 | FBMS The First Bancshares, Inc. |
| Sector: Financials | |
| SubSector: Regional - Southeast Banks | |
| MarketCap: 359.535 Millions | |
| Recent Price: 23.97 Smart Investing & Trading Score: 42 | |
| Day Percent Change: 0.27% Day Change: 0.07 | |
| Week Change: 0.27% Year-to-date Change: -18.3% | |
| FBMS Links: Profile News Message Board | |
| Charts:- Daily , Weekly | |
| Add FBMS to Watchlist: View: Get Complete FBMS Trend Analysis ➞ | |
 | FLNG Flex LNG Ltd. |
| Sector: Energy | |
| SubSector: Oil & Gas Equipment & Services | |
| MarketCap: 220.261 Millions | |
| Recent Price: 26.22 Smart Investing & Trading Score: 69 | |
| Day Percent Change: 0.27% Day Change: 0.07 | |
| Week Change: 0.27% Year-to-date Change: -9.8% | |
| FLNG Links: Profile News Message Board | |
| Charts:- Daily , Weekly | |
| Add FLNG to Watchlist: View: Get Complete FLNG Trend Analysis ➞ | |
 | CRSR Corsair Gaming, Inc. |
| Sector: Technology | |
| SubSector: Computer Hardware | |
| MarketCap: 32187 Millions | |
| Recent Price: 11.33 Smart Investing & Trading Score: 49 | |
| Day Percent Change: 0.27% Day Change: 0.03 | |
| Week Change: 0.27% Year-to-date Change: -19.7% | |
| CRSR Links: Profile News Message Board | |
| Charts:- Daily , Weekly | |
| Add CRSR to Watchlist: View: Get Complete CRSR Trend Analysis ➞ | |
 | ATRC AtriCure, Inc. |
| Sector: Health Care | |
| SubSector: Medical Instruments & Supplies | |
| MarketCap: 1158.7 Millions | |
| Recent Price: 23.23 Smart Investing & Trading Score: 42 | |
| Day Percent Change: 0.26% Day Change: 0.06 | |
| Week Change: 0.26% Year-to-date Change: -34.9% | |
| ATRC Links: Profile News Message Board | |
| Charts:- Daily , Weekly | |
| Add ATRC to Watchlist: View: Get Complete ATRC Trend Analysis ➞ | |
 | WSR Whitestone REIT |
| Sector: Financials | |
| SubSector: REIT - Retail | |
| MarketCap: 316.114 Millions | |
| Recent Price: 11.40 Smart Investing & Trading Score: 57 | |
| Day Percent Change: 0.26% Day Change: 0.03 | |
| Week Change: 0.26% Year-to-date Change: -7.2% | |
| WSR Links: Profile News Message Board | |
| Charts:- Daily , Weekly | |
| Add WSR to Watchlist: View: Get Complete WSR Trend Analysis ➞ | |
 | KOS Kosmos Energy Ltd. |
| Sector: Energy | |
| SubSector: Independent Oil & Gas | |
| MarketCap: 261.693 Millions | |
| Recent Price: 5.89 Smart Investing & Trading Score: 45 | |
| Day Percent Change: 0.26% Day Change: 0.01 | |
| Week Change: 0.26% Year-to-date Change: -12.2% | |
| KOS Links: Profile News Message Board | |
| Charts:- Daily , Weekly | |
| Add KOS to Watchlist: View: Get Complete KOS Trend Analysis ➞ | |
 | TPH TRI Pointe Group, Inc. |
| Sector: Industrials | |
| SubSector: Residential Construction | |
| MarketCap: 1140.06 Millions | |
| Recent Price: 37.98 Smart Investing & Trading Score: 100 | |
| Day Percent Change: 0.26% Day Change: 0.10 | |
| Week Change: 0.26% Year-to-date Change: 7.3% | |
| TPH Links: Profile News Message Board | |
| Charts:- Daily , Weekly | |
| Add TPH to Watchlist: View: Get Complete TPH Trend Analysis ➞ | |
| Too many stocks? View smallcap stocks filtered by marketcap & sector |
| Marketcap: All SmallCap Stocks (default-no microcap), Large, Mid-Range, Small & MicroCap |
| Sector: Tech, Finance, Energy, Staples, Retail, Industrial, Materials, Utilities & Medical |
|
Best Stocks Today 12Stocks.com |
© 2024 12Stocks.com Terms & Conditions Privacy Contact Us
All Information Provided Only For Education And Not To Be Used For Investing or Trading. See Terms & Conditions


One More Thing ... Get Best Stocks Delivered Daily!
Never Ever Miss A Move With Our Top Ten Stocks Lists
Find Best Stocks In Any Market - Bull or Bear Market
Take A Peek At Our Top Ten Stocks Lists: Daily, Weekly, Year-to-Date & Top Trends
Find Best Stocks In Any Market - Bull or Bear Market
Take A Peek At Our Top Ten Stocks Lists: Daily, Weekly, Year-to-Date & Top Trends
Smallcap Stocks With Best Up Trends [0-bearish to 100-bullish]: Bakkt [100], Deciphera [100], Phibro Animal[100], Heartland Financial[100], Sight Sciences[100], PTC [100], TPI Composites[100], Cullinan Oncology[100], Fulton Financial[100], Xencor [100], Richardson Electronics[100]
Best Smallcap Stocks Year-to-Date:
Janux [413.54%], Bakkt [355.16%], Viking [305.7%], Alpine Immune[239.57%], Longboard [237.23%], Super Micro[213.88%], Avidity Biosciences[175.17%], Arcutis Bio[170.43%], Cullinan Oncology[169.84%], Vera [164.02%], Hippo [137.76%] Best Smallcap Stocks This Week:
Deciphera [71.95%], Phibro Animal[28.32%], Vaxxinity [20.15%], Heartland Financial[18.56%], Janux [16.28%], Acrivon [16.08%], Velo3D [14.96%], MultiPlan [14.93%], Amprius [14.37%], Codexis [13.72%], ESS Tech[13.67%] Best Smallcap Stocks Daily:
Bakkt [2439.40%], Deciphera [71.95%], Phibro Animal[28.32%], Vaxxinity [20.15%], Heartland Financial[18.56%], Janux [16.28%], Acrivon [16.08%], Velo3D [14.96%], MultiPlan [14.93%], Amprius [14.37%], Codexis [13.72%]