
 Login Sign Up


| |||||
 |  | ||||

| 12Stocks.com Market Intelligence |
Best SmallCap Stocks
|
| In a hurry? Small Cap Stock Lists: Performance Trends Table, Stock Charts
Sort Small Cap stocks: Daily, Weekly, Year-to-Date, Market Cap & Trends. Filter Small Cap stocks list by sector: Show all, Tech, Finance, Energy, Staples, Retail, Industrial, Materials, Utilities and HealthCare Filter Small Cap stocks list by size: All Large Medium Small and MicroCap |
| 12Stocks.com Small Cap Stocks Performances & Trends Daily | |||||||||
|
|  The overall Smart Investing & Trading Score is 69 (0-bearish to 100-bullish) which puts Small Cap index in short term neutral to bullish trend. The Smart Investing & Trading Score from previous trading session is 49 and hence an improvement of trend.
| ||||||||
Here are the Smart Investing & Trading Scores of the most requested small cap stocks at 12Stocks.com (click stock name for detailed review):
|


| 12Stocks.com: Investing in Smallcap Index with Stocks | |
|
The following table helps investors and traders sort through current performance and trends (as measured by Smart Investing & Trading Score) of various
stocks in the Smallcap Index. Quick View: Move mouse or cursor over stock symbol (ticker) to view short-term technical chart and over stock name to view long term chart. Click on  to add stock symbol to your watchlist and to add stock symbol to your watchlist and  to view watchlist. Click on any ticker or stock name for detailed market intelligence report for that stock. to view watchlist. Click on any ticker or stock name for detailed market intelligence report for that stock. |
12Stocks.com Performance of Stocks in Smallcap Index
| Ticker | Stock Name | Watchlist | Category | Recent Price | Smart Investing & Trading Score | Change % | Weekly Change% |
| RM | Regional Management |   | Financials | 28.34 | 100 | 3.73% | 7.27% |
| PAYS | PaySign | | Services & Goods | 4.73 | 100 | 2.60% | 7.26% |
| PCT | PureCycle | | Industrials | 5.34 | 49 | 9.31% | 7.23% |
| FOR | Forestar Group | | Financials | 33.57 | 52 | 3.84% | 7.15% |
| OLMA | Olema | | Health Care | 10.66 | 49 | 5.86% | 7.14% |
| IGMS | IGM Biosciences | | Health Care | 10.07 | 74 | 6.79% | 7.13% |
| SMBK | SmartFinancial | | Financials | 22.13 | 100 | 2.69% | 7.12% |
| MYGN | Myriad Genetics | | Services & Goods | 19.47 | 49 | 1.30% | 7.10% |
| GKOS | Glaukos | | Health Care | 106.51 | 100 | 1.41% | 7.07% |
| LOVE | Lovesac | | Consumer Staples | 23.38 | 100 | 4.89% | 7.05% |
| MMSI | Merit Medical | | Health Care | 78.97 | 100 | 2.53% | 7.03% |
| VRRM | Verra Mobility | | Services & Goods | 25.93 | 100 | 7.64% | 7.02% |
| COCO | Vita Coco | | Consumer Staples | 26.46 | 93 | -1.75% | 7.00% |
| ADTN | ADTRAN | | Technology | 4.74 | 60 | 2.60% | 7.00% |
| INZY | Inozyme Pharma | | Health Care | 4.75 | 39 | 2.15% | 6.98% |
| BCRX | BioCryst | | Health Care | 4.45 | 59 | -0.67% | 6.97% |
| FLGT | Fulgent Genetics | | Health Care | 21.50 | 74 | 1.22% | 6.97% |
| ORA | Ormat | | Utilities | 67.50 | 100 | 1.18% | 6.96% |
| GVA | Granite Construction | | Industrials | 59.39 | 100 | 3.72% | 6.95% |
| HBNC | Horizon Bancorp | | Financials | 12.47 | 100 | 0.48% | 6.95% |
| BY | Byline Bancorp | | Financials | 23.28 | 100 | 2.11% | 6.89% |
| FFIC | Flushing Financial | | Financials | 12.15 | 67 | 2.97% | 6.86% |
| FATE | Fate | | Health Care | 4.06 | 37 | -0.98% | 6.84% |
| PI | Impinj | | Technology | 161.23 | 90 | 0.94% | 6.84% |
| SPCE | Virgin Galactic | | Industrials | 0.95 | 54 | 7.50% | 6.82% |


| Too many stocks? View smallcap stocks filtered by marketcap & sector |
| Marketcap: All SmallCap Stocks (default-no microcap), Large, Mid-Range, Small |
| Smallcap Sector: Tech, Finance, Energy, Staples, Retail, Industrial, Materials, & Medical |
|
Get the most comprehensive stock market coverage daily at 12Stocks.com ➞ Best Stocks Today ➞ Best Stocks Weekly ➞ Best Stocks Year-to-Date ➞ Best Stocks Trends ➞  Best Stocks Today 12Stocks.com Best Nasdaq Stocks ➞ Best S&P 500 Stocks ➞ Best Tech Stocks ➞ Best Biotech Stocks ➞ |
| Detailed Overview of SmallCap Stocks |
| SmallCap Technical Overview, Leaders & Laggards, Top SmallCap ETF Funds & Detailed SmallCap Stocks List, Charts, Trends & More |
| Smallcap: Technical Analysis, Trends & YTD Performance | |
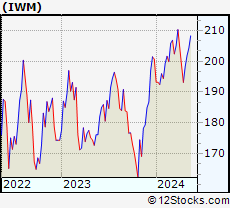
| SmallCap segment as represented by
IWM, an exchange-traded fund [ETF], holds basket of thousands of smallcap stocks from across all major sectors of the US stock market. The smallcap index (contains stocks like Riverbed & Sotheby's) is up by 0.59% and is currently underperforming the overall market by -6.29% year-to-date. Below is a quick view of technical charts and trends: | |
 IWM Weekly Chart |
|
| Long Term Trend: Not Good | |
| Medium Term Trend: Very Good | |
 IWM Daily Chart |
|
| Short Term Trend: Very Good | |
| Overall Trend Score: 69 | |
| YTD Performance: 0.59% | |
| **Trend Scores & Views Are Only For Educational Purposes And Not For Investing | |
| 12Stocks.com: Top Performing Small Cap Index Stocks | ||||||||||||||||||||||||||||||||||||||||||||||||
 The top performing Small Cap Index stocks year to date are
Now, more recently, over last week, the top performing Small Cap Index stocks on the move are


|
||||||||||||||||||||||||||||||||||||||||||||||||
| 12Stocks.com: Investing in Smallcap Index using Exchange Traded Funds | |
|
The following table shows list of key exchange traded funds (ETF) that
help investors track Smallcap index. The following list also includes leveraged ETF funds that track twice or thrice the daily returns of Smallcap indices. Short or inverse ETF funds move in the opposite direction to the index they track and are useful during market pullbacks or during bear markets. Quick View: Move mouse or cursor over ETF symbol (ticker) to view short-term technical chart and over ETF name to view long term chart. Click on ticker or stock name for detailed view. Click on to add stock symbol to your watchlist and to view watchlist. |
12Stocks.com List of ETFs that track Smallcap Index
| Ticker | ETF Name | Watchlist | Recent Price | Smart Investing & Trading Score | Change % | Week % | Year-to-date % |
| IWM | iShares Russell 2000 | | 201.90 | 69 | 0.99 | 1.77 | 0.59% |
| IJR | iShares Core S&P Small-Cap | | 107.13 | 82 | 0.75 | 1.4 | -1.03% |
| VTWO | Vanguard Russell 2000 ETF | | 81.61 | 69 | 0.94 | 1.73 | 0.63% |
| IWN | iShares Russell 2000 Value | | 154.21 | 100 | 0.87 | 2.03 | -0.72% |
| IJS | iShares S&P Small-Cap 600 Value | | 98.72 | 64 | 0.71 | 1.57 | -4.22% |
| IWO | iShares Russell 2000 Growth | | 256.87 | 57 | 0.99 | 1.49 | 1.84% |
| IJT | iShares S&P Small-Cap 600 Growth | | 127.76 | 95 | 0.82 | 1.32 | 2.09% |
| XSLV | PowerShares S&P SmallCap Low Volatil ETF | | 43.22 | 87 | 0.19 | 1.17 | -2.11% |
| SBB | ProShares Short SmallCap600 | | 16.16 | 13 | -1.28 | -1.37 | 1.44% |
| SDD | ProShares UltraShort SmallCap600 | | 18.84 | 23 | -2.41 | -2.61 | 2.27% |
| SAA | ProShares Ultra SmallCap600 | | 23.59 | 69 | 2.86 | 2.39 | -5.45% |
| SMLV | SPDR SSGA US Small Cap Low Volatil ETF | | 109.69 | 87 | 0.78 | 2.01 | -2.52% |
| 12Stocks.com: Charts, Trends, Fundamental Data and Performances of SmallCap Stocks | |
|
We now take in-depth look at all SmallCap stocks including charts, multi-period performances and overall trends (as measured by Smart Investing & Trading Score). One can sort SmallCap stocks (click link to choose) by Daily, Weekly and by Year-to-Date performances. Also, one can sort by size of the company or by market capitalization. |
| Select Your Default Chart Type: | |||||
| |||||
| Click on stock symbol or name for detailed view. Click on to add stock symbol to your watchlist and to view watchlist. Quick View: Move mouse or cursor over "Daily" to quickly view daily technical stock chart and over "Weekly" to view weekly technical stock chart. | |||||

 | RM Regional Management Corp. |
| Sector: Financials | |
| SubSector: Credit Services | |
| MarketCap: 148.008 Millions | |
| Recent Price: 28.34 Smart Investing & Trading Score: 100 | |
| Day Percent Change: 3.73% Day Change: 1.02 | |
| Week Change: 7.27% Year-to-date Change: 13.0% | |
| RM Links: Profile News Message Board | |
| Charts:- Daily , Weekly | |
| Add RM to Watchlist: View: Get Complete RM Trend Analysis ➞ | |
 | PAYS PaySign, Inc. |
| Sector: Services & Goods | |
| SubSector: Business Services | |
| MarketCap: 213.882 Millions | |
| Recent Price: 4.73 Smart Investing & Trading Score: 100 | |
| Day Percent Change: 2.60% Day Change: 0.12 | |
| Week Change: 7.26% Year-to-date Change: 68.9% | |
| PAYS Links: Profile News Message Board | |
| Charts:- Daily , Weekly | |
| Add PAYS to Watchlist: View: Get Complete PAYS Trend Analysis ➞ | |
 | PCT PureCycle Technologies, Inc. |
| Sector: Industrials | |
| SubSector: Pollution & Treatment Controls | |
| MarketCap: 1610 Millions | |
| Recent Price: 5.34 Smart Investing & Trading Score: 49 | |
| Day Percent Change: 9.31% Day Change: 0.46 | |
| Week Change: 7.23% Year-to-date Change: 31.7% | |
| PCT Links: Profile News Message Board | |
| Charts:- Daily , Weekly | |
| Add PCT to Watchlist: View: Get Complete PCT Trend Analysis ➞ | |
 | FOR Forestar Group Inc. |
| Sector: Financials | |
| SubSector: Real Estate Development | |
| MarketCap: 661.019 Millions | |
| Recent Price: 33.57 Smart Investing & Trading Score: 52 | |
| Day Percent Change: 3.84% Day Change: 1.24 | |
| Week Change: 7.15% Year-to-date Change: 1.5% | |
| FOR Links: Profile News Message Board | |
| Charts:- Daily , Weekly | |
| Add FOR to Watchlist: View: Get Complete FOR Trend Analysis ➞ | |
 | OLMA Olema Pharmaceuticals, Inc. |
| Sector: Health Care | |
| SubSector: Biotechnology | |
| MarketCap: 17687 Millions | |
| Recent Price: 10.66 Smart Investing & Trading Score: 49 | |
| Day Percent Change: 5.86% Day Change: 0.59 | |
| Week Change: 7.14% Year-to-date Change: -24.2% | |
| OLMA Links: Profile News Message Board | |
| Charts:- Daily , Weekly | |
| Add OLMA to Watchlist: View: Get Complete OLMA Trend Analysis ➞ | |
 | IGMS IGM Biosciences, Inc. |
| Sector: Health Care | |
| SubSector: Biotechnology | |
| MarketCap: 2000.05 Millions | |
| Recent Price: 10.07 Smart Investing & Trading Score: 74 | |
| Day Percent Change: 6.79% Day Change: 0.64 | |
| Week Change: 7.13% Year-to-date Change: 21.2% | |
| IGMS Links: Profile News Message Board | |
| Charts:- Daily , Weekly | |
| Add IGMS to Watchlist: View: Get Complete IGMS Trend Analysis ➞ | |
 | SMBK SmartFinancial, Inc. |
| Sector: Financials | |
| SubSector: Regional - Southeast Banks | |
| MarketCap: 174.035 Millions | |
| Recent Price: 22.13 Smart Investing & Trading Score: 100 | |
| Day Percent Change: 2.69% Day Change: 0.58 | |
| Week Change: 7.12% Year-to-date Change: -9.6% | |
| SMBK Links: Profile News Message Board | |
| Charts:- Daily , Weekly | |
| Add SMBK to Watchlist: View: Get Complete SMBK Trend Analysis ➞ | |
 | MYGN Myriad Genetics, Inc. |
| Sector: Services & Goods | |
| SubSector: Research Services | |
| MarketCap: 1051.94 Millions | |
| Recent Price: 19.47 Smart Investing & Trading Score: 49 | |
| Day Percent Change: 1.30% Day Change: 0.25 | |
| Week Change: 7.1% Year-to-date Change: 1.7% | |
| MYGN Links: Profile News Message Board | |
| Charts:- Daily , Weekly | |
| Add MYGN to Watchlist: View: Get Complete MYGN Trend Analysis ➞ | |
 | GKOS Glaukos Corporation |
| Sector: Health Care | |
| SubSector: Medical Instruments & Supplies | |
| MarketCap: 1103.6 Millions | |
| Recent Price: 106.51 Smart Investing & Trading Score: 100 | |
| Day Percent Change: 1.41% Day Change: 1.48 | |
| Week Change: 7.07% Year-to-date Change: 34.0% | |
| GKOS Links: Profile News Message Board | |
| Charts:- Daily , Weekly | |
| Add GKOS to Watchlist: View: Get Complete GKOS Trend Analysis ➞ | |
 | LOVE The Lovesac Company |
| Sector: Consumer Staples | |
| SubSector: Home Furnishings & Fixtures | |
| MarketCap: 112.835 Millions | |
| Recent Price: 23.38 Smart Investing & Trading Score: 100 | |
| Day Percent Change: 4.89% Day Change: 1.09 | |
| Week Change: 7.05% Year-to-date Change: -8.5% | |
| LOVE Links: Profile News Message Board | |
| Charts:- Daily , Weekly | |
| Add LOVE to Watchlist: View: Get Complete LOVE Trend Analysis ➞ | |
 | MMSI Merit Medical Systems, Inc. |
| Sector: Health Care | |
| SubSector: Medical Instruments & Supplies | |
| MarketCap: 1719.2 Millions | |
| Recent Price: 78.97 Smart Investing & Trading Score: 100 | |
| Day Percent Change: 2.53% Day Change: 1.95 | |
| Week Change: 7.03% Year-to-date Change: 4.0% | |
| MMSI Links: Profile News Message Board | |
| Charts:- Daily , Weekly | |
| Add MMSI to Watchlist: View: Get Complete MMSI Trend Analysis ➞ | |
 | VRRM Verra Mobility Corporation |
| Sector: Services & Goods | |
| SubSector: Security & Protection Services | |
| MarketCap: 1265.03 Millions | |
| Recent Price: 25.93 Smart Investing & Trading Score: 100 | |
| Day Percent Change: 7.64% Day Change: 1.84 | |
| Week Change: 7.02% Year-to-date Change: 12.6% | |
| VRRM Links: Profile News Message Board | |
| Charts:- Daily , Weekly | |
| Add VRRM to Watchlist: View: Get Complete VRRM Trend Analysis ➞ | |
 | COCO The Vita Coco Company, Inc. |
| Sector: Consumer Staples | |
| SubSector: Beverages - Non-Alcoholic | |
| MarketCap: 1510 Millions | |
| Recent Price: 26.46 Smart Investing & Trading Score: 93 | |
| Day Percent Change: -1.75% Day Change: -0.47 | |
| Week Change: 7% Year-to-date Change: 2.8% | |
| COCO Links: Profile News Message Board | |
| Charts:- Daily , Weekly | |
| Add COCO to Watchlist: View: Get Complete COCO Trend Analysis ➞ | |
 | ADTN ADTRAN, Inc. |
| Sector: Technology | |
| SubSector: Communication Equipment | |
| MarketCap: 303.539 Millions | |
| Recent Price: 4.74 Smart Investing & Trading Score: 60 | |
| Day Percent Change: 2.60% Day Change: 0.12 | |
| Week Change: 7% Year-to-date Change: -35.4% | |
| ADTN Links: Profile News Message Board | |
| Charts:- Daily , Weekly | |
| Add ADTN to Watchlist: View: Get Complete ADTN Trend Analysis ➞ | |
 | INZY Inozyme Pharma, Inc. |
| Sector: Health Care | |
| SubSector: Biotechnology | |
| MarketCap: 53487 Millions | |
| Recent Price: 4.75 Smart Investing & Trading Score: 39 | |
| Day Percent Change: 2.15% Day Change: 0.10 | |
| Week Change: 6.98% Year-to-date Change: 11.6% | |
| INZY Links: Profile News Message Board | |
| Charts:- Daily , Weekly | |
| Add INZY to Watchlist: View: Get Complete INZY Trend Analysis ➞ | |
 | BCRX BioCryst Pharmaceuticals, Inc. |
| Sector: Health Care | |
| SubSector: Biotechnology | |
| MarketCap: 369.385 Millions | |
| Recent Price: 4.45 Smart Investing & Trading Score: 59 | |
| Day Percent Change: -0.67% Day Change: -0.03 | |
| Week Change: 6.97% Year-to-date Change: -25.7% | |
| BCRX Links: Profile News Message Board | |
| Charts:- Daily , Weekly | |
| Add BCRX to Watchlist: View: Get Complete BCRX Trend Analysis ➞ | |
 | FLGT Fulgent Genetics, Inc. |
| Sector: Health Care | |
| SubSector: Medical Laboratories & Research | |
| MarketCap: 222.2 Millions | |
| Recent Price: 21.50 Smart Investing & Trading Score: 74 | |
| Day Percent Change: 1.22% Day Change: 0.26 | |
| Week Change: 6.97% Year-to-date Change: -25.6% | |
| FLGT Links: Profile News Message Board | |
| Charts:- Daily , Weekly | |
| Add FLGT to Watchlist: View: Get Complete FLGT Trend Analysis ➞ | |
 | ORA Ormat Technologies, Inc. |
| Sector: Utilities | |
| SubSector: Electric Utilities | |
| MarketCap: 3610.74 Millions | |
| Recent Price: 67.50 Smart Investing & Trading Score: 100 | |
| Day Percent Change: 1.18% Day Change: 0.79 | |
| Week Change: 6.96% Year-to-date Change: -10.9% | |
| ORA Links: Profile News Message Board | |
| Charts:- Daily , Weekly | |
| Add ORA to Watchlist: View: Get Complete ORA Trend Analysis ➞ | |
 | GVA Granite Construction Incorporated |
| Sector: Industrials | |
| SubSector: Heavy Construction | |
| MarketCap: 725.895 Millions | |
| Recent Price: 59.39 Smart Investing & Trading Score: 100 | |
| Day Percent Change: 3.72% Day Change: 2.13 | |
| Week Change: 6.95% Year-to-date Change: 16.8% | |
| GVA Links: Profile News Message Board | |
| Charts:- Daily , Weekly | |
| Add GVA to Watchlist: View: Get Complete GVA Trend Analysis ➞ | |
 | HBNC Horizon Bancorp, Inc. |
| Sector: Financials | |
| SubSector: Regional - Northeast Banks | |
| MarketCap: 405.999 Millions | |
| Recent Price: 12.47 Smart Investing & Trading Score: 100 | |
| Day Percent Change: 0.48% Day Change: 0.06 | |
| Week Change: 6.95% Year-to-date Change: -12.9% | |
| HBNC Links: Profile News Message Board | |
| Charts:- Daily , Weekly | |
| Add HBNC to Watchlist: View: Get Complete HBNC Trend Analysis ➞ | |
 | BY Byline Bancorp, Inc. |
| Sector: Financials | |
| SubSector: Regional - Midwest Banks | |
| MarketCap: 381.87 Millions | |
| Recent Price: 23.28 Smart Investing & Trading Score: 100 | |
| Day Percent Change: 2.11% Day Change: 0.48 | |
| Week Change: 6.89% Year-to-date Change: -1.2% | |
| BY Links: Profile News Message Board | |
| Charts:- Daily , Weekly | |
| Add BY to Watchlist: View: Get Complete BY Trend Analysis ➞ | |
 | FFIC Flushing Financial Corporation |
| Sector: Financials | |
| SubSector: Savings & Loans | |
| MarketCap: 336.43 Millions | |
| Recent Price: 12.15 Smart Investing & Trading Score: 67 | |
| Day Percent Change: 2.97% Day Change: 0.35 | |
| Week Change: 6.86% Year-to-date Change: -26.3% | |
| FFIC Links: Profile News Message Board | |
| Charts:- Daily , Weekly | |
| Add FFIC to Watchlist: View: Get Complete FFIC Trend Analysis ➞ | |
 | FATE Fate Therapeutics, Inc. |
| Sector: Health Care | |
| SubSector: Biotechnology | |
| MarketCap: 2022.45 Millions | |
| Recent Price: 4.06 Smart Investing & Trading Score: 37 | |
| Day Percent Change: -0.98% Day Change: -0.04 | |
| Week Change: 6.84% Year-to-date Change: 8.6% | |
| FATE Links: Profile News Message Board | |
| Charts:- Daily , Weekly | |
| Add FATE to Watchlist: View: Get Complete FATE Trend Analysis ➞ | |
 | PI Impinj, Inc. |
| Sector: Technology | |
| SubSector: Communication Equipment | |
| MarketCap: 364.739 Millions | |
| Recent Price: 161.23 Smart Investing & Trading Score: 90 | |
| Day Percent Change: 0.94% Day Change: 1.50 | |
| Week Change: 6.84% Year-to-date Change: 79.1% | |
| PI Links: Profile News Message Board | |
| Charts:- Daily , Weekly | |
| Add PI to Watchlist: View: Get Complete PI Trend Analysis ➞ | |
 | SPCE Virgin Galactic Holdings, Inc. |
| Sector: Industrials | |
| SubSector: Conglomerates | |
| MarketCap: 2612.48 Millions | |
| Recent Price: 0.95 Smart Investing & Trading Score: 54 | |
| Day Percent Change: 7.50% Day Change: 0.07 | |
| Week Change: 6.82% Year-to-date Change: -61.3% | |
| SPCE Links: Profile News Message Board | |
| Charts:- Daily , Weekly | |
| Add SPCE to Watchlist: View: Get Complete SPCE Trend Analysis ➞ | |
| Too many stocks? View smallcap stocks filtered by marketcap & sector |
| Marketcap: All SmallCap Stocks (default-no microcap), Large, Mid-Range, Small & MicroCap |
| Sector: Tech, Finance, Energy, Staples, Retail, Industrial, Materials, Utilities & Medical |
|
Best Stocks Today 12Stocks.com |
© 2024 12Stocks.com Terms & Conditions Privacy Contact Us
All Information Provided Only For Education And Not To Be Used For Investing or Trading. See Terms & Conditions


One More Thing ... Get Best Stocks Delivered Daily!
Never Ever Miss A Move With Our Top Ten Stocks Lists
Find Best Stocks In Any Market - Bull or Bear Market
Take A Peek At Our Top Ten Stocks Lists: Daily, Weekly, Year-to-Date & Top Trends
Find Best Stocks In Any Market - Bull or Bear Market
Take A Peek At Our Top Ten Stocks Lists: Daily, Weekly, Year-to-Date & Top Trends
Smallcap Stocks With Best Up Trends [0-bearish to 100-bullish]: Twist Bioscience[100], WideOpenWest [100], Joint [100], FTC Solar[100], Origin Materials[100], Alignment Healthcare[100], Clarus [100], IES [100], Emergent BioSolutions[100], Enovix [100], El Pollo[100]
Best Smallcap Stocks Year-to-Date:
Janux [482.74%], Viking [313.59%], Longboard [272.5%], Alpine Immune[239.29%], Bakkt [199.55%], Avidity Biosciences[192.48%], Vera [189.47%], Cullinan Oncology[176.9%], Super Micro[175.35%], Y-mAbs [151.47%], Sana [149.33%] Best Smallcap Stocks This Week:
Emergent BioSolutions[102.6%], Deciphera [73.24%], Origin Materials[66.52%], Eyenovia [60.78%], Cue Biopharma[56.04%], Aspen Aerogels[55.96%], Enovix [54.02%], Luna Innovations[53.77%], Codexis [47.37%], Carvana Co[44.31%], Office Properties[42.79%] Best Smallcap Stocks Daily:
Luna Innovations[36.00%], Twist Bioscience[28.74%], Ardelyx [28.42%], WideOpenWest [28.23%], 2U [26.63%], Joint [25.35%], FTC Solar[25.09%], Origin Materials[22.23%], Alignment Healthcare[21.97%], Clarus [18.67%], Aurora Innovation[18.09%]