
 Login Sign Up


| |||||
 |  | ||||

| 12Stocks.com Market Intelligence |
Best SmallCap Stocks
|
| In a hurry? Small Cap Stock Lists: Performance Trends Table, Stock Charts
Sort Small Cap stocks: Daily, Weekly, Year-to-Date, Market Cap & Trends. Filter Small Cap stocks list by sector: Show all, Tech, Finance, Energy, Staples, Retail, Industrial, Materials, Utilities and HealthCare Filter Small Cap stocks list by size: All Large Medium Small and MicroCap |
| 12Stocks.com Small Cap Stocks Performances & Trends Daily | |||||||||
|
|  The overall Smart Investing & Trading Score is 24 (0-bearish to 100-bullish) which puts Small Cap index in short term bearish to neutral trend. The Smart Investing & Trading Score from previous trading session is 14 and hence an improvement of trend.
| ||||||||
Here are the Smart Investing & Trading Scores of the most requested small cap stocks at 12Stocks.com (click stock name for detailed review):
|


| 12Stocks.com: Investing in Smallcap Index with Stocks | |
|
The following table helps investors and traders sort through current performance and trends (as measured by Smart Investing & Trading Score) of various
stocks in the Smallcap Index. Quick View: Move mouse or cursor over stock symbol (ticker) to view short-term technical chart and over stock name to view long term chart. Click on  to add stock symbol to your watchlist and to add stock symbol to your watchlist and  to view watchlist. Click on any ticker or stock name for detailed market intelligence report for that stock. to view watchlist. Click on any ticker or stock name for detailed market intelligence report for that stock. |
12Stocks.com Performance of Stocks in Smallcap Index
| Ticker | Stock Name | Watchlist | Category | Recent Price | Smart Investing & Trading Score | Change % | Weekly Change% |
| AXL | American Axle |   | Consumer Staples | 7.46 | 75 | 0.95% | -0.80% |
| GPMT | Granite Point | | Financials | 4.36 | 10 | 0.81% | -0.80% |
| NUS | Nu Skin | | Consumer Staples | 12.21 | 45 | 3.21% | -0.81% |
| MOV | Movado Group | | Consumer Staples | 25.78 | 32 | 0.70% | -0.81% |
| CRAI | CRA | | Services & Goods | 148.50 | 76 | -0.69% | -0.81% |
| YEXT | Yext | | Technology | 5.50 | 18 | -0.27% | -0.81% |
| upst | Upstart | | Financials | 23.26 | 42 | 1.75% | -0.81% |
| STEM | Stem | | Technology | 1.81 | 47 | -1.89% | -0.82% |
| NEWT | Newtek Business | | Services & Goods | 10.91 | 15 | 1.49% | -0.82% |
| ZIP | ZipRecruiter | | Industrials | 10.28 | 52 | -2.05% | -0.82% |
| TPH | TRI Pointe | | Industrials | 37.56 | 75 | 0.29% | -0.84% |
| SITM | SiTime | | Technology | 88.03 | 47 | 0.87% | -0.85% |
| SHOO | Steven Madden | | Consumer Staples | 40.13 | 25 | 1.80% | -0.86% |
| NXT | Nextracker | | Technology | 43.41 | 24 | 1.12% | -0.86% |
| JBLU | JetBlue Airways | | Transports | 5.73 | 15 | 2.60% | -0.87% |
| PX | P10 | | Financials | 7.39 | 46 | 0.61% | -0.87% |
| KROS | Keros | | Health Care | 57.35 | 25 | -0.63% | -0.87% |
| LZB | La-Z-Boy | | Consumer Staples | 32.82 | 0 | 0.34% | -0.88% |
| SSTI | ShotSpotter | | Technology | 13.55 | 37 | 0.07% | -0.88% |
| EHTH | eHealth | | Financials | 4.49 | 27 | 0.79% | -0.88% |
| EVH | Evolent Health | | Technology | 27.40 | 0 | 0.48% | -0.90% |
| PSFE | Paysafe | | Technology | 14.33 | 15 | 1.13% | -0.90% |
| WIRE | Encore Wire | | Technology | 282.30 | 51 | 0.46% | -0.91% |
| VECO | Veeco Instruments | | Technology | 34.84 | 7 | 0.71% | -0.92% |
| EB | Eventbrite | | Technology | 5.33 | 37 | -0.74% | -0.93% |


| Too many stocks? View smallcap stocks filtered by marketcap & sector |
| Marketcap: All SmallCap Stocks (default-no microcap), Large, Mid-Range, Small |
| Smallcap Sector: Tech, Finance, Energy, Staples, Retail, Industrial, Materials, & Medical |
|
Get the most comprehensive stock market coverage daily at 12Stocks.com ➞ Best Stocks Today ➞ Best Stocks Weekly ➞ Best Stocks Year-to-Date ➞ Best Stocks Trends ➞  Best Stocks Today 12Stocks.com Best Nasdaq Stocks ➞ Best S&P 500 Stocks ➞ Best Tech Stocks ➞ Best Biotech Stocks ➞ |
| Detailed Overview of SmallCap Stocks |
| SmallCap Technical Overview, Leaders & Laggards, Top SmallCap ETF Funds & Detailed SmallCap Stocks List, Charts, Trends & More |
| Smallcap: Technical Analysis, Trends & YTD Performance | |
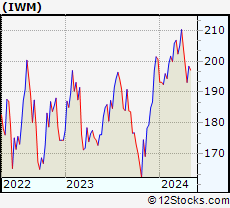
| SmallCap segment as represented by
IWM, an exchange-traded fund [ETF], holds basket of thousands of smallcap stocks from across all major sectors of the US stock market. The smallcap index (contains stocks like Riverbed & Sotheby's) is down by -1.02% and is currently underperforming the overall market by -6.17% year-to-date. Below is a quick view of technical charts and trends: | |
 IWM Weekly Chart |
|
| Long Term Trend: Not Good | |
| Medium Term Trend: Not Good | |
 IWM Daily Chart |
|
| Short Term Trend: Deteriorating | |
| Overall Trend Score: 24 | |
| YTD Performance: -1.02% | |
| **Trend Scores & Views Are Only For Educational Purposes And Not For Investing | |
| 12Stocks.com: Top Performing Small Cap Index Stocks | ||||||||||||||||||||||||||||||||||||||||||||||||
 The top performing Small Cap Index stocks year to date are
Now, more recently, over last week, the top performing Small Cap Index stocks on the move are


|
||||||||||||||||||||||||||||||||||||||||||||||||
| 12Stocks.com: Investing in Smallcap Index using Exchange Traded Funds | |
|
The following table shows list of key exchange traded funds (ETF) that
help investors track Smallcap index. The following list also includes leveraged ETF funds that track twice or thrice the daily returns of Smallcap indices. Short or inverse ETF funds move in the opposite direction to the index they track and are useful during market pullbacks or during bear markets. Quick View: Move mouse or cursor over ETF symbol (ticker) to view short-term technical chart and over ETF name to view long term chart. Click on ticker or stock name for detailed view. Click on to add stock symbol to your watchlist and to view watchlist. |
12Stocks.com List of ETFs that track Smallcap Index
| Ticker | ETF Name | Watchlist | Recent Price | Smart Investing & Trading Score | Change % | Week % | Year-to-date % |
| IWM | iShares Russell 2000 | | 198.66 | 24 | 1.20 | 0.14 | -1.02% |
| IJR | iShares Core S&P Small-Cap | | 105.66 | 15 | 0.88 | 0.01 | -2.39% |
| IWN | iShares Russell 2000 Value | | 151.74 | 15 | 1.28 | 0.39 | -2.31% |
| IWO | iShares Russell 2000 Growth | | 252.43 | 7 | 1.14 | -0.26 | 0.08% |
| 12Stocks.com: Charts, Trends, Fundamental Data and Performances of SmallCap Stocks | |
|
We now take in-depth look at all SmallCap stocks including charts, multi-period performances and overall trends (as measured by Smart Investing & Trading Score). One can sort SmallCap stocks (click link to choose) by Daily, Weekly and by Year-to-Date performances. Also, one can sort by size of the company or by market capitalization. |
| Select Your Default Chart Type: | |||||
| |||||
| Click on stock symbol or name for detailed view. Click on to add stock symbol to your watchlist and to view watchlist. Quick View: Move mouse or cursor over "Daily" to quickly view daily technical stock chart and over "Weekly" to view weekly technical stock chart. | |||||

 | AXL American Axle & Manufacturing Holdings, Inc. |
| Sector: Consumer Staples | |
| SubSector: Auto Parts | |
| MarketCap: 407.139 Millions | |
| Recent Price: 7.46 Smart Investing & Trading Score: 75 | |
| Day Percent Change: 0.95% Day Change: 0.07 | |
| Week Change: -0.8% Year-to-date Change: -15.3% | |
| AXL Links: Profile News Message Board | |
| Charts:- Daily , Weekly | |
| Add AXL to Watchlist: View: Get Complete AXL Trend Analysis ➞ | |
 | GPMT Granite Point Mortgage Trust Inc. |
| Sector: Financials | |
| SubSector: Mortgage Investment | |
| MarketCap: 289.739 Millions | |
| Recent Price: 4.36 Smart Investing & Trading Score: 10 | |
| Day Percent Change: 0.81% Day Change: 0.04 | |
| Week Change: -0.8% Year-to-date Change: -26.7% | |
| GPMT Links: Profile News Message Board | |
| Charts:- Daily , Weekly | |
| Add GPMT to Watchlist: View: Get Complete GPMT Trend Analysis ➞ | |
 | NUS Nu Skin Enterprises, Inc. |
| Sector: Consumer Staples | |
| SubSector: Personal Products | |
| MarketCap: 1230.85 Millions | |
| Recent Price: 12.21 Smart Investing & Trading Score: 45 | |
| Day Percent Change: 3.21% Day Change: 0.38 | |
| Week Change: -0.81% Year-to-date Change: -37.1% | |
| NUS Links: Profile News Message Board | |
| Charts:- Daily , Weekly | |
| Add NUS to Watchlist: View: Get Complete NUS Trend Analysis ➞ | |
 | MOV Movado Group, Inc. |
| Sector: Consumer Staples | |
| SubSector: Recreational Goods, Other | |
| MarketCap: 161.659 Millions | |
| Recent Price: 25.78 Smart Investing & Trading Score: 32 | |
| Day Percent Change: 0.70% Day Change: 0.18 | |
| Week Change: -0.81% Year-to-date Change: -14.5% | |
| MOV Links: Profile News Message Board | |
| Charts:- Daily , Weekly | |
| Add MOV to Watchlist: View: Get Complete MOV Trend Analysis ➞ | |
 | CRAI CRA International, Inc. |
| Sector: Services & Goods | |
| SubSector: Management Services | |
| MarketCap: 209.645 Millions | |
| Recent Price: 148.50 Smart Investing & Trading Score: 76 | |
| Day Percent Change: -0.69% Day Change: -1.03 | |
| Week Change: -0.81% Year-to-date Change: 50.2% | |
| CRAI Links: Profile News Message Board | |
| Charts:- Daily , Weekly | |
| Add CRAI to Watchlist: View: Get Complete CRAI Trend Analysis ➞ | |
 | YEXT Yext, Inc. |
| Sector: Technology | |
| SubSector: Internet Software & Services | |
| MarketCap: 1414.91 Millions | |
| Recent Price: 5.50 Smart Investing & Trading Score: 18 | |
| Day Percent Change: -0.27% Day Change: -0.01 | |
| Week Change: -0.81% Year-to-date Change: -6.7% | |
| YEXT Links: Profile News Message Board | |
| Charts:- Daily , Weekly | |
| Add YEXT to Watchlist: View: Get Complete YEXT Trend Analysis ➞ | |
 | upst Upstart Holdings, Inc. |
| Sector: Financials | |
| SubSector: Credit Services | |
| MarketCap: 2900 Millions | |
| Recent Price: 23.26 Smart Investing & Trading Score: 42 | |
| Day Percent Change: 1.75% Day Change: 0.40 | |
| Week Change: -0.81% Year-to-date Change: -42.6% | |
| upst Links: Profile News Message Board | |
| Charts:- Daily , Weekly | |
| Add upst to Watchlist: View: Get Complete upst Trend Analysis ➞ | |
 | STEM Stem, Inc. |
| Sector: Technology | |
| SubSector: Software - Infrastructure | |
| MarketCap: 836 Millions | |
| Recent Price: 1.81 Smart Investing & Trading Score: 47 | |
| Day Percent Change: -1.89% Day Change: -0.04 | |
| Week Change: -0.82% Year-to-date Change: -52.7% | |
| STEM Links: Profile News Message Board | |
| Charts:- Daily , Weekly | |
| Add STEM to Watchlist: View: Get Complete STEM Trend Analysis ➞ | |
 | NEWT Newtek Business Services Corp. |
| Sector: Services & Goods | |
| SubSector: Business Services | |
| MarketCap: 243.982 Millions | |
| Recent Price: 10.91 Smart Investing & Trading Score: 15 | |
| Day Percent Change: 1.49% Day Change: 0.16 | |
| Week Change: -0.82% Year-to-date Change: -20.9% | |
| NEWT Links: Profile News Message Board | |
| Charts:- Daily , Weekly | |
| Add NEWT to Watchlist: View: Get Complete NEWT Trend Analysis ➞ | |
 | ZIP ZipRecruiter, Inc. |
| Sector: Industrials | |
| SubSector: Staffing & Employment Services | |
| MarketCap: 1730 Millions | |
| Recent Price: 10.28 Smart Investing & Trading Score: 52 | |
| Day Percent Change: -2.05% Day Change: -0.21 | |
| Week Change: -0.82% Year-to-date Change: -26.7% | |
| ZIP Links: Profile News Message Board | |
| Charts:- Daily , Weekly | |
| Add ZIP to Watchlist: View: Get Complete ZIP Trend Analysis ➞ | |
 | TPH TRI Pointe Group, Inc. |
| Sector: Industrials | |
| SubSector: Residential Construction | |
| MarketCap: 1140.06 Millions | |
| Recent Price: 37.56 Smart Investing & Trading Score: 75 | |
| Day Percent Change: 0.29% Day Change: 0.11 | |
| Week Change: -0.84% Year-to-date Change: 6.1% | |
| TPH Links: Profile News Message Board | |
| Charts:- Daily , Weekly | |
| Add TPH to Watchlist: View: Get Complete TPH Trend Analysis ➞ | |
 | SITM SiTime Corporation |
| Sector: Technology | |
| SubSector: Semiconductor - Specialized | |
| MarketCap: 403.76 Millions | |
| Recent Price: 88.03 Smart Investing & Trading Score: 47 | |
| Day Percent Change: 0.87% Day Change: 0.75 | |
| Week Change: -0.85% Year-to-date Change: -27.9% | |
| SITM Links: Profile News Message Board | |
| Charts:- Daily , Weekly | |
| Add SITM to Watchlist: View: Get Complete SITM Trend Analysis ➞ | |
 | SHOO Steven Madden, Ltd. |
| Sector: Consumer Staples | |
| SubSector: Textile - Apparel Footwear & Accessories | |
| MarketCap: 1756.3 Millions | |
| Recent Price: 40.13 Smart Investing & Trading Score: 25 | |
| Day Percent Change: 1.80% Day Change: 0.71 | |
| Week Change: -0.86% Year-to-date Change: -4.5% | |
| SHOO Links: Profile News Message Board | |
| Charts:- Daily , Weekly | |
| Add SHOO to Watchlist: View: Get Complete SHOO Trend Analysis ➞ | |
 | NXT Nextracker Inc. |
| Sector: Technology | |
| SubSector: Solar | |
| MarketCap: 5590 Millions | |
| Recent Price: 43.41 Smart Investing & Trading Score: 24 | |
| Day Percent Change: 1.12% Day Change: 0.48 | |
| Week Change: -0.86% Year-to-date Change: -7.1% | |
| NXT Links: Profile News Message Board | |
| Charts:- Daily , Weekly | |
| Add NXT to Watchlist: View: Get Complete NXT Trend Analysis ➞ | |
 | JBLU JetBlue Airways Corporation |
| Sector: Transports | |
| SubSector: Regional Airlines | |
| MarketCap: 2383.1 Millions | |
| Recent Price: 5.73 Smart Investing & Trading Score: 15 | |
| Day Percent Change: 2.60% Day Change: 0.15 | |
| Week Change: -0.87% Year-to-date Change: 3.2% | |
| JBLU Links: Profile News Message Board | |
| Charts:- Daily , Weekly | |
| Add JBLU to Watchlist: View: Get Complete JBLU Trend Analysis ➞ | |
 | PX P10, Inc. |
| Sector: Financials | |
| SubSector: Asset Management | |
| MarketCap: 1300 Millions | |
| Recent Price: 7.39 Smart Investing & Trading Score: 46 | |
| Day Percent Change: 0.61% Day Change: 0.04 | |
| Week Change: -0.87% Year-to-date Change: -27.6% | |
| PX Links: Profile News Message Board | |
| Charts:- Daily , Weekly | |
| Add PX to Watchlist: View: Get Complete PX Trend Analysis ➞ | |
 | KROS Keros Therapeutics, Inc. |
| Sector: Health Care | |
| SubSector: Biotechnology | |
| MarketCap: 17887 Millions | |
| Recent Price: 57.35 Smart Investing & Trading Score: 25 | |
| Day Percent Change: -0.63% Day Change: -0.37 | |
| Week Change: -0.87% Year-to-date Change: 44.0% | |
| KROS Links: Profile News Message Board | |
| Charts:- Daily , Weekly | |
| Add KROS to Watchlist: View: Get Complete KROS Trend Analysis ➞ | |
 | LZB La-Z-Boy Incorporated |
| Sector: Consumer Staples | |
| SubSector: Home Furnishings & Fixtures | |
| MarketCap: 951.635 Millions | |
| Recent Price: 32.82 Smart Investing & Trading Score: 0 | |
| Day Percent Change: 0.34% Day Change: 0.11 | |
| Week Change: -0.88% Year-to-date Change: -11.1% | |
| LZB Links: Profile News Message Board | |
| Charts:- Daily , Weekly | |
| Add LZB to Watchlist: View: Get Complete LZB Trend Analysis ➞ | |
 | SSTI ShotSpotter, Inc. |
| Sector: Technology | |
| SubSector: Application Software | |
| MarketCap: 353.062 Millions | |
| Recent Price: 13.55 Smart Investing & Trading Score: 37 | |
| Day Percent Change: 0.07% Day Change: 0.01 | |
| Week Change: -0.88% Year-to-date Change: -47.0% | |
| SSTI Links: Profile News Message Board | |
| Charts:- Daily , Weekly | |
| Add SSTI to Watchlist: View: Get Complete SSTI Trend Analysis ➞ | |
 | EHTH eHealth, Inc. |
| Sector: Financials | |
| SubSector: Insurance Brokers | |
| MarketCap: 2813.57 Millions | |
| Recent Price: 4.49 Smart Investing & Trading Score: 27 | |
| Day Percent Change: 0.79% Day Change: 0.04 | |
| Week Change: -0.88% Year-to-date Change: -48.5% | |
| EHTH Links: Profile News Message Board | |
| Charts:- Daily , Weekly | |
| Add EHTH to Watchlist: View: Get Complete EHTH Trend Analysis ➞ | |
 | EVH Evolent Health, Inc. |
| Sector: Technology | |
| SubSector: Healthcare Information Services | |
| MarketCap: 486.755 Millions | |
| Recent Price: 27.40 Smart Investing & Trading Score: 0 | |
| Day Percent Change: 0.48% Day Change: 0.13 | |
| Week Change: -0.9% Year-to-date Change: -17.1% | |
| EVH Links: Profile News Message Board | |
| Charts:- Daily , Weekly | |
| Add EVH to Watchlist: View: Get Complete EVH Trend Analysis ➞ | |
 | PSFE Paysafe Limited |
| Sector: Technology | |
| SubSector: Software - Infrastructure | |
| MarketCap: 605 Millions | |
| Recent Price: 14.33 Smart Investing & Trading Score: 15 | |
| Day Percent Change: 1.13% Day Change: 0.16 | |
| Week Change: -0.9% Year-to-date Change: 11.1% | |
| PSFE Links: Profile News Message Board | |
| Charts:- Daily , Weekly | |
| Add PSFE to Watchlist: View: Get Complete PSFE Trend Analysis ➞ | |
 | WIRE Encore Wire Corporation |
| Sector: Technology | |
| SubSector: Diversified Electronics | |
| MarketCap: 898.896 Millions | |
| Recent Price: 282.30 Smart Investing & Trading Score: 51 | |
| Day Percent Change: 0.46% Day Change: 1.30 | |
| Week Change: -0.91% Year-to-date Change: 32.2% | |
| WIRE Links: Profile News Message Board | |
| Charts:- Daily , Weekly | |
| Add WIRE to Watchlist: View: Get Complete WIRE Trend Analysis ➞ | |
 | VECO Veeco Instruments Inc. |
| Sector: Technology | |
| SubSector: Semiconductor Equipment & Materials | |
| MarketCap: 450.718 Millions | |
| Recent Price: 34.84 Smart Investing & Trading Score: 7 | |
| Day Percent Change: 0.71% Day Change: 0.24 | |
| Week Change: -0.92% Year-to-date Change: 12.3% | |
| VECO Links: Profile News Message Board | |
| Charts:- Daily , Weekly | |
| Add VECO to Watchlist: View: Get Complete VECO Trend Analysis ➞ | |
 | EB Eventbrite, Inc. |
| Sector: Technology | |
| SubSector: Application Software | |
| MarketCap: 805.262 Millions | |
| Recent Price: 5.33 Smart Investing & Trading Score: 37 | |
| Day Percent Change: -0.74% Day Change: -0.04 | |
| Week Change: -0.93% Year-to-date Change: -36.2% | |
| EB Links: Profile News Message Board | |
| Charts:- Daily , Weekly | |
| Add EB to Watchlist: View: Get Complete EB Trend Analysis ➞ | |
| Too many stocks? View smallcap stocks filtered by marketcap & sector |
| Marketcap: All SmallCap Stocks (default-no microcap), Large, Mid-Range, Small & MicroCap |
| Sector: Tech, Finance, Energy, Staples, Retail, Industrial, Materials, Utilities & Medical |
|
Best Stocks Today 12Stocks.com |
© 2024 12Stocks.com Terms & Conditions Privacy Contact Us
All Information Provided Only For Education And Not To Be Used For Investing or Trading. See Terms & Conditions


One More Thing ... Get Best Stocks Delivered Daily!
Never Ever Miss A Move With Our Top Ten Stocks Lists
Find Best Stocks In Any Market - Bull or Bear Market
Take A Peek At Our Top Ten Stocks Lists: Daily, Weekly, Year-to-Date & Top Trends
Find Best Stocks In Any Market - Bull or Bear Market
Take A Peek At Our Top Ten Stocks Lists: Daily, Weekly, Year-to-Date & Top Trends
Smallcap Stocks With Best Up Trends [0-bearish to 100-bullish]: Gannett Co[100], Pitney Bowes[100], Sprouts Farmers[100], Herbalife Nutrition[100], Gray Television[100], Surmodics [100], TPI Composites[100], Outbrain [100], Fluence Energy[100], Heartland Financial[100], Mercury General[100]
Best Smallcap Stocks Year-to-Date:
Janux [440.16%], Viking [306.02%], Longboard [258.92%], Alpine Immune[239.44%], Bakkt [187.89%], Avidity Biosciences[184.07%], Vera [170.74%], Cullinan Oncology[169.74%], Arcutis Bio[163.93%], Super Micro[161.15%], Y-mAbs [145.23%] Best Smallcap Stocks This Week:
Emergent BioSolutions[110.94%], Eyenovia [45.27%], P3 Health[38.51%], Aspen Aerogels[37.17%], Origin Materials[36.24%], Cue Biopharma[35.9%], Poseida [34.98%], Enovix [32.07%], Surmodics [31.94%], Phibro Animal[28.44%], TransMedics Group[28.2%] Best Smallcap Stocks Daily:
Emergent BioSolutions[109.84%], Aspen Aerogels[45.11%], Gannett Co[31.12%], Enovix [31.06%], Pitney Bowes[23.87%], Office Properties[22.00%], Pulmonx [20.21%], Perdoceo Education[19.25%], Origin Materials[17.75%], Benchmark Electronics[17.40%], Children s[14.21%]