
 Login Sign Up


| |||||
 |  | ||||

| 12Stocks.com Market Intelligence |
Best SmallCap Stocks
|
| In a hurry? Small Cap Stock Lists: Performance Trends Table, Stock Charts
Sort Small Cap stocks: Daily, Weekly, Year-to-Date, Market Cap & Trends. Filter Small Cap stocks list by sector: Show all, Tech, Finance, Energy, Staples, Retail, Industrial, Materials, Utilities and HealthCare Filter Small Cap stocks list by size: All Large Medium Small and MicroCap |
| 12Stocks.com Small Cap Stocks Performances & Trends Daily | |||||||||
|
|  The overall Smart Investing & Trading Score is 88 (0-bearish to 100-bullish) which puts Small Cap index in short term bullish trend. The Smart Investing & Trading Score from previous trading session is 56 and hence an improvement of trend.
| ||||||||
Here are the Smart Investing & Trading Scores of the most requested small cap stocks at 12Stocks.com (click stock name for detailed review):
|


| 12Stocks.com: Investing in Smallcap Index with Stocks | |
|
The following table helps investors and traders sort through current performance and trends (as measured by Smart Investing & Trading Score) of various
stocks in the Smallcap Index. Quick View: Move mouse or cursor over stock symbol (ticker) to view short-term technical chart and over stock name to view long term chart. Click on  to add stock symbol to your watchlist and to add stock symbol to your watchlist and  to view watchlist. Click on any ticker or stock name for detailed market intelligence report for that stock. to view watchlist. Click on any ticker or stock name for detailed market intelligence report for that stock. |
12Stocks.com Performance of Stocks in Smallcap Index
| Ticker | Stock Name | Watchlist | Category | Recent Price | Smart Investing & Trading Score | Change % | Weekly Change% |
| HEAR | Turtle Beach |   | Technology | 14.20 | 49 | 0.42% | 0.42% |
| LXP | Lexington Realty | | Financials | 8.52 | 45 | 0.41% | 0.41% |
| FELE | Franklin Electric | | Industrials | 103.19 | 83 | 0.41% | 0.41% |
| CLNE | Clean Energy | | Utilities | 2.44 | 60 | 0.41% | 0.41% |
| HCKT | Hackett Group | | Technology | 22.04 | 17 | 0.41% | 0.41% |
| MTDR | Matador Resources | | Energy | 65.88 | 61 | 0.41% | 0.41% |
| NJR | New Jersey | | Utilities | 43.52 | 83 | 0.40% | 0.40% |
| NTGR | NETGEAR | | Technology | 14.91 | 95 | 0.40% | 0.40% |
| PSMT | PriceSmart | | Services & Goods | 81.82 | 90 | 0.40% | 0.40% |
| MDXG | MiMedx Group | | Health Care | 6.29 | 29 | 0.40% | 0.40% |
| HMN | Horace Mann | | Financials | 36.88 | 62 | 0.39% | 0.39% |
| MUR | Murphy Oil | | Energy | 46.62 | 75 | 0.39% | 0.39% |
| APOG | Apogee Enterprises | | Industrials | 62.29 | 88 | 0.39% | 0.39% |
| RELY | Remitly Global | | Technology | 18.13 | 71 | 0.39% | 0.39% |
| HRI | Herc | | Transports | 152.87 | 51 | 0.39% | 0.39% |
| PLYM | Plymouth Industrial | | Financials | 20.84 | 35 | 0.39% | 0.39% |
| PUBM | PubMatic | | Technology | 23.30 | 69 | 0.39% | 0.39% |
| CRMT | America s | | Services & Goods | 58.09 | 57 | 0.38% | 0.38% |
| SM | SM Energy | | Energy | 51.03 | 83 | 0.37% | 0.37% |
| NBR | Nabors Industries | | Energy | 77.48 | 27 | 0.37% | 0.37% |
| ENS | EnerSys | | Industrials | 91.62 | 25 | 0.37% | 0.37% |
| CWT | California Water | | Utilities | 48.10 | 100 | 0.37% | 0.37% |
| ENSG | Ensign Group | | Health Care | 117.68 | 51 | 0.37% | 0.37% |
| ACT | Enact | | Financials | 30.05 | 73 | 0.37% | 0.37% |
| APLE | Apple Hospitality | | Financials | 15.06 | 10 | 0.37% | 0.37% |


| Too many stocks? View smallcap stocks filtered by marketcap & sector |
| Marketcap: All SmallCap Stocks (default-no microcap), Large, Mid-Range, Small |
| Smallcap Sector: Tech, Finance, Energy, Staples, Retail, Industrial, Materials, & Medical |
|
Get the most comprehensive stock market coverage daily at 12Stocks.com ➞ Best Stocks Today ➞ Best Stocks Weekly ➞ Best Stocks Year-to-Date ➞ Best Stocks Trends ➞  Best Stocks Today 12Stocks.com Best Nasdaq Stocks ➞ Best S&P 500 Stocks ➞ Best Tech Stocks ➞ Best Biotech Stocks ➞ |
| Detailed Overview of SmallCap Stocks |
| SmallCap Technical Overview, Leaders & Laggards, Top SmallCap ETF Funds & Detailed SmallCap Stocks List, Charts, Trends & More |
| Smallcap: Technical Analysis, Trends & YTD Performance | |
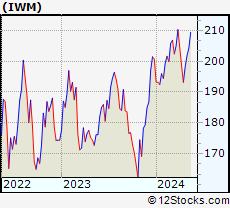
| SmallCap segment as represented by
IWM, an exchange-traded fund [ETF], holds basket of thousands of smallcap stocks from across all major sectors of the US stock market. The smallcap index (contains stocks like Riverbed & Sotheby's) is down by -0.36% and is currently underperforming the overall market by -6.65% year-to-date. Below is a quick view of technical charts and trends: | |
 IWM Weekly Chart |
|
| Long Term Trend: Very Good | |
| Medium Term Trend: Good | |
 IWM Daily Chart |
|
| Short Term Trend: Very Good | |
| Overall Trend Score: 88 | |
| YTD Performance: -0.36% | |
| **Trend Scores & Views Are Only For Educational Purposes And Not For Investing | |
| 12Stocks.com: Top Performing Small Cap Index Stocks | ||||||||||||||||||||||||||||||||||||||||||||||||
 The top performing Small Cap Index stocks year to date are
Now, more recently, over last week, the top performing Small Cap Index stocks on the move are


|
||||||||||||||||||||||||||||||||||||||||||||||||
| 12Stocks.com: Investing in Smallcap Index using Exchange Traded Funds | |
|
The following table shows list of key exchange traded funds (ETF) that
help investors track Smallcap index. The following list also includes leveraged ETF funds that track twice or thrice the daily returns of Smallcap indices. Short or inverse ETF funds move in the opposite direction to the index they track and are useful during market pullbacks or during bear markets. Quick View: Move mouse or cursor over ETF symbol (ticker) to view short-term technical chart and over ETF name to view long term chart. Click on ticker or stock name for detailed view. Click on to add stock symbol to your watchlist and to view watchlist. |
12Stocks.com List of ETFs that track Smallcap Index
| Ticker | ETF Name | Watchlist | Recent Price | Smart Investing & Trading Score | Change % | Week % | Year-to-date % |
| IWM | iShares Russell 2000 | | 199.98 | 88 | 0.80 | 0.8 | -0.36% |
| VTWO | Vanguard Russell 2000 ETF | | 80.77 | 88 | 0.69 | 0.69 | -0.41% |
| IWN | iShares Russell 2000 Value | | 152.09 | 93 | 0.63 | 0.63 | -2.09% |
| IJR | iShares Core S&P Small-Cap | | 106.37 | 93 | 0.68 | 0.68 | -1.74% |
| IWO | iShares Russell 2000 Growth | | 255.17 | 78 | 0.82 | 0.82 | 1.17% |
| IJS | iShares S&P Small-Cap 600 Value | | 97.96 | 70 | 0.79 | 0.79 | -4.96% |
| XSLV | PowerShares S&P SmallCap Low Volatil ETF | | 42.97 | 80 | 0.59 | 0.59 | -2.67% |
| IJT | iShares S&P Small-Cap 600 Growth | | 126.09 | 88 | 0.00 | 0 | 0.76% |
| SAA | ProShares Ultra SmallCap600 | | 23.27 | 88 | 1.00 | 1 | -6.73% |
| SBB | ProShares Short SmallCap600 | | 16.28 | 8 | -0.64 | -0.64 | 2.2% |
| SMLV | SPDR SSGA US Small Cap Low Volatil ETF | | 107.62 | 75 | 0.10 | 0.1 | -4.35% |
| SDD | ProShares UltraShort SmallCap600 | | 19.09 | 15 | -1.34 | -1.34 | 3.6% |
| 12Stocks.com: Charts, Trends, Fundamental Data and Performances of SmallCap Stocks | |
|
We now take in-depth look at all SmallCap stocks including charts, multi-period performances and overall trends (as measured by Smart Investing & Trading Score). One can sort SmallCap stocks (click link to choose) by Daily, Weekly and by Year-to-Date performances. Also, one can sort by size of the company or by market capitalization. |
| Select Your Default Chart Type: | |||||
| |||||
| Click on stock symbol or name for detailed view. Click on to add stock symbol to your watchlist and to view watchlist. Quick View: Move mouse or cursor over "Daily" to quickly view daily technical stock chart and over "Weekly" to view weekly technical stock chart. | |||||

 | HEAR Turtle Beach Corporation |
| Sector: Technology | |
| SubSector: Communication Equipment | |
| MarketCap: 73.0539 Millions | |
| Recent Price: 14.20 Smart Investing & Trading Score: 49 | |
| Day Percent Change: 0.42% Day Change: 0.06 | |
| Week Change: 0.42% Year-to-date Change: 29.7% | |
| HEAR Links: Profile News Message Board | |
| Charts:- Daily , Weekly | |
| Add HEAR to Watchlist: View: Get Complete HEAR Trend Analysis ➞ | |
 | LXP Lexington Realty Trust |
| Sector: Financials | |
| SubSector: REIT - Diversified | |
| MarketCap: 2483.43 Millions | |
| Recent Price: 8.52 Smart Investing & Trading Score: 45 | |
| Day Percent Change: 0.41% Day Change: 0.04 | |
| Week Change: 0.41% Year-to-date Change: -14.2% | |
| LXP Links: Profile News Message Board | |
| Charts:- Daily , Weekly | |
| Add LXP to Watchlist: View: Get Complete LXP Trend Analysis ➞ | |
 | FELE Franklin Electric Co., Inc. |
| Sector: Industrials | |
| SubSector: Industrial Electrical Equipment | |
| MarketCap: 2397.89 Millions | |
| Recent Price: 103.19 Smart Investing & Trading Score: 83 | |
| Day Percent Change: 0.41% Day Change: 0.42 | |
| Week Change: 0.41% Year-to-date Change: 6.8% | |
| FELE Links: Profile News Message Board | |
| Charts:- Daily , Weekly | |
| Add FELE to Watchlist: View: Get Complete FELE Trend Analysis ➞ | |
 | CLNE Clean Energy Fuels Corp. |
| Sector: Utilities | |
| SubSector: Gas Utilities | |
| MarketCap: 371.977 Millions | |
| Recent Price: 2.44 Smart Investing & Trading Score: 60 | |
| Day Percent Change: 0.41% Day Change: 0.01 | |
| Week Change: 0.41% Year-to-date Change: -36.3% | |
| CLNE Links: Profile News Message Board | |
| Charts:- Daily , Weekly | |
| Add CLNE to Watchlist: View: Get Complete CLNE Trend Analysis ➞ | |
 | HCKT The Hackett Group, Inc. |
| Sector: Technology | |
| SubSector: Information Technology Services | |
| MarketCap: 334.468 Millions | |
| Recent Price: 22.04 Smart Investing & Trading Score: 17 | |
| Day Percent Change: 0.41% Day Change: 0.09 | |
| Week Change: 0.41% Year-to-date Change: -3.2% | |
| HCKT Links: Profile News Message Board | |
| Charts:- Daily , Weekly | |
| Add HCKT to Watchlist: View: Get Complete HCKT Trend Analysis ➞ | |
 | MTDR Matador Resources Company |
| Sector: Energy | |
| SubSector: Independent Oil & Gas | |
| MarketCap: 196.593 Millions | |
| Recent Price: 65.88 Smart Investing & Trading Score: 61 | |
| Day Percent Change: 0.41% Day Change: 0.27 | |
| Week Change: 0.41% Year-to-date Change: 15.9% | |
| MTDR Links: Profile News Message Board | |
| Charts:- Daily , Weekly | |
| Add MTDR to Watchlist: View: Get Complete MTDR Trend Analysis ➞ | |
 | NJR New Jersey Resources Corporation |
| Sector: Utilities | |
| SubSector: Gas Utilities | |
| MarketCap: 3320.27 Millions | |
| Recent Price: 43.52 Smart Investing & Trading Score: 83 | |
| Day Percent Change: 0.40% Day Change: 0.17 | |
| Week Change: 0.4% Year-to-date Change: -2.4% | |
| NJR Links: Profile News Message Board | |
| Charts:- Daily , Weekly | |
| Add NJR to Watchlist: View: Get Complete NJR Trend Analysis ➞ | |
 | NTGR NETGEAR, Inc. |
| Sector: Technology | |
| SubSector: Communication Equipment | |
| MarketCap: 558.839 Millions | |
| Recent Price: 14.91 Smart Investing & Trading Score: 95 | |
| Day Percent Change: 0.40% Day Change: 0.06 | |
| Week Change: 0.4% Year-to-date Change: 2.3% | |
| NTGR Links: Profile News Message Board | |
| Charts:- Daily , Weekly | |
| Add NTGR to Watchlist: View: Get Complete NTGR Trend Analysis ➞ | |
 | PSMT PriceSmart, Inc. |
| Sector: Services & Goods | |
| SubSector: Discount, Variety Stores | |
| MarketCap: 1655.72 Millions | |
| Recent Price: 81.82 Smart Investing & Trading Score: 90 | |
| Day Percent Change: 0.40% Day Change: 0.33 | |
| Week Change: 0.4% Year-to-date Change: 8.0% | |
| PSMT Links: Profile News Message Board | |
| Charts:- Daily , Weekly | |
| Add PSMT to Watchlist: View: Get Complete PSMT Trend Analysis ➞ | |
 | MDXG MiMedx Group, Inc. |
| Sector: Health Care | |
| SubSector: Medical Appliances & Equipment | |
| MarketCap: 371.08 Millions | |
| Recent Price: 6.29 Smart Investing & Trading Score: 29 | |
| Day Percent Change: 0.40% Day Change: 0.03 | |
| Week Change: 0.4% Year-to-date Change: -28.2% | |
| MDXG Links: Profile News Message Board | |
| Charts:- Daily , Weekly | |
| Add MDXG to Watchlist: View: Get Complete MDXG Trend Analysis ➞ | |
 | HMN Horace Mann Educators Corporation |
| Sector: Financials | |
| SubSector: Property & Casualty Insurance | |
| MarketCap: 1545.52 Millions | |
| Recent Price: 36.88 Smart Investing & Trading Score: 62 | |
| Day Percent Change: 0.39% Day Change: 0.14 | |
| Week Change: 0.39% Year-to-date Change: 12.8% | |
| HMN Links: Profile News Message Board | |
| Charts:- Daily , Weekly | |
| Add HMN to Watchlist: View: Get Complete HMN Trend Analysis ➞ | |
 | MUR Murphy Oil Corporation |
| Sector: Energy | |
| SubSector: Independent Oil & Gas | |
| MarketCap: 985.993 Millions | |
| Recent Price: 46.62 Smart Investing & Trading Score: 75 | |
| Day Percent Change: 0.39% Day Change: 0.18 | |
| Week Change: 0.39% Year-to-date Change: 9.3% | |
| MUR Links: Profile News Message Board | |
| Charts:- Daily , Weekly | |
| Add MUR to Watchlist: View: Get Complete MUR Trend Analysis ➞ | |
 | APOG Apogee Enterprises, Inc. |
| Sector: Industrials | |
| SubSector: General Building Materials | |
| MarketCap: 510.653 Millions | |
| Recent Price: 62.29 Smart Investing & Trading Score: 88 | |
| Day Percent Change: 0.39% Day Change: 0.24 | |
| Week Change: 0.39% Year-to-date Change: 16.6% | |
| APOG Links: Profile News Message Board | |
| Charts:- Daily , Weekly | |
| Add APOG to Watchlist: View: Get Complete APOG Trend Analysis ➞ | |
 | RELY Remitly Global, Inc. |
| Sector: Technology | |
| SubSector: Software - Infrastructure | |
| MarketCap: 3320 Millions | |
| Recent Price: 18.13 Smart Investing & Trading Score: 71 | |
| Day Percent Change: 0.39% Day Change: 0.07 | |
| Week Change: 0.39% Year-to-date Change: -6.6% | |
| RELY Links: Profile News Message Board | |
| Charts:- Daily , Weekly | |
| Add RELY to Watchlist: View: Get Complete RELY Trend Analysis ➞ | |
 | HRI Herc Holdings Inc. |
| Sector: Transports | |
| SubSector: Rental & Leasing Services | |
| MarketCap: 469.344 Millions | |
| Recent Price: 152.87 Smart Investing & Trading Score: 51 | |
| Day Percent Change: 0.39% Day Change: 0.60 | |
| Week Change: 0.39% Year-to-date Change: 2.7% | |
| HRI Links: Profile News Message Board | |
| Charts:- Daily , Weekly | |
| Add HRI to Watchlist: View: Get Complete HRI Trend Analysis ➞ | |
 | PLYM Plymouth Industrial REIT, Inc. |
| Sector: Financials | |
| SubSector: REIT - Industrial | |
| MarketCap: 153.449 Millions | |
| Recent Price: 20.84 Smart Investing & Trading Score: 35 | |
| Day Percent Change: 0.39% Day Change: 0.08 | |
| Week Change: 0.39% Year-to-date Change: -13.4% | |
| PLYM Links: Profile News Message Board | |
| Charts:- Daily , Weekly | |
| Add PLYM to Watchlist: View: Get Complete PLYM Trend Analysis ➞ | |
 | PUBM PubMatic, Inc. |
| Sector: Technology | |
| SubSector: Software Application | |
| MarketCap: 56787 Millions | |
| Recent Price: 23.30 Smart Investing & Trading Score: 69 | |
| Day Percent Change: 0.39% Day Change: 0.09 | |
| Week Change: 0.39% Year-to-date Change: 42.9% | |
| PUBM Links: Profile News Message Board | |
| Charts:- Daily , Weekly | |
| Add PUBM to Watchlist: View: Get Complete PUBM Trend Analysis ➞ | |
 | CRMT America s Car-Mart, Inc. |
| Sector: Services & Goods | |
| SubSector: Auto Dealerships | |
| MarketCap: 329.921 Millions | |
| Recent Price: 58.09 Smart Investing & Trading Score: 57 | |
| Day Percent Change: 0.38% Day Change: 0.22 | |
| Week Change: 0.38% Year-to-date Change: -23.3% | |
| CRMT Links: Profile News Message Board | |
| Charts:- Daily , Weekly | |
| Add CRMT to Watchlist: View: Get Complete CRMT Trend Analysis ➞ | |
 | SM SM Energy Company |
| Sector: Energy | |
| SubSector: Independent Oil & Gas | |
| MarketCap: 137.593 Millions | |
| Recent Price: 51.03 Smart Investing & Trading Score: 83 | |
| Day Percent Change: 0.37% Day Change: 0.19 | |
| Week Change: 0.37% Year-to-date Change: 31.8% | |
| SM Links: Profile News Message Board | |
| Charts:- Daily , Weekly | |
| Add SM to Watchlist: View: Get Complete SM Trend Analysis ➞ | |
 | NBR Nabors Industries Ltd. |
| Sector: Energy | |
| SubSector: Oil & Gas Drilling & Exploration | |
| MarketCap: 240.539 Millions | |
| Recent Price: 77.48 Smart Investing & Trading Score: 27 | |
| Day Percent Change: 0.37% Day Change: 0.28 | |
| Week Change: 0.37% Year-to-date Change: -5.1% | |
| NBR Links: Profile News Message Board | |
| Charts:- Daily , Weekly | |
| Add NBR to Watchlist: View: Get Complete NBR Trend Analysis ➞ | |
 | ENS EnerSys |
| Sector: Industrials | |
| SubSector: Industrial Electrical Equipment | |
| MarketCap: 2068.79 Millions | |
| Recent Price: 91.62 Smart Investing & Trading Score: 25 | |
| Day Percent Change: 0.37% Day Change: 0.34 | |
| Week Change: 0.37% Year-to-date Change: -9.3% | |
| ENS Links: Profile News Message Board | |
| Charts:- Daily , Weekly | |
| Add ENS to Watchlist: View: Get Complete ENS Trend Analysis ➞ | |
 | CWT California Water Service Group |
| Sector: Utilities | |
| SubSector: Water Utilities | |
| MarketCap: 2790.92 Millions | |
| Recent Price: 48.10 Smart Investing & Trading Score: 100 | |
| Day Percent Change: 0.37% Day Change: 0.17 | |
| Week Change: 0.37% Year-to-date Change: -7.3% | |
| CWT Links: Profile News Message Board | |
| Charts:- Daily , Weekly | |
| Add CWT to Watchlist: View: Get Complete CWT Trend Analysis ➞ | |
 | ENSG The Ensign Group, Inc. |
| Sector: Health Care | |
| SubSector: Long-Term Care Facilities | |
| MarketCap: 2053.76 Millions | |
| Recent Price: 117.68 Smart Investing & Trading Score: 51 | |
| Day Percent Change: 0.37% Day Change: 0.43 | |
| Week Change: 0.37% Year-to-date Change: 4.9% | |
| ENSG Links: Profile News Message Board | |
| Charts:- Daily , Weekly | |
| Add ENSG to Watchlist: View: Get Complete ENSG Trend Analysis ➞ | |
 | ACT Enact Holdings, Inc. |
| Sector: Financials | |
| SubSector: Insurance - Specialty | |
| MarketCap: 4010 Millions | |
| Recent Price: 30.05 Smart Investing & Trading Score: 73 | |
| Day Percent Change: 0.37% Day Change: 0.11 | |
| Week Change: 0.37% Year-to-date Change: 3.3% | |
| ACT Links: Profile News Message Board | |
| Charts:- Daily , Weekly | |
| Add ACT to Watchlist: View: Get Complete ACT Trend Analysis ➞ | |
 | APLE Apple Hospitality REIT, Inc. |
| Sector: Financials | |
| SubSector: REIT - Hotel/Motel | |
| MarketCap: 1515.74 Millions | |
| Recent Price: 15.06 Smart Investing & Trading Score: 10 | |
| Day Percent Change: 0.37% Day Change: 0.05 | |
| Week Change: 0.37% Year-to-date Change: -9.4% | |
| APLE Links: Profile News Message Board | |
| Charts:- Daily , Weekly | |
| Add APLE to Watchlist: View: Get Complete APLE Trend Analysis ➞ | |
| Too many stocks? View smallcap stocks filtered by marketcap & sector |
| Marketcap: All SmallCap Stocks (default-no microcap), Large, Mid-Range, Small & MicroCap |
| Sector: Tech, Finance, Energy, Staples, Retail, Industrial, Materials, Utilities & Medical |
|
Best Stocks Today 12Stocks.com |
© 2024 12Stocks.com Terms & Conditions Privacy Contact Us
All Information Provided Only For Education And Not To Be Used For Investing or Trading. See Terms & Conditions


One More Thing ... Get Best Stocks Delivered Daily!
Never Ever Miss A Move With Our Top Ten Stocks Lists
Find Best Stocks In Any Market - Bull or Bear Market
Take A Peek At Our Top Ten Stocks Lists: Daily, Weekly, Year-to-Date & Top Trends
Find Best Stocks In Any Market - Bull or Bear Market
Take A Peek At Our Top Ten Stocks Lists: Daily, Weekly, Year-to-Date & Top Trends
Smallcap Stocks With Best Up Trends [0-bearish to 100-bullish]: Bakkt [100], Deciphera [100], Phibro Animal[100], Heartland Financial[100], Sight Sciences[100], PTC [100], TPI Composites[100], Cullinan Oncology[100], Fulton Financial[100], Xencor [100], Richardson Electronics[100]
Best Smallcap Stocks Year-to-Date:
Janux [413.54%], Bakkt [355.16%], Viking [305.7%], Alpine Immune[239.57%], Longboard [237.23%], Super Micro[213.88%], Avidity Biosciences[175.17%], Arcutis Bio[170.43%], Cullinan Oncology[169.84%], Vera [164.02%], Hippo [137.76%] Best Smallcap Stocks This Week:
Deciphera [71.95%], Phibro Animal[28.32%], Vaxxinity [20.15%], Heartland Financial[18.56%], Janux [16.28%], Acrivon [16.08%], Velo3D [14.96%], MultiPlan [14.93%], Amprius [14.37%], Codexis [13.72%], ESS Tech[13.67%] Best Smallcap Stocks Daily:
Bakkt [2439.40%], Deciphera [71.95%], Phibro Animal[28.32%], Vaxxinity [20.15%], Heartland Financial[18.56%], Janux [16.28%], Acrivon [16.08%], Velo3D [14.96%], MultiPlan [14.93%], Amprius [14.37%], Codexis [13.72%]