
 Login Sign Up


| |||||
 |  | ||||

| 12Stocks.com Market Intelligence |
Best SmallCap Stocks
|
| In a hurry? Small Cap Stock Lists: Performance Trends Table, Stock Charts
Sort Small Cap stocks: Daily, Weekly, Year-to-Date, Market Cap & Trends. Filter Small Cap stocks list by sector: Show all, Tech, Finance, Energy, Staples, Retail, Industrial, Materials, Utilities and HealthCare Filter Small Cap stocks list by size: All Large Medium Small and MicroCap |
| 12Stocks.com Small Cap Stocks Performances & Trends Daily | |||||||||
|
|  The overall Smart Investing & Trading Score is 49 (0-bearish to 100-bullish) which puts Small Cap index in short term neutral trend. The Smart Investing & Trading Score from previous trading session is 14 and hence an improvement of trend.
| ||||||||
Here are the Smart Investing & Trading Scores of the most requested small cap stocks at 12Stocks.com (click stock name for detailed review):
|


| 12Stocks.com: Investing in Smallcap Index with Stocks | |
|
The following table helps investors and traders sort through current performance and trends (as measured by Smart Investing & Trading Score) of various
stocks in the Smallcap Index. Quick View: Move mouse or cursor over stock symbol (ticker) to view short-term technical chart and over stock name to view long term chart. Click on  to add stock symbol to your watchlist and to add stock symbol to your watchlist and  to view watchlist. Click on any ticker or stock name for detailed market intelligence report for that stock. to view watchlist. Click on any ticker or stock name for detailed market intelligence report for that stock. |
12Stocks.com Performance of Stocks in Smallcap Index
| Ticker | Stock Name | Watchlist | Category | Recent Price | Smart Investing & Trading Score | Change % | Weekly Change% |
| UNFI | United Natural |   | Consumer Staples | 9.41 | 59 | 4.09% | 3.07% |
| BGS | B&G Foods | | Consumer Staples | 11.40 | 74 | 2.89% | 3.07% |
| MITK | Mitek Systems | | Technology | 13.09 | 63 | 4.89% | 3.07% |
| PDLB | PDL Community | | Financials | 8.40 | 57 | -0.59% | 3.07% |
| PROK | ProKidney | | Health Care | 2.18 | 63 | 0.93% | 3.07% |
| KW | Kennedy-Wilson | | Financials | 8.76 | 82 | 0.23% | 3.06% |
| UEC | Uranium Energy | | Materials | 7.12 | 60 | 4.09% | 3.04% |
| PIPR | Piper Sandler | | Financials | 203.16 | 95 | 2.45% | 3.04% |
| HMN | Horace Mann | | Financials | 37.85 | 100 | 0.32% | 3.02% |
| OGS | ONE Gas | | Utilities | 65.88 | 100 | 1.28% | 3.02% |
| USPH | U.S. Physical | | Health Care | 103.64 | 59 | 2.05% | 3.01% |
| OSUR | OraSure | | Health Care | 5.48 | 50 | 2.81% | 3.01% |
| TSBK | Timberland Bancorp | | Financials | 26.01 | 80 | 0.93% | 3.01% |
| NXRT | NexPoint Residential | | Financials | 34.27 | 83 | 0.59% | 3.01% |
| COLL | Collegium Pharmaceutical | | Health Care | 37.51 | 80 | -0.71% | 2.99% |
| NRIX | Nurix | | Health Care | 12.73 | 63 | -2.68% | 2.99% |
| SLG | SL Green | | Financials | 52.11 | 85 | 4.91% | 2.96% |
| SFL | SFL | | Transports | 13.63 | 95 | 2.79% | 2.95% |
| PCYO | Pure Cycle | | Utilities | 9.78 | 74 | 2.52% | 2.95% |
| IPSC | Century | | Health Care | 2.96 | 22 | -2.31% | 2.95% |
| BOWL | Bowlero | | Services & Goods | 12.06 | 49 | 1.30% | 2.95% |
| NL | NL Industries | | Services & Goods | 8.04 | 76 | 0.50% | 2.94% |
| ZYXI | Zynex | | Health Care | 11.54 | 39 | -1.95% | 2.94% |
| CSV | Carriage Services | | Services & Goods | 25.65 | 75 | -0.62% | 2.93% |
| TK | Teekay | | Transports | 7.72 | 90 | 2.80% | 2.93% |


| Too many stocks? View smallcap stocks filtered by marketcap & sector |
| Marketcap: All SmallCap Stocks (default-no microcap), Large, Mid-Range, Small |
| Smallcap Sector: Tech, Finance, Energy, Staples, Retail, Industrial, Materials, & Medical |
|
Get the most comprehensive stock market coverage daily at 12Stocks.com ➞ Best Stocks Today ➞ Best Stocks Weekly ➞ Best Stocks Year-to-Date ➞ Best Stocks Trends ➞  Best Stocks Today 12Stocks.com Best Nasdaq Stocks ➞ Best S&P 500 Stocks ➞ Best Tech Stocks ➞ Best Biotech Stocks ➞ |
| Detailed Overview of SmallCap Stocks |
| SmallCap Technical Overview, Leaders & Laggards, Top SmallCap ETF Funds & Detailed SmallCap Stocks List, Charts, Trends & More |
| Smallcap: Technical Analysis, Trends & YTD Performance | |
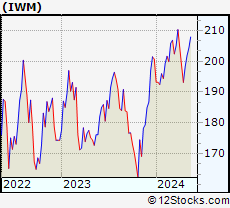
| SmallCap segment as represented by
IWM, an exchange-traded fund [ETF], holds basket of thousands of smallcap stocks from across all major sectors of the US stock market. The smallcap index (contains stocks like Riverbed & Sotheby's) is down by -0.39% and is currently underperforming the overall market by -6.01% year-to-date. Below is a quick view of technical charts and trends: | |
 IWM Weekly Chart |
|
| Long Term Trend: Not Good | |
| Medium Term Trend: Good | |
 IWM Daily Chart |
|
| Short Term Trend: Deteriorating | |
| Overall Trend Score: 49 | |
| YTD Performance: -0.39% | |
| **Trend Scores & Views Are Only For Educational Purposes And Not For Investing | |
| 12Stocks.com: Top Performing Small Cap Index Stocks | ||||||||||||||||||||||||||||||||||||||||||||||||
 The top performing Small Cap Index stocks year to date are
Now, more recently, over last week, the top performing Small Cap Index stocks on the move are


|
||||||||||||||||||||||||||||||||||||||||||||||||
| 12Stocks.com: Investing in Smallcap Index using Exchange Traded Funds | |
|
The following table shows list of key exchange traded funds (ETF) that
help investors track Smallcap index. The following list also includes leveraged ETF funds that track twice or thrice the daily returns of Smallcap indices. Short or inverse ETF funds move in the opposite direction to the index they track and are useful during market pullbacks or during bear markets. Quick View: Move mouse or cursor over ETF symbol (ticker) to view short-term technical chart and over ETF name to view long term chart. Click on ticker or stock name for detailed view. Click on to add stock symbol to your watchlist and to view watchlist. |
12Stocks.com List of ETFs that track Smallcap Index
| Ticker | ETF Name | Watchlist | Recent Price | Smart Investing & Trading Score | Change % | Week % | Year-to-date % |
| IWM | iShares Russell 2000 | | 199.92 | 49 | 1.84 | 0.77 | -0.39% |
| IJR | iShares Core S&P Small-Cap | | 106.33 | 50 | 1.52 | 0.64 | -1.77% |
| VTWO | Vanguard Russell 2000 ETF | | 80.85 | 42 | 1.88 | 0.79 | -0.31% |
| IWN | iShares Russell 2000 Value | | 152.88 | 75 | 2.04 | 1.15 | -1.58% |
| IWO | iShares Russell 2000 Growth | | 254.34 | 32 | 1.91 | 0.49 | 0.84% |
| IJS | iShares S&P Small-Cap 600 Value | | 98.02 | 43 | 1.68 | 0.85 | -4.9% |
| IJT | iShares S&P Small-Cap 600 Growth | | 126.72 | 63 | 1.42 | 0.5 | 1.26% |
| XSLV | PowerShares S&P SmallCap Low Volatil ETF | | 43.14 | 73 | 0.72 | 0.98 | -2.29% |
| SDD | ProShares UltraShort SmallCap600 | | 19.31 | 56 | -2.02 | -0.21 | 4.79% |
| SMLV | SPDR SSGA US Small Cap Low Volatil ETF | | 108.83 | 87 | 1.30 | 1.22 | -3.27% |
| SAA | ProShares Ultra SmallCap600 | | 22.93 | 42 | 1.56 | -0.46 | -8.08% |
| SBB | ProShares Short SmallCap600 | | 16.37 | 49 | -1.14 | -0.09 | 2.76% |
| 12Stocks.com: Charts, Trends, Fundamental Data and Performances of SmallCap Stocks | |
|
We now take in-depth look at all SmallCap stocks including charts, multi-period performances and overall trends (as measured by Smart Investing & Trading Score). One can sort SmallCap stocks (click link to choose) by Daily, Weekly and by Year-to-Date performances. Also, one can sort by size of the company or by market capitalization. |
| Select Your Default Chart Type: | |||||
| |||||
| Click on stock symbol or name for detailed view. Click on to add stock symbol to your watchlist and to view watchlist. Quick View: Move mouse or cursor over "Daily" to quickly view daily technical stock chart and over "Weekly" to view weekly technical stock chart. | |||||

 | UNFI United Natural Foods, Inc. |
| Sector: Consumer Staples | |
| SubSector: Food Wholesale | |
| MarketCap: 746.329 Millions | |
| Recent Price: 9.41 Smart Investing & Trading Score: 59 | |
| Day Percent Change: 4.09% Day Change: 0.37 | |
| Week Change: 3.07% Year-to-date Change: -42.0% | |
| UNFI Links: Profile News Message Board | |
| Charts:- Daily , Weekly | |
| Add UNFI to Watchlist: View: Get Complete UNFI Trend Analysis ➞ | |
 | BGS B&G Foods, Inc. |
| Sector: Consumer Staples | |
| SubSector: Processed & Packaged Goods | |
| MarketCap: 1456.08 Millions | |
| Recent Price: 11.40 Smart Investing & Trading Score: 74 | |
| Day Percent Change: 2.89% Day Change: 0.32 | |
| Week Change: 3.07% Year-to-date Change: 8.6% | |
| BGS Links: Profile News Message Board | |
| Charts:- Daily , Weekly | |
| Add BGS to Watchlist: View: Get Complete BGS Trend Analysis ➞ | |
 | MITK Mitek Systems, Inc. |
| Sector: Technology | |
| SubSector: Application Software | |
| MarketCap: 265.962 Millions | |
| Recent Price: 13.09 Smart Investing & Trading Score: 63 | |
| Day Percent Change: 4.89% Day Change: 0.61 | |
| Week Change: 3.07% Year-to-date Change: 0.4% | |
| MITK Links: Profile News Message Board | |
| Charts:- Daily , Weekly | |
| Add MITK to Watchlist: View: Get Complete MITK Trend Analysis ➞ | |
 | PDLB PDL Community Bancorp |
| Sector: Financials | |
| SubSector: REIT - Retail | |
| MarketCap: 206.114 Millions | |
| Recent Price: 8.40 Smart Investing & Trading Score: 57 | |
| Day Percent Change: -0.59% Day Change: -0.05 | |
| Week Change: 3.07% Year-to-date Change: -13.9% | |
| PDLB Links: Profile News Message Board | |
| Charts:- Daily , Weekly | |
| Add PDLB to Watchlist: View: Get Complete PDLB Trend Analysis ➞ | |
 | PROK ProKidney Corp. |
| Sector: Health Care | |
| SubSector: Biotechnology | |
| MarketCap: 2470 Millions | |
| Recent Price: 2.18 Smart Investing & Trading Score: 63 | |
| Day Percent Change: 0.93% Day Change: 0.02 | |
| Week Change: 3.07% Year-to-date Change: 24.9% | |
| PROK Links: Profile News Message Board | |
| Charts:- Daily , Weekly | |
| Add PROK to Watchlist: View: Get Complete PROK Trend Analysis ➞ | |
 | KW Kennedy-Wilson Holdings, Inc. |
| Sector: Financials | |
| SubSector: Property Management | |
| MarketCap: 2025.42 Millions | |
| Recent Price: 8.76 Smart Investing & Trading Score: 82 | |
| Day Percent Change: 0.23% Day Change: 0.02 | |
| Week Change: 3.06% Year-to-date Change: -29.2% | |
| KW Links: Profile News Message Board | |
| Charts:- Daily , Weekly | |
| Add KW to Watchlist: View: Get Complete KW Trend Analysis ➞ | |
 | UEC Uranium Energy Corp. |
| Sector: Materials | |
| SubSector: Industrial Metals & Minerals | |
| MarketCap: 138.91 Millions | |
| Recent Price: 7.12 Smart Investing & Trading Score: 60 | |
| Day Percent Change: 4.09% Day Change: 0.28 | |
| Week Change: 3.04% Year-to-date Change: 11.3% | |
| UEC Links: Profile News Message Board | |
| Charts:- Daily , Weekly | |
| Add UEC to Watchlist: View: Get Complete UEC Trend Analysis ➞ | |
 | PIPR Piper Sandler Companies |
| Sector: Financials | |
| SubSector: Asset Management | |
| MarketCap: 759.603 Millions | |
| Recent Price: 203.16 Smart Investing & Trading Score: 95 | |
| Day Percent Change: 2.45% Day Change: 4.85 | |
| Week Change: 3.04% Year-to-date Change: 16.2% | |
| PIPR Links: Profile News Message Board | |
| Charts:- Daily , Weekly | |
| Add PIPR to Watchlist: View: Get Complete PIPR Trend Analysis ➞ | |
 | HMN Horace Mann Educators Corporation |
| Sector: Financials | |
| SubSector: Property & Casualty Insurance | |
| MarketCap: 1545.52 Millions | |
| Recent Price: 37.85 Smart Investing & Trading Score: 100 | |
| Day Percent Change: 0.32% Day Change: 0.12 | |
| Week Change: 3.02% Year-to-date Change: 15.8% | |
| HMN Links: Profile News Message Board | |
| Charts:- Daily , Weekly | |
| Add HMN to Watchlist: View: Get Complete HMN Trend Analysis ➞ | |
 | OGS ONE Gas, Inc. |
| Sector: Utilities | |
| SubSector: Gas Utilities | |
| MarketCap: 4051.17 Millions | |
| Recent Price: 65.88 Smart Investing & Trading Score: 100 | |
| Day Percent Change: 1.28% Day Change: 0.83 | |
| Week Change: 3.02% Year-to-date Change: 3.4% | |
| OGS Links: Profile News Message Board | |
| Charts:- Daily , Weekly | |
| Add OGS to Watchlist: View: Get Complete OGS Trend Analysis ➞ | |
 | USPH U.S. Physical Therapy, Inc. |
| Sector: Health Care | |
| SubSector: Specialized Health Services | |
| MarketCap: 793.556 Millions | |
| Recent Price: 103.64 Smart Investing & Trading Score: 59 | |
| Day Percent Change: 2.05% Day Change: 2.08 | |
| Week Change: 3.01% Year-to-date Change: 11.3% | |
| USPH Links: Profile News Message Board | |
| Charts:- Daily , Weekly | |
| Add USPH to Watchlist: View: Get Complete USPH Trend Analysis ➞ | |
 | OSUR OraSure Technologies, Inc. |
| Sector: Health Care | |
| SubSector: Medical Instruments & Supplies | |
| MarketCap: 468.26 Millions | |
| Recent Price: 5.48 Smart Investing & Trading Score: 50 | |
| Day Percent Change: 2.81% Day Change: 0.15 | |
| Week Change: 3.01% Year-to-date Change: -33.2% | |
| OSUR Links: Profile News Message Board | |
| Charts:- Daily , Weekly | |
| Add OSUR to Watchlist: View: Get Complete OSUR Trend Analysis ➞ | |
 | TSBK Timberland Bancorp, Inc. |
| Sector: Financials | |
| SubSector: Savings & Loans | |
| MarketCap: 155.03 Millions | |
| Recent Price: 26.01 Smart Investing & Trading Score: 80 | |
| Day Percent Change: 0.93% Day Change: 0.24 | |
| Week Change: 3.01% Year-to-date Change: -17.3% | |
| TSBK Links: Profile News Message Board | |
| Charts:- Daily , Weekly | |
| Add TSBK to Watchlist: View: Get Complete TSBK Trend Analysis ➞ | |
 | NXRT NexPoint Residential Trust, Inc. |
| Sector: Financials | |
| SubSector: REIT - Residential | |
| MarketCap: 839.161 Millions | |
| Recent Price: 34.27 Smart Investing & Trading Score: 83 | |
| Day Percent Change: 0.59% Day Change: 0.20 | |
| Week Change: 3.01% Year-to-date Change: -0.5% | |
| NXRT Links: Profile News Message Board | |
| Charts:- Daily , Weekly | |
| Add NXRT to Watchlist: View: Get Complete NXRT Trend Analysis ➞ | |
 | COLL Collegium Pharmaceutical, Inc. |
| Sector: Health Care | |
| SubSector: Drugs - Generic | |
| MarketCap: 569.185 Millions | |
| Recent Price: 37.51 Smart Investing & Trading Score: 80 | |
| Day Percent Change: -0.71% Day Change: -0.27 | |
| Week Change: 2.99% Year-to-date Change: 21.9% | |
| COLL Links: Profile News Message Board | |
| Charts:- Daily , Weekly | |
| Add COLL to Watchlist: View: Get Complete COLL Trend Analysis ➞ | |
 | NRIX Nurix Therapeutics, Inc. |
| Sector: Health Care | |
| SubSector: Biotechnology | |
| MarketCap: 16787 Millions | |
| Recent Price: 12.73 Smart Investing & Trading Score: 63 | |
| Day Percent Change: -2.68% Day Change: -0.35 | |
| Week Change: 2.99% Year-to-date Change: 23.2% | |
| NRIX Links: Profile News Message Board | |
| Charts:- Daily , Weekly | |
| Add NRIX to Watchlist: View: Get Complete NRIX Trend Analysis ➞ | |
 | SLG SL Green Realty Corp. |
| Sector: Financials | |
| SubSector: REIT - Retail | |
| MarketCap: 4048.14 Millions | |
| Recent Price: 52.11 Smart Investing & Trading Score: 85 | |
| Day Percent Change: 4.91% Day Change: 2.44 | |
| Week Change: 2.96% Year-to-date Change: 15.4% | |
| SLG Links: Profile News Message Board | |
| Charts:- Daily , Weekly | |
| Add SLG to Watchlist: View: Get Complete SLG Trend Analysis ➞ | |
 | SFL SFL Corporation Ltd. |
| Sector: Transports | |
| SubSector: Shipping | |
| MarketCap: 890.414 Millions | |
| Recent Price: 13.63 Smart Investing & Trading Score: 95 | |
| Day Percent Change: 2.79% Day Change: 0.37 | |
| Week Change: 2.95% Year-to-date Change: 20.8% | |
| SFL Links: Profile News Message Board | |
| Charts:- Daily , Weekly | |
| Add SFL to Watchlist: View: Get Complete SFL Trend Analysis ➞ | |
 | PCYO Pure Cycle Corporation |
| Sector: Utilities | |
| SubSector: Water Utilities | |
| MarketCap: 247.102 Millions | |
| Recent Price: 9.78 Smart Investing & Trading Score: 74 | |
| Day Percent Change: 2.52% Day Change: 0.24 | |
| Week Change: 2.95% Year-to-date Change: -6.6% | |
| PCYO Links: Profile News Message Board | |
| Charts:- Daily , Weekly | |
| Add PCYO to Watchlist: View: Get Complete PCYO Trend Analysis ➞ | |
 | IPSC Century Therapeutics, Inc. |
| Sector: Health Care | |
| SubSector: Biotechnology | |
| MarketCap: 187 Millions | |
| Recent Price: 2.96 Smart Investing & Trading Score: 22 | |
| Day Percent Change: -2.31% Day Change: -0.07 | |
| Week Change: 2.95% Year-to-date Change: -10.2% | |
| IPSC Links: Profile News Message Board | |
| Charts:- Daily , Weekly | |
| Add IPSC to Watchlist: View: Get Complete IPSC Trend Analysis ➞ | |
 | BOWL Bowlero Corp. |
| Sector: Services & Goods | |
| SubSector: Leisure | |
| MarketCap: 2000 Millions | |
| Recent Price: 12.06 Smart Investing & Trading Score: 49 | |
| Day Percent Change: 1.30% Day Change: 0.15 | |
| Week Change: 2.95% Year-to-date Change: -14.6% | |
| BOWL Links: Profile News Message Board | |
| Charts:- Daily , Weekly | |
| Add BOWL to Watchlist: View: Get Complete BOWL Trend Analysis ➞ | |
 | NL NL Industries, Inc. |
| Sector: Services & Goods | |
| SubSector: Industrial Equipment Wholesale | |
| MarketCap: 126.258 Millions | |
| Recent Price: 8.04 Smart Investing & Trading Score: 76 | |
| Day Percent Change: 0.50% Day Change: 0.04 | |
| Week Change: 2.94% Year-to-date Change: 43.3% | |
| NL Links: Profile News Message Board | |
| Charts:- Daily , Weekly | |
| Add NL to Watchlist: View: Get Complete NL Trend Analysis ➞ | |
 | ZYXI Zynex, Inc. |
| Sector: Health Care | |
| SubSector: Medical Appliances & Equipment | |
| MarketCap: 388.58 Millions | |
| Recent Price: 11.54 Smart Investing & Trading Score: 39 | |
| Day Percent Change: -1.95% Day Change: -0.23 | |
| Week Change: 2.94% Year-to-date Change: 6.0% | |
| ZYXI Links: Profile News Message Board | |
| Charts:- Daily , Weekly | |
| Add ZYXI to Watchlist: View: Get Complete ZYXI Trend Analysis ➞ | |
 | CSV Carriage Services, Inc. |
| Sector: Services & Goods | |
| SubSector: Personal Services | |
| MarketCap: 304.725 Millions | |
| Recent Price: 25.65 Smart Investing & Trading Score: 75 | |
| Day Percent Change: -0.62% Day Change: -0.16 | |
| Week Change: 2.93% Year-to-date Change: 2.6% | |
| CSV Links: Profile News Message Board | |
| Charts:- Daily , Weekly | |
| Add CSV to Watchlist: View: Get Complete CSV Trend Analysis ➞ | |
 | TK Teekay Corporation |
| Sector: Transports | |
| SubSector: Shipping | |
| MarketCap: 257.914 Millions | |
| Recent Price: 7.72 Smart Investing & Trading Score: 90 | |
| Day Percent Change: 2.80% Day Change: 0.21 | |
| Week Change: 2.93% Year-to-date Change: 8.0% | |
| TK Links: Profile News Message Board | |
| Charts:- Daily , Weekly | |
| Add TK to Watchlist: View: Get Complete TK Trend Analysis ➞ | |
| Too many stocks? View smallcap stocks filtered by marketcap & sector |
| Marketcap: All SmallCap Stocks (default-no microcap), Large, Mid-Range, Small & MicroCap |
| Sector: Tech, Finance, Energy, Staples, Retail, Industrial, Materials, Utilities & Medical |
|
Best Stocks Today 12Stocks.com |
© 2024 12Stocks.com Terms & Conditions Privacy Contact Us
All Information Provided Only For Education And Not To Be Used For Investing or Trading. See Terms & Conditions


One More Thing ... Get Best Stocks Delivered Daily!
Never Ever Miss A Move With Our Top Ten Stocks Lists
Find Best Stocks In Any Market - Bull or Bear Market
Take A Peek At Our Top Ten Stocks Lists: Daily, Weekly, Year-to-Date & Top Trends
Find Best Stocks In Any Market - Bull or Bear Market
Take A Peek At Our Top Ten Stocks Lists: Daily, Weekly, Year-to-Date & Top Trends
Smallcap Stocks With Best Up Trends [0-bearish to 100-bullish]: Emergent BioSolutions[100], Aspen Aerogels[100], Carvana Co[100], Perdoceo Education[100], Gannett Co[100], Pitney Bowes[100], Benchmark Electronics[100], Origin Materials[100], FormFactor [100], Lantheus [100], Q2 [100]
Best Smallcap Stocks Year-to-Date:
Janux [440.16%], Viking [307.09%], Longboard [273.98%], Alpine Immune[239.29%], Bakkt [187.89%], Avidity Biosciences[182.96%], Vera [170.74%], Cullinan Oncology[169.74%], Super Micro[168.25%], Arcutis Bio[166.25%], Y-mAbs [152.93%] Best Smallcap Stocks This Week:
Deciphera [73.24%], Emergent BioSolutions[71.88%], Eyenovia [49.22%], Aspen Aerogels[48.14%], P3 Health[38.51%], Carvana Co[38.18%], Cue Biopharma[37.73%], Origin Materials[36.24%], TransMedics Group[35.14%], Seres [34.55%], Enovix [32.07%] Best Smallcap Stocks Daily:
Emergent BioSolutions[70.98%], Aspen Aerogels[56.70%], Carvana Co[33.77%], Perdoceo Education[31.46%], Enovix [31.06%], Office Properties[28.00%], Gannett Co[26.97%], Sunnova Energy[25.21%], Pitney Bowes[24.70%], Pulmonx [21.50%], CommScope Holding[20.95%]