
 Login Sign Up


| |||||
 |  | ||||

| 12Stocks.com Market Intelligence |
Best SmallCap Stocks
|
| In a hurry? Small Cap Stock Lists: Performance Trends Table, Stock Charts
Sort Small Cap stocks: Daily, Weekly, Year-to-Date, Market Cap & Trends. Filter Small Cap stocks list by sector: Show all, Tech, Finance, Energy, Staples, Retail, Industrial, Materials, Utilities and HealthCare Filter Small Cap stocks list by size: All Large Medium Small and MicroCap |
| 12Stocks.com Small Cap Stocks Performances & Trends Daily | |||||||||
|
|  The overall Smart Investing & Trading Score is 49 (0-bearish to 100-bullish) which puts Small Cap index in short term neutral trend. The Smart Investing & Trading Score from previous trading session is 14 and hence an improvement of trend.
| ||||||||
Here are the Smart Investing & Trading Scores of the most requested small cap stocks at 12Stocks.com (click stock name for detailed review):
|


| 12Stocks.com: Investing in Smallcap Index with Stocks | |
|
The following table helps investors and traders sort through current performance and trends (as measured by Smart Investing & Trading Score) of various
stocks in the Smallcap Index. Quick View: Move mouse or cursor over stock symbol (ticker) to view short-term technical chart and over stock name to view long term chart. Click on  to add stock symbol to your watchlist and to add stock symbol to your watchlist and  to view watchlist. Click on any ticker or stock name for detailed market intelligence report for that stock. to view watchlist. Click on any ticker or stock name for detailed market intelligence report for that stock. |
12Stocks.com Performance of Stocks in Smallcap Index
| Ticker | Stock Name | Watchlist | Category | Recent Price | Smart Investing & Trading Score | Change % | Weekly Change% |
| AMAL | Amalgamated Bank |   | Financials | 25.07 | 90 | 0.76% | 1.91% |
| ALHC | Alignment Healthcare | | Health Care | 5.33 | 69 | 2.11% | 1.91% |
| ECPG | Encore Capital | | Financials | 42.42 | 35 | 1.53% | 1.90% |
| WSBC | WesBanco | | Financials | 28.04 | 67 | 1.89% | 1.89% |
| WD | Walker & Dunlop | | Financials | 94.97 | 57 | 2.38% | 1.89% |
| ABCB | Ameris Bancorp | | Financials | 48.78 | 76 | 1.56% | 1.88% |
| SBSI | Southside Bancshares | | Financials | 27.78 | 67 | 2.70% | 1.87% |
| LGND | Ligand | | Health Care | 71.89 | 37 | 0.66% | 1.87% |
| PECO | Phillips Edison | | Financials | 33.22 | 57 | 1.78% | 1.87% |
| SLVM | Sylvamo | | Materials | 64.23 | 100 | 1.98% | 1.86% |
| AIT | Applied Industrial | | Services & Goods | 184.24 | 17 | 2.00% | 1.85% |
| VRA | Vera Bradley | | Consumer Staples | 6.87 | 57 | 4.09% | 1.85% |
| FRPH | FRP | | Financials | 30.99 | 25 | 1.27% | 1.84% |
| TBBK | Bancorp | | Financials | 31.36 | 25 | 0.29% | 1.82% |
| BLX | Banco Latinoamericano | | Financials | 30.11 | 78 | 3.42% | 1.81% |
| NWFL | Norwood Financial | | Financials | 24.81 | 57 | 0.53% | 1.81% |
| DCO | Ducommun | | Industrials | 54.91 | 93 | 1.03% | 1.80% |
| EPC | Edgewell Personal | | Consumer Staples | 38.10 | 87 | 1.53% | 1.80% |
| RYAM | Rayonier Advanced | | Materials | 3.96 | 53 | 2.86% | 1.80% |
| OABI | OmniAb | | Health Care | 4.55 | 27 | 0.22% | 1.79% |
| LANC | Lancaster Colony | | Consumer Staples | 190.36 | 32 | -0.56% | 1.78% |
| UTI | Universal Technical | | Services & Goods | 15.47 | 83 | 1.18% | 1.78% |
| NBTB | NBT Bancorp | | Financials | 36.61 | 100 | 1.10% | 1.78% |
| SGMO | Sangamo | | Health Care | 0.53 | 39 | -3.09% | 1.78% |
| RMAX | RE/MAX | | Financials | 7.18 | 52 | -0.21% | 1.77% |


| Too many stocks? View smallcap stocks filtered by marketcap & sector |
| Marketcap: All SmallCap Stocks (default-no microcap), Large, Mid-Range, Small |
| Smallcap Sector: Tech, Finance, Energy, Staples, Retail, Industrial, Materials, & Medical |
|
Get the most comprehensive stock market coverage daily at 12Stocks.com ➞ Best Stocks Today ➞ Best Stocks Weekly ➞ Best Stocks Year-to-Date ➞ Best Stocks Trends ➞  Best Stocks Today 12Stocks.com Best Nasdaq Stocks ➞ Best S&P 500 Stocks ➞ Best Tech Stocks ➞ Best Biotech Stocks ➞ |
| Detailed Overview of SmallCap Stocks |
| SmallCap Technical Overview, Leaders & Laggards, Top SmallCap ETF Funds & Detailed SmallCap Stocks List, Charts, Trends & More |
| Smallcap: Technical Analysis, Trends & YTD Performance | |
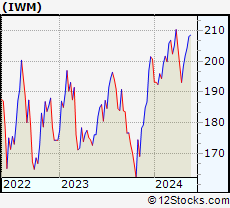
| SmallCap segment as represented by
IWM, an exchange-traded fund [ETF], holds basket of thousands of smallcap stocks from across all major sectors of the US stock market. The smallcap index (contains stocks like Riverbed & Sotheby's) is down by -0.42% and is currently underperforming the overall market by -6.01% year-to-date. Below is a quick view of technical charts and trends: | |
 IWM Weekly Chart |
|
| Long Term Trend: Not Good | |
| Medium Term Trend: Good | |
 IWM Daily Chart |
|
| Short Term Trend: Deteriorating | |
| Overall Trend Score: 49 | |
| YTD Performance: -0.42% | |
| **Trend Scores & Views Are Only For Educational Purposes And Not For Investing | |
| 12Stocks.com: Top Performing Small Cap Index Stocks | ||||||||||||||||||||||||||||||||||||||||||||||||
 The top performing Small Cap Index stocks year to date are
Now, more recently, over last week, the top performing Small Cap Index stocks on the move are


|
||||||||||||||||||||||||||||||||||||||||||||||||
| 12Stocks.com: Investing in Smallcap Index using Exchange Traded Funds | |
|
The following table shows list of key exchange traded funds (ETF) that
help investors track Smallcap index. The following list also includes leveraged ETF funds that track twice or thrice the daily returns of Smallcap indices. Short or inverse ETF funds move in the opposite direction to the index they track and are useful during market pullbacks or during bear markets. Quick View: Move mouse or cursor over ETF symbol (ticker) to view short-term technical chart and over ETF name to view long term chart. Click on ticker or stock name for detailed view. Click on to add stock symbol to your watchlist and to view watchlist. |
12Stocks.com List of ETFs that track Smallcap Index
| Ticker | ETF Name | Watchlist | Recent Price | Smart Investing & Trading Score | Change % | Week % | Year-to-date % |
| IWM | iShares Russell 2000 | | 199.87 | 49 | 1.81 | 0.75 | -0.42% |
| IJR | iShares Core S&P Small-Cap | | 106.30 | 50 | 1.49 | 0.62 | -1.8% |
| VTWO | Vanguard Russell 2000 ETF | | 80.62 | 7 | 1.59 | 0.5 | -0.59% |
| IWN | iShares Russell 2000 Value | | 152.63 | 50 | 1.87 | 0.98 | -1.74% |
| IWO | iShares Russell 2000 Growth | | 253.75 | 17 | 1.67 | 0.26 | 0.61% |
| IJS | iShares S&P Small-Cap 600 Value | | 97.92 | 13 | 1.58 | 0.75 | -5% |
| IJT | iShares S&P Small-Cap 600 Growth | | 126.18 | 20 | 0.99 | 0.07 | 0.83% |
| XSLV | PowerShares S&P SmallCap Low Volatil ETF | | 43.15 | 42 | 0.75 | 1.01 | -2.27% |
| SDD | ProShares UltraShort SmallCap600 | | 19.31 | 61 | -2.02 | -0.21 | 4.79% |
| SAA | ProShares Ultra SmallCap600 | | 22.93 | 32 | 1.56 | -0.46 | -8.08% |
| SMLV | SPDR SSGA US Small Cap Low Volatil ETF | | 108.63 | 37 | 1.11 | 1.04 | -3.45% |
| SBB | ProShares Short SmallCap600 | | 16.56 | 71 | 0.00 | 1.06 | 3.94% |
| 12Stocks.com: Charts, Trends, Fundamental Data and Performances of SmallCap Stocks | |
|
We now take in-depth look at all SmallCap stocks including charts, multi-period performances and overall trends (as measured by Smart Investing & Trading Score). One can sort SmallCap stocks (click link to choose) by Daily, Weekly and by Year-to-Date performances. Also, one can sort by size of the company or by market capitalization. |
| Select Your Default Chart Type: | |||||
| |||||
| Click on stock symbol or name for detailed view. Click on to add stock symbol to your watchlist and to view watchlist. Quick View: Move mouse or cursor over "Daily" to quickly view daily technical stock chart and over "Weekly" to view weekly technical stock chart. | |||||

 | AMAL Amalgamated Bank |
| Sector: Financials | |
| SubSector: Regional - Northeast Banks | |
| MarketCap: 321.899 Millions | |
| Recent Price: 25.07 Smart Investing & Trading Score: 90 | |
| Day Percent Change: 0.76% Day Change: 0.19 | |
| Week Change: 1.91% Year-to-date Change: -6.9% | |
| AMAL Links: Profile News Message Board | |
| Charts:- Daily , Weekly | |
| Add AMAL to Watchlist: View: Get Complete AMAL Trend Analysis ➞ | |
 | ALHC Alignment Healthcare, Inc. |
| Sector: Health Care | |
| SubSector: Healthcare Plans | |
| MarketCap: 1100 Millions | |
| Recent Price: 5.33 Smart Investing & Trading Score: 69 | |
| Day Percent Change: 2.11% Day Change: 0.11 | |
| Week Change: 1.91% Year-to-date Change: -39.8% | |
| ALHC Links: Profile News Message Board | |
| Charts:- Daily , Weekly | |
| Add ALHC to Watchlist: View: Get Complete ALHC Trend Analysis ➞ | |
 | ECPG Encore Capital Group, Inc. |
| Sector: Financials | |
| SubSector: Asset Management | |
| MarketCap: 661.503 Millions | |
| Recent Price: 42.42 Smart Investing & Trading Score: 35 | |
| Day Percent Change: 1.53% Day Change: 0.64 | |
| Week Change: 1.9% Year-to-date Change: -16.4% | |
| ECPG Links: Profile News Message Board | |
| Charts:- Daily , Weekly | |
| Add ECPG to Watchlist: View: Get Complete ECPG Trend Analysis ➞ | |
 | WSBC WesBanco, Inc. |
| Sector: Financials | |
| SubSector: Regional - Mid-Atlantic Banks | |
| MarketCap: 1575.79 Millions | |
| Recent Price: 28.04 Smart Investing & Trading Score: 67 | |
| Day Percent Change: 1.89% Day Change: 0.52 | |
| Week Change: 1.89% Year-to-date Change: -10.6% | |
| WSBC Links: Profile News Message Board | |
| Charts:- Daily , Weekly | |
| Add WSBC to Watchlist: View: Get Complete WSBC Trend Analysis ➞ | |
 | WD Walker & Dunlop, Inc. |
| Sector: Financials | |
| SubSector: Mortgage Investment | |
| MarketCap: 1312.99 Millions | |
| Recent Price: 94.97 Smart Investing & Trading Score: 57 | |
| Day Percent Change: 2.38% Day Change: 2.21 | |
| Week Change: 1.89% Year-to-date Change: -14.5% | |
| WD Links: Profile News Message Board | |
| Charts:- Daily , Weekly | |
| Add WD to Watchlist: View: Get Complete WD Trend Analysis ➞ | |
 | ABCB Ameris Bancorp |
| Sector: Financials | |
| SubSector: Regional - Mid-Atlantic Banks | |
| MarketCap: 1537.79 Millions | |
| Recent Price: 48.78 Smart Investing & Trading Score: 76 | |
| Day Percent Change: 1.56% Day Change: 0.75 | |
| Week Change: 1.88% Year-to-date Change: -8.1% | |
| ABCB Links: Profile News Message Board | |
| Charts:- Daily , Weekly | |
| Add ABCB to Watchlist: View: Get Complete ABCB Trend Analysis ➞ | |
 | SBSI Southside Bancshares, Inc. |
| Sector: Financials | |
| SubSector: Regional - Mid-Atlantic Banks | |
| MarketCap: 971.259 Millions | |
| Recent Price: 27.78 Smart Investing & Trading Score: 67 | |
| Day Percent Change: 2.70% Day Change: 0.73 | |
| Week Change: 1.87% Year-to-date Change: -11.3% | |
| SBSI Links: Profile News Message Board | |
| Charts:- Daily , Weekly | |
| Add SBSI to Watchlist: View: Get Complete SBSI Trend Analysis ➞ | |
 | LGND Ligand Pharmaceuticals Incorporated |
| Sector: Health Care | |
| SubSector: Biotechnology | |
| MarketCap: 1344.45 Millions | |
| Recent Price: 71.89 Smart Investing & Trading Score: 37 | |
| Day Percent Change: 0.66% Day Change: 0.47 | |
| Week Change: 1.87% Year-to-date Change: 0.7% | |
| LGND Links: Profile News Message Board | |
| Charts:- Daily , Weekly | |
| Add LGND to Watchlist: View: Get Complete LGND Trend Analysis ➞ | |
 | PECO Phillips Edison & Company, Inc. |
| Sector: Financials | |
| SubSector: REIT - Retail | |
| MarketCap: 3920 Millions | |
| Recent Price: 33.22 Smart Investing & Trading Score: 57 | |
| Day Percent Change: 1.78% Day Change: 0.58 | |
| Week Change: 1.87% Year-to-date Change: -9.8% | |
| PECO Links: Profile News Message Board | |
| Charts:- Daily , Weekly | |
| Add PECO to Watchlist: View: Get Complete PECO Trend Analysis ➞ | |
 | SLVM Sylvamo Corporation |
| Sector: Materials | |
| SubSector: Paper & Paper Products | |
| MarketCap: 1710 Millions | |
| Recent Price: 64.23 Smart Investing & Trading Score: 100 | |
| Day Percent Change: 1.98% Day Change: 1.25 | |
| Week Change: 1.86% Year-to-date Change: 30.8% | |
| SLVM Links: Profile News Message Board | |
| Charts:- Daily , Weekly | |
| Add SLVM to Watchlist: View: Get Complete SLVM Trend Analysis ➞ | |
 | AIT Applied Industrial Technologies, Inc. |
| Sector: Services & Goods | |
| SubSector: Industrial Equipment Wholesale | |
| MarketCap: 1531.58 Millions | |
| Recent Price: 184.24 Smart Investing & Trading Score: 17 | |
| Day Percent Change: 2.00% Day Change: 3.61 | |
| Week Change: 1.85% Year-to-date Change: 6.7% | |
| AIT Links: Profile News Message Board | |
| Charts:- Daily , Weekly | |
| Add AIT to Watchlist: View: Get Complete AIT Trend Analysis ➞ | |
 | VRA Vera Bradley, Inc. |
| Sector: Consumer Staples | |
| SubSector: Textile - Apparel Footwear & Accessories | |
| MarketCap: 151.17 Millions | |
| Recent Price: 6.87 Smart Investing & Trading Score: 57 | |
| Day Percent Change: 4.09% Day Change: 0.27 | |
| Week Change: 1.85% Year-to-date Change: -10.8% | |
| VRA Links: Profile News Message Board | |
| Charts:- Daily , Weekly | |
| Add VRA to Watchlist: View: Get Complete VRA Trend Analysis ➞ | |
 | FRPH FRP Holdings, Inc. |
| Sector: Financials | |
| SubSector: Property Management | |
| MarketCap: 374.442 Millions | |
| Recent Price: 30.99 Smart Investing & Trading Score: 25 | |
| Day Percent Change: 1.27% Day Change: 0.39 | |
| Week Change: 1.84% Year-to-date Change: -50.7% | |
| FRPH Links: Profile News Message Board | |
| Charts:- Daily , Weekly | |
| Add FRPH to Watchlist: View: Get Complete FRPH Trend Analysis ➞ | |
 | TBBK The Bancorp, Inc. |
| Sector: Financials | |
| SubSector: Regional - Mid-Atlantic Banks | |
| MarketCap: 267.859 Millions | |
| Recent Price: 31.36 Smart Investing & Trading Score: 25 | |
| Day Percent Change: 0.29% Day Change: 0.09 | |
| Week Change: 1.82% Year-to-date Change: -18.7% | |
| TBBK Links: Profile News Message Board | |
| Charts:- Daily , Weekly | |
| Add TBBK to Watchlist: View: Get Complete TBBK Trend Analysis ➞ | |
 | BLX Banco Latinoamericano de Comercio Exterior, S.A |
| Sector: Financials | |
| SubSector: Foreign Money Center Banks | |
| MarketCap: 390.471 Millions | |
| Recent Price: 30.11 Smart Investing & Trading Score: 78 | |
| Day Percent Change: 3.42% Day Change: 0.99 | |
| Week Change: 1.81% Year-to-date Change: 21.7% | |
| BLX Links: Profile News Message Board | |
| Charts:- Daily , Weekly | |
| Add BLX to Watchlist: View: Get Complete BLX Trend Analysis ➞ | |
 | NWFL Norwood Financial Corp. |
| Sector: Financials | |
| SubSector: Regional - Northeast Banks | |
| MarketCap: 201.899 Millions | |
| Recent Price: 24.81 Smart Investing & Trading Score: 57 | |
| Day Percent Change: 0.53% Day Change: 0.13 | |
| Week Change: 1.81% Year-to-date Change: -24.6% | |
| NWFL Links: Profile News Message Board | |
| Charts:- Daily , Weekly | |
| Add NWFL to Watchlist: View: Get Complete NWFL Trend Analysis ➞ | |
 | DCO Ducommun Incorporated |
| Sector: Industrials | |
| SubSector: Aerospace/Defense Products & Services | |
| MarketCap: 261.101 Millions | |
| Recent Price: 54.91 Smart Investing & Trading Score: 93 | |
| Day Percent Change: 1.03% Day Change: 0.56 | |
| Week Change: 1.8% Year-to-date Change: 5.5% | |
| DCO Links: Profile News Message Board | |
| Charts:- Daily , Weekly | |
| Add DCO to Watchlist: View: Get Complete DCO Trend Analysis ➞ | |
 | EPC Edgewell Personal Care Company |
| Sector: Consumer Staples | |
| SubSector: Personal Products | |
| MarketCap: 1605.95 Millions | |
| Recent Price: 38.10 Smart Investing & Trading Score: 87 | |
| Day Percent Change: 1.53% Day Change: 0.57 | |
| Week Change: 1.8% Year-to-date Change: 4.0% | |
| EPC Links: Profile News Message Board | |
| Charts:- Daily , Weekly | |
| Add EPC to Watchlist: View: Get Complete EPC Trend Analysis ➞ | |
 | RYAM Rayonier Advanced Materials Inc. |
| Sector: Materials | |
| SubSector: Chemicals - Major Diversified | |
| MarketCap: 116.736 Millions | |
| Recent Price: 3.96 Smart Investing & Trading Score: 53 | |
| Day Percent Change: 2.86% Day Change: 0.11 | |
| Week Change: 1.8% Year-to-date Change: -2.2% | |
| RYAM Links: Profile News Message Board | |
| Charts:- Daily , Weekly | |
| Add RYAM to Watchlist: View: Get Complete RYAM Trend Analysis ➞ | |
 | OABI OmniAb, Inc. |
| Sector: Health Care | |
| SubSector: Biotechnology | |
| MarketCap: 570 Millions | |
| Recent Price: 4.55 Smart Investing & Trading Score: 27 | |
| Day Percent Change: 0.22% Day Change: 0.01 | |
| Week Change: 1.79% Year-to-date Change: -24.9% | |
| OABI Links: Profile News Message Board | |
| Charts:- Daily , Weekly | |
| Add OABI to Watchlist: View: Get Complete OABI Trend Analysis ➞ | |
 | LANC Lancaster Colony Corporation |
| Sector: Consumer Staples | |
| SubSector: Food - Major Diversified | |
| MarketCap: 4060.83 Millions | |
| Recent Price: 190.36 Smart Investing & Trading Score: 32 | |
| Day Percent Change: -0.56% Day Change: -1.07 | |
| Week Change: 1.78% Year-to-date Change: 14.4% | |
| LANC Links: Profile News Message Board | |
| Charts:- Daily , Weekly | |
| Add LANC to Watchlist: View: Get Complete LANC Trend Analysis ➞ | |
 | UTI Universal Technical Institute, Inc. |
| Sector: Services & Goods | |
| SubSector: Education & Training Services | |
| MarketCap: 163.506 Millions | |
| Recent Price: 15.47 Smart Investing & Trading Score: 83 | |
| Day Percent Change: 1.18% Day Change: 0.18 | |
| Week Change: 1.78% Year-to-date Change: 23.6% | |
| UTI Links: Profile News Message Board | |
| Charts:- Daily , Weekly | |
| Add UTI to Watchlist: View: Get Complete UTI Trend Analysis ➞ | |
 | NBTB NBT Bancorp Inc. |
| Sector: Financials | |
| SubSector: Regional - Northeast Banks | |
| MarketCap: 1451.89 Millions | |
| Recent Price: 36.61 Smart Investing & Trading Score: 100 | |
| Day Percent Change: 1.10% Day Change: 0.40 | |
| Week Change: 1.78% Year-to-date Change: -12.7% | |
| NBTB Links: Profile News Message Board | |
| Charts:- Daily , Weekly | |
| Add NBTB to Watchlist: View: Get Complete NBTB Trend Analysis ➞ | |
 | SGMO Sangamo Therapeutics, Inc. |
| Sector: Health Care | |
| SubSector: Biotechnology | |
| MarketCap: 779.285 Millions | |
| Recent Price: 0.53 Smart Investing & Trading Score: 39 | |
| Day Percent Change: -3.09% Day Change: -0.02 | |
| Week Change: 1.78% Year-to-date Change: -3.0% | |
| SGMO Links: Profile News Message Board | |
| Charts:- Daily , Weekly | |
| Add SGMO to Watchlist: View: Get Complete SGMO Trend Analysis ➞ | |
 | RMAX RE/MAX Holdings, Inc. |
| Sector: Financials | |
| SubSector: Property Management | |
| MarketCap: 334.742 Millions | |
| Recent Price: 7.18 Smart Investing & Trading Score: 52 | |
| Day Percent Change: -0.21% Day Change: -0.02 | |
| Week Change: 1.77% Year-to-date Change: -46.1% | |
| RMAX Links: Profile News Message Board | |
| Charts:- Daily , Weekly | |
| Add RMAX to Watchlist: View: Get Complete RMAX Trend Analysis ➞ | |
| Too many stocks? View smallcap stocks filtered by marketcap & sector |
| Marketcap: All SmallCap Stocks (default-no microcap), Large, Mid-Range, Small & MicroCap |
| Sector: Tech, Finance, Energy, Staples, Retail, Industrial, Materials, Utilities & Medical |
|
Best Stocks Today 12Stocks.com |
© 2024 12Stocks.com Terms & Conditions Privacy Contact Us
All Information Provided Only For Education And Not To Be Used For Investing or Trading. See Terms & Conditions


One More Thing ... Get Best Stocks Delivered Daily!
Never Ever Miss A Move With Our Top Ten Stocks Lists
Find Best Stocks In Any Market - Bull or Bear Market
Take A Peek At Our Top Ten Stocks Lists: Daily, Weekly, Year-to-Date & Top Trends
Find Best Stocks In Any Market - Bull or Bear Market
Take A Peek At Our Top Ten Stocks Lists: Daily, Weekly, Year-to-Date & Top Trends
Smallcap Stocks With Best Up Trends [0-bearish to 100-bullish]: Emergent BioSolutions[100], Aspen Aerogels[100], Perdoceo Education[100], Gannett Co[100], Pitney Bowes[100], Origin Materials[100], Benchmark Electronics[100], Blueprint Medicines[100], FormFactor [100], Lantheus [100], Tronox [100]
Best Smallcap Stocks Year-to-Date:
Janux [440.16%], Viking [306.07%], Longboard [258.92%], Alpine Immune[239.44%], Bakkt [187.89%], Avidity Biosciences[184.07%], Arcutis Bio[171.83%], Vera [170.74%], Cullinan Oncology[169.74%], Super Micro[159.59%], Y-mAbs [153.08%] Best Smallcap Stocks This Week:
Deciphera [73.24%], Emergent BioSolutions[69.53%], Aspen Aerogels[47.24%], Eyenovia [45.27%], P3 Health[38.51%], Carvana Co[37.82%], Origin Materials[36.24%], Poseida [34.98%], Cue Biopharma[34.07%], Surmodics [33.44%], TransMedics Group[33.23%] Best Smallcap Stocks Daily:
Emergent BioSolutions[68.65%], Aspen Aerogels[55.75%], Carvana Co[33.42%], Enovix [31.06%], Perdoceo Education[28.82%], Office Properties[28.50%], Gannett Co[26.14%], Pitney Bowes[23.99%], Sunnova Energy[23.23%], Pulmonx [20.21%], CommScope Holding[19.80%]