
 Login Sign Up


| |||||
 |  | ||||

| 12Stocks.com Market Intelligence |
Best SmallCap Stocks
|
| In a hurry? Small Cap Stock Lists: Performance Trends Table, Stock Charts
Sort Small Cap stocks: Daily, Weekly, Year-to-Date, Market Cap & Trends. Filter Small Cap stocks list by sector: Show all, Tech, Finance, Energy, Staples, Retail, Industrial, Materials, Utilities and HealthCare Filter Small Cap stocks list by size: All Large Medium Small and MicroCap |
| 12Stocks.com Small Cap Stocks Performances & Trends Daily | |||||||||
|
|  The overall Smart Investing & Trading Score is 69 (0-bearish to 100-bullish) which puts Small Cap index in short term neutral to bullish trend. The Smart Investing & Trading Score from previous trading session is 49 and hence an improvement of trend.
| ||||||||
Here are the Smart Investing & Trading Scores of the most requested small cap stocks at 12Stocks.com (click stock name for detailed review):
|


| 12Stocks.com: Investing in Smallcap Index with Stocks | |
|
The following table helps investors and traders sort through current performance and trends (as measured by Smart Investing & Trading Score) of various
stocks in the Smallcap Index. Quick View: Move mouse or cursor over stock symbol (ticker) to view short-term technical chart and over stock name to view long term chart. Click on  to add stock symbol to your watchlist and to add stock symbol to your watchlist and  to view watchlist. Click on any ticker or stock name for detailed market intelligence report for that stock. to view watchlist. Click on any ticker or stock name for detailed market intelligence report for that stock. |
12Stocks.com Performance of Stocks in Smallcap Index
| Ticker | Stock Name | Watchlist | Category | Recent Price | Smart Investing & Trading Score | Change % | Weekly Change% |
| COMM | CommScope Holding |   | Technology | 0.99 | 59 | -5.52% | 5.99% |
| FCBC | First Community | | Financials | 35.51 | 100 | 1.63% | 5.97% |
| FNKO | Funko | | Consumer Staples | 6.57 | 74 | 2.34% | 5.97% |
| ORGO | Organogenesis | | Health Care | 2.49 | 42 | 0.00% | 5.96% |
| CMRE | Costamare | | Transports | 12.48 | 95 | 0.97% | 5.94% |
| XHR | Xenia Hotels | | Financials | 14.97 | 74 | 7.01% | 5.94% |
| KRMD | Repro Med | | Health Care | 2.32 | 90 | -2.52% | 5.94% |
| LFST | LifeStance Health | | Health Care | 6.57 | 64 | 2.18% | 5.89% |
| MCY | Mercury General | | Financials | 54.70 | 93 | -1.37% | 5.88% |
| ALDX | Aldeyra | | Health Care | 4.16 | 73 | -1.19% | 5.85% |
| HELE | Helen of Troy | | Consumer Staples | 96.54 | 42 | 1.66% | 5.84% |
| BKU | BankUnited | | Financials | 28.85 | 100 | 0.28% | 5.83% |
| IBOC | Bancshares | | Financials | 59.42 | 100 | 1.78% | 5.82% |
| ONTO | Onto Innovation | | Technology | 200.80 | 95 | 2.60% | 5.81% |
| RDW | Redwire | | Industrials | 4.19 | 95 | 3.46% | 5.81% |
| BDC | Belden | | Industrials | 88.23 | 100 | -0.76% | 5.79% |
| PRTS | U.S. Auto | | Consumer Staples | 1.28 | 52 | 0.00% | 5.79% |
| RDNT | RadNet | | Health Care | 51.20 | 100 | -0.89% | 5.79% |
| PJT | PJT Partners | | Financials | 99.53 | 57 | 1.09% | 5.78% |
| DLX | Deluxe | | Services & Goods | 21.52 | 100 | -0.23% | 5.75% |
| NFBK | Northfield Bancorp | | Financials | 9.01 | 74 | 1.58% | 5.75% |
| STHO | Star | | Financials | 12.39 | 87 | 0.36% | 5.72% |
| OCN | Ocwen Financial | | Financials | 25.72 | 74 | 0.82% | 5.71% |
| PANL | Pangaea Logistics | | Transports | 7.40 | 59 | 0.54% | 5.71% |
| HFWA | Heritage Financial | | Financials | 18.89 | 93 | 0.27% | 5.71% |


| Too many stocks? View smallcap stocks filtered by marketcap & sector |
| Marketcap: All SmallCap Stocks (default-no microcap), Large, Mid-Range, Small |
| Smallcap Sector: Tech, Finance, Energy, Staples, Retail, Industrial, Materials, & Medical |
|
Get the most comprehensive stock market coverage daily at 12Stocks.com ➞ Best Stocks Today ➞ Best Stocks Weekly ➞ Best Stocks Year-to-Date ➞ Best Stocks Trends ➞  Best Stocks Today 12Stocks.com Best Nasdaq Stocks ➞ Best S&P 500 Stocks ➞ Best Tech Stocks ➞ Best Biotech Stocks ➞ |
| Detailed Overview of SmallCap Stocks |
| SmallCap Technical Overview, Leaders & Laggards, Top SmallCap ETF Funds & Detailed SmallCap Stocks List, Charts, Trends & More |
| Smallcap: Technical Analysis, Trends & YTD Performance | |
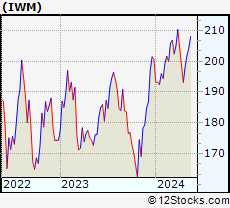
| SmallCap segment as represented by
IWM, an exchange-traded fund [ETF], holds basket of thousands of smallcap stocks from across all major sectors of the US stock market. The smallcap index (contains stocks like Riverbed & Sotheby's) is up by 0.59% and is currently underperforming the overall market by -6.29% year-to-date. Below is a quick view of technical charts and trends: | |
 IWM Weekly Chart |
|
| Long Term Trend: Not Good | |
| Medium Term Trend: Very Good | |
 IWM Daily Chart |
|
| Short Term Trend: Very Good | |
| Overall Trend Score: 69 | |
| YTD Performance: 0.59% | |
| **Trend Scores & Views Are Only For Educational Purposes And Not For Investing | |
| 12Stocks.com: Top Performing Small Cap Index Stocks | ||||||||||||||||||||||||||||||||||||||||||||||||
 The top performing Small Cap Index stocks year to date are
Now, more recently, over last week, the top performing Small Cap Index stocks on the move are


|
||||||||||||||||||||||||||||||||||||||||||||||||
| 12Stocks.com: Investing in Smallcap Index using Exchange Traded Funds | |
|
The following table shows list of key exchange traded funds (ETF) that
help investors track Smallcap index. The following list also includes leveraged ETF funds that track twice or thrice the daily returns of Smallcap indices. Short or inverse ETF funds move in the opposite direction to the index they track and are useful during market pullbacks or during bear markets. Quick View: Move mouse or cursor over ETF symbol (ticker) to view short-term technical chart and over ETF name to view long term chart. Click on ticker or stock name for detailed view. Click on to add stock symbol to your watchlist and to view watchlist. |
12Stocks.com List of ETFs that track Smallcap Index
| Ticker | ETF Name | Watchlist | Recent Price | Smart Investing & Trading Score | Change % | Week % | Year-to-date % |
| IWM | iShares Russell 2000 | | 201.90 | 69 | 0.99 | 1.77 | 0.59% |
| IJR | iShares Core S&P Small-Cap | | 107.13 | 82 | 0.75 | 1.4 | -1.03% |
| VTWO | Vanguard Russell 2000 ETF | | 81.61 | 69 | 0.94 | 1.73 | 0.63% |
| IWN | iShares Russell 2000 Value | | 154.21 | 100 | 0.87 | 2.03 | -0.72% |
| IJS | iShares S&P Small-Cap 600 Value | | 98.72 | 64 | 0.71 | 1.57 | -4.22% |
| IWO | iShares Russell 2000 Growth | | 256.87 | 57 | 0.99 | 1.49 | 1.84% |
| IJT | iShares S&P Small-Cap 600 Growth | | 127.76 | 95 | 0.82 | 1.32 | 2.09% |
| XSLV | PowerShares S&P SmallCap Low Volatil ETF | | 43.22 | 87 | 0.19 | 1.17 | -2.11% |
| SBB | ProShares Short SmallCap600 | | 16.16 | 13 | -1.28 | -1.37 | 1.44% |
| SDD | ProShares UltraShort SmallCap600 | | 18.84 | 23 | -2.41 | -2.61 | 2.27% |
| SAA | ProShares Ultra SmallCap600 | | 23.59 | 69 | 2.86 | 2.39 | -5.45% |
| SMLV | SPDR SSGA US Small Cap Low Volatil ETF | | 109.69 | 87 | 0.78 | 2.01 | -2.52% |
| 12Stocks.com: Charts, Trends, Fundamental Data and Performances of SmallCap Stocks | |
|
We now take in-depth look at all SmallCap stocks including charts, multi-period performances and overall trends (as measured by Smart Investing & Trading Score). One can sort SmallCap stocks (click link to choose) by Daily, Weekly and by Year-to-Date performances. Also, one can sort by size of the company or by market capitalization. |
| Select Your Default Chart Type: | |||||
| |||||
| Click on stock symbol or name for detailed view. Click on to add stock symbol to your watchlist and to view watchlist. Quick View: Move mouse or cursor over "Daily" to quickly view daily technical stock chart and over "Weekly" to view weekly technical stock chart. | |||||

 | COMM CommScope Holding Company, Inc. |
| Sector: Technology | |
| SubSector: Communication Equipment | |
| MarketCap: 1614.29 Millions | |
| Recent Price: 0.99 Smart Investing & Trading Score: 59 | |
| Day Percent Change: -5.52% Day Change: -0.06 | |
| Week Change: 5.99% Year-to-date Change: -64.8% | |
| COMM Links: Profile News Message Board | |
| Charts:- Daily , Weekly | |
| Add COMM to Watchlist: View: Get Complete COMM Trend Analysis ➞ | |
 | FCBC First Community Bankshares, Inc. |
| Sector: Financials | |
| SubSector: Regional - Mid-Atlantic Banks | |
| MarketCap: 393.459 Millions | |
| Recent Price: 35.51 Smart Investing & Trading Score: 100 | |
| Day Percent Change: 1.63% Day Change: 0.57 | |
| Week Change: 5.97% Year-to-date Change: -4.3% | |
| FCBC Links: Profile News Message Board | |
| Charts:- Daily , Weekly | |
| Add FCBC to Watchlist: View: Get Complete FCBC Trend Analysis ➞ | |
 | FNKO Funko, Inc. |
| Sector: Consumer Staples | |
| SubSector: Toys & Games | |
| MarketCap: 246.38 Millions | |
| Recent Price: 6.57 Smart Investing & Trading Score: 74 | |
| Day Percent Change: 2.34% Day Change: 0.15 | |
| Week Change: 5.97% Year-to-date Change: -15.0% | |
| FNKO Links: Profile News Message Board | |
| Charts:- Daily , Weekly | |
| Add FNKO to Watchlist: View: Get Complete FNKO Trend Analysis ➞ | |
 | ORGO Organogenesis Holdings Inc. |
| Sector: Health Care | |
| SubSector: Drugs - Generic | |
| MarketCap: 239.685 Millions | |
| Recent Price: 2.49 Smart Investing & Trading Score: 42 | |
| Day Percent Change: 0.00% Day Change: 0.00 | |
| Week Change: 5.96% Year-to-date Change: -39.1% | |
| ORGO Links: Profile News Message Board | |
| Charts:- Daily , Weekly | |
| Add ORGO to Watchlist: View: Get Complete ORGO Trend Analysis ➞ | |
 | CMRE Costamare Inc. |
| Sector: Transports | |
| SubSector: Shipping | |
| MarketCap: 492.214 Millions | |
| Recent Price: 12.48 Smart Investing & Trading Score: 95 | |
| Day Percent Change: 0.97% Day Change: 0.12 | |
| Week Change: 5.94% Year-to-date Change: 19.9% | |
| CMRE Links: Profile News Message Board | |
| Charts:- Daily , Weekly | |
| Add CMRE to Watchlist: View: Get Complete CMRE Trend Analysis ➞ | |
 | XHR Xenia Hotels & Resorts, Inc. |
| Sector: Financials | |
| SubSector: REIT - Hotel/Motel | |
| MarketCap: 1058.24 Millions | |
| Recent Price: 14.97 Smart Investing & Trading Score: 74 | |
| Day Percent Change: 7.01% Day Change: 0.98 | |
| Week Change: 5.94% Year-to-date Change: 9.9% | |
| XHR Links: Profile News Message Board | |
| Charts:- Daily , Weekly | |
| Add XHR to Watchlist: View: Get Complete XHR Trend Analysis ➞ | |
 | KRMD Repro Med Systems, Inc. |
| Sector: Health Care | |
| SubSector: Medical Instruments & Supplies | |
| MarketCap: 340.06 Millions | |
| Recent Price: 2.32 Smart Investing & Trading Score: 90 | |
| Day Percent Change: -2.52% Day Change: -0.06 | |
| Week Change: 5.94% Year-to-date Change: -5.5% | |
| KRMD Links: Profile News Message Board | |
| Charts:- Daily , Weekly | |
| Add KRMD to Watchlist: View: Get Complete KRMD Trend Analysis ➞ | |
 | LFST LifeStance Health Group, Inc. |
| Sector: Health Care | |
| SubSector: Medical Care Facilities | |
| MarketCap: 3460 Millions | |
| Recent Price: 6.57 Smart Investing & Trading Score: 64 | |
| Day Percent Change: 2.18% Day Change: 0.14 | |
| Week Change: 5.89% Year-to-date Change: -17.1% | |
| LFST Links: Profile News Message Board | |
| Charts:- Daily , Weekly | |
| Add LFST to Watchlist: View: Get Complete LFST Trend Analysis ➞ | |
 | MCY Mercury General Corporation |
| Sector: Financials | |
| SubSector: Property & Casualty Insurance | |
| MarketCap: 2122.12 Millions | |
| Recent Price: 54.70 Smart Investing & Trading Score: 93 | |
| Day Percent Change: -1.37% Day Change: -0.76 | |
| Week Change: 5.88% Year-to-date Change: 46.6% | |
| MCY Links: Profile News Message Board | |
| Charts:- Daily , Weekly | |
| Add MCY to Watchlist: View: Get Complete MCY Trend Analysis ➞ | |
 | ALDX Aldeyra Therapeutics, Inc. |
| Sector: Health Care | |
| SubSector: Biotechnology | |
| MarketCap: 61.2785 Millions | |
| Recent Price: 4.16 Smart Investing & Trading Score: 73 | |
| Day Percent Change: -1.19% Day Change: -0.05 | |
| Week Change: 5.85% Year-to-date Change: 18.5% | |
| ALDX Links: Profile News Message Board | |
| Charts:- Daily , Weekly | |
| Add ALDX to Watchlist: View: Get Complete ALDX Trend Analysis ➞ | |
 | HELE Helen of Troy Limited |
| Sector: Consumer Staples | |
| SubSector: Housewares & Accessories | |
| MarketCap: 3199.53 Millions | |
| Recent Price: 96.54 Smart Investing & Trading Score: 42 | |
| Day Percent Change: 1.66% Day Change: 1.58 | |
| Week Change: 5.84% Year-to-date Change: -20.1% | |
| HELE Links: Profile News Message Board | |
| Charts:- Daily , Weekly | |
| Add HELE to Watchlist: View: Get Complete HELE Trend Analysis ➞ | |
 | BKU BankUnited, Inc. |
| Sector: Financials | |
| SubSector: Regional - Mid-Atlantic Banks | |
| MarketCap: 1905.99 Millions | |
| Recent Price: 28.85 Smart Investing & Trading Score: 100 | |
| Day Percent Change: 0.28% Day Change: 0.08 | |
| Week Change: 5.83% Year-to-date Change: -11.0% | |
| BKU Links: Profile News Message Board | |
| Charts:- Daily , Weekly | |
| Add BKU to Watchlist: View: Get Complete BKU Trend Analysis ➞ | |
 | IBOC International Bancshares Corporation |
| Sector: Financials | |
| SubSector: Regional - Southwest Banks | |
| MarketCap: 1159.45 Millions | |
| Recent Price: 59.42 Smart Investing & Trading Score: 100 | |
| Day Percent Change: 1.78% Day Change: 1.04 | |
| Week Change: 5.82% Year-to-date Change: 9.4% | |
| IBOC Links: Profile News Message Board | |
| Charts:- Daily , Weekly | |
| Add IBOC to Watchlist: View: Get Complete IBOC Trend Analysis ➞ | |
 | ONTO Onto Innovation Inc. |
| Sector: Technology | |
| SubSector: Semiconductor Equipment & Materials | |
| MarketCap: 1187.18 Millions | |
| Recent Price: 200.80 Smart Investing & Trading Score: 95 | |
| Day Percent Change: 2.60% Day Change: 5.09 | |
| Week Change: 5.81% Year-to-date Change: 31.3% | |
| ONTO Links: Profile News Message Board | |
| Charts:- Daily , Weekly | |
| Add ONTO to Watchlist: View: Get Complete ONTO Trend Analysis ➞ | |
 | RDW Redwire Corporation |
| Sector: Industrials | |
| SubSector: Aerospace & Defense | |
| MarketCap: 160 Millions | |
| Recent Price: 4.19 Smart Investing & Trading Score: 95 | |
| Day Percent Change: 3.46% Day Change: 0.14 | |
| Week Change: 5.81% Year-to-date Change: 47.0% | |
| RDW Links: Profile News Message Board | |
| Charts:- Daily , Weekly | |
| Add RDW to Watchlist: View: Get Complete RDW Trend Analysis ➞ | |
 | BDC Belden Inc. |
| Sector: Industrials | |
| SubSector: Industrial Electrical Equipment | |
| MarketCap: 1490.59 Millions | |
| Recent Price: 88.23 Smart Investing & Trading Score: 100 | |
| Day Percent Change: -0.76% Day Change: -0.68 | |
| Week Change: 5.79% Year-to-date Change: 14.2% | |
| BDC Links: Profile News Message Board | |
| Charts:- Daily , Weekly | |
| Add BDC to Watchlist: View: Get Complete BDC Trend Analysis ➞ | |
 | PRTS U.S. Auto Parts Network, Inc. |
| Sector: Consumer Staples | |
| SubSector: Auto Parts | |
| MarketCap: 65.0939 Millions | |
| Recent Price: 1.28 Smart Investing & Trading Score: 52 | |
| Day Percent Change: 0.00% Day Change: 0.00 | |
| Week Change: 5.79% Year-to-date Change: -59.5% | |
| PRTS Links: Profile News Message Board | |
| Charts:- Daily , Weekly | |
| Add PRTS to Watchlist: View: Get Complete PRTS Trend Analysis ➞ | |
 | RDNT RadNet, Inc. |
| Sector: Health Care | |
| SubSector: Medical Laboratories & Research | |
| MarketCap: 473.2 Millions | |
| Recent Price: 51.20 Smart Investing & Trading Score: 100 | |
| Day Percent Change: -0.89% Day Change: -0.46 | |
| Week Change: 5.79% Year-to-date Change: 47.3% | |
| RDNT Links: Profile News Message Board | |
| Charts:- Daily , Weekly | |
| Add RDNT to Watchlist: View: Get Complete RDNT Trend Analysis ➞ | |
 | PJT PJT Partners Inc. |
| Sector: Financials | |
| SubSector: Asset Management | |
| MarketCap: 1100.93 Millions | |
| Recent Price: 99.53 Smart Investing & Trading Score: 57 | |
| Day Percent Change: 1.09% Day Change: 1.07 | |
| Week Change: 5.78% Year-to-date Change: -2.3% | |
| PJT Links: Profile News Message Board | |
| Charts:- Daily , Weekly | |
| Add PJT to Watchlist: View: Get Complete PJT Trend Analysis ➞ | |
 | DLX Deluxe Corporation |
| Sector: Services & Goods | |
| SubSector: Business Services | |
| MarketCap: 1025.82 Millions | |
| Recent Price: 21.52 Smart Investing & Trading Score: 100 | |
| Day Percent Change: -0.23% Day Change: -0.05 | |
| Week Change: 5.75% Year-to-date Change: 0.3% | |
| DLX Links: Profile News Message Board | |
| Charts:- Daily , Weekly | |
| Add DLX to Watchlist: View: Get Complete DLX Trend Analysis ➞ | |
 | NFBK Northfield Bancorp, Inc. (Staten Island, NY) |
| Sector: Financials | |
| SubSector: Regional - Northeast Banks | |
| MarketCap: 540.699 Millions | |
| Recent Price: 9.01 Smart Investing & Trading Score: 74 | |
| Day Percent Change: 1.58% Day Change: 0.14 | |
| Week Change: 5.75% Year-to-date Change: -28.4% | |
| NFBK Links: Profile News Message Board | |
| Charts:- Daily , Weekly | |
| Add NFBK to Watchlist: View: Get Complete NFBK Trend Analysis ➞ | |
 | STHO Star Holdings |
| Sector: Financials | |
| SubSector: Financials Services | |
| MarketCap: 195 Millions | |
| Recent Price: 12.39 Smart Investing & Trading Score: 87 | |
| Day Percent Change: 0.36% Day Change: 0.04 | |
| Week Change: 5.72% Year-to-date Change: -17.4% | |
| STHO Links: Profile News Message Board | |
| Charts:- Daily , Weekly | |
| Add STHO to Watchlist: View: Get Complete STHO Trend Analysis ➞ | |
 | OCN Ocwen Financial Corporation |
| Sector: Financials | |
| SubSector: Mortgage Investment | |
| MarketCap: 73.7739 Millions | |
| Recent Price: 25.72 Smart Investing & Trading Score: 74 | |
| Day Percent Change: 0.82% Day Change: 0.21 | |
| Week Change: 5.71% Year-to-date Change: -16.4% | |
| OCN Links: Profile News Message Board | |
| Charts:- Daily , Weekly | |
| Add OCN to Watchlist: View: Get Complete OCN Trend Analysis ➞ | |
 | PANL Pangaea Logistics Solutions, Ltd. |
| Sector: Transports | |
| SubSector: Shipping | |
| MarketCap: 80 Millions | |
| Recent Price: 7.40 Smart Investing & Trading Score: 59 | |
| Day Percent Change: 0.54% Day Change: 0.04 | |
| Week Change: 5.71% Year-to-date Change: -10.2% | |
| PANL Links: Profile News Message Board | |
| Charts:- Daily , Weekly | |
| Add PANL to Watchlist: View: Get Complete PANL Trend Analysis ➞ | |
 | HFWA Heritage Financial Corporation |
| Sector: Financials | |
| SubSector: Regional - Pacific Banks | |
| MarketCap: 752.829 Millions | |
| Recent Price: 18.89 Smart Investing & Trading Score: 93 | |
| Day Percent Change: 0.27% Day Change: 0.05 | |
| Week Change: 5.71% Year-to-date Change: -11.7% | |
| HFWA Links: Profile News Message Board | |
| Charts:- Daily , Weekly | |
| Add HFWA to Watchlist: View: Get Complete HFWA Trend Analysis ➞ | |
| Too many stocks? View smallcap stocks filtered by marketcap & sector |
| Marketcap: All SmallCap Stocks (default-no microcap), Large, Mid-Range, Small & MicroCap |
| Sector: Tech, Finance, Energy, Staples, Retail, Industrial, Materials, Utilities & Medical |
|
Best Stocks Today 12Stocks.com |
© 2024 12Stocks.com Terms & Conditions Privacy Contact Us
All Information Provided Only For Education And Not To Be Used For Investing or Trading. See Terms & Conditions


One More Thing ... Get Best Stocks Delivered Daily!
Never Ever Miss A Move With Our Top Ten Stocks Lists
Find Best Stocks In Any Market - Bull or Bear Market
Take A Peek At Our Top Ten Stocks Lists: Daily, Weekly, Year-to-Date & Top Trends
Find Best Stocks In Any Market - Bull or Bear Market
Take A Peek At Our Top Ten Stocks Lists: Daily, Weekly, Year-to-Date & Top Trends
Smallcap Stocks With Best Up Trends [0-bearish to 100-bullish]: Twist Bioscience[100], WideOpenWest [100], Joint [100], FTC Solar[100], Origin Materials[100], Alignment Healthcare[100], Clarus [100], IES [100], Emergent BioSolutions[100], Enovix [100], El Pollo[100]
Best Smallcap Stocks Year-to-Date:
Janux [482.74%], Viking [313.59%], Longboard [272.5%], Alpine Immune[239.29%], Bakkt [199.55%], Avidity Biosciences[192.48%], Vera [189.47%], Cullinan Oncology[176.9%], Super Micro[175.35%], Y-mAbs [151.47%], Sana [149.33%] Best Smallcap Stocks This Week:
Emergent BioSolutions[102.6%], Deciphera [73.24%], Origin Materials[66.52%], Eyenovia [60.78%], Cue Biopharma[56.04%], Aspen Aerogels[55.96%], Enovix [54.02%], Luna Innovations[53.77%], Codexis [47.37%], Carvana Co[44.31%], Office Properties[42.79%] Best Smallcap Stocks Daily:
Luna Innovations[36.00%], Twist Bioscience[28.74%], Ardelyx [28.42%], WideOpenWest [28.23%], 2U [26.63%], Joint [25.35%], FTC Solar[25.09%], Origin Materials[22.23%], Alignment Healthcare[21.97%], Clarus [18.67%], Aurora Innovation[18.09%]