
 Login Sign Up


| |||||
 |  | ||||

| 12Stocks.com Market Intelligence |
Best SmallCap Stocks
|
| In a hurry? Small Cap Stock Lists: Performance Trends Table, Stock Charts
Sort Small Cap stocks: Daily, Weekly, Year-to-Date, Market Cap & Trends. Filter Small Cap stocks list by sector: Show all, Tech, Finance, Energy, Staples, Retail, Industrial, Materials, Utilities and HealthCare Filter Small Cap stocks list by size: All Large Medium Small and MicroCap |
| 12Stocks.com Small Cap Stocks Performances & Trends Daily | |||||||||
|
|  The overall Smart Investing & Trading Score is 24 (0-bearish to 100-bullish) which puts Small Cap index in short term bearish to neutral trend. The Smart Investing & Trading Score from previous trading session is 14 and hence an improvement of trend.
| ||||||||
Here are the Smart Investing & Trading Scores of the most requested small cap stocks at 12Stocks.com (click stock name for detailed review):
|


| 12Stocks.com: Investing in Smallcap Index with Stocks | |
|
The following table helps investors and traders sort through current performance and trends (as measured by Smart Investing & Trading Score) of various
stocks in the Smallcap Index. Quick View: Move mouse or cursor over stock symbol (ticker) to view short-term technical chart and over stock name to view long term chart. Click on  to add stock symbol to your watchlist and to add stock symbol to your watchlist and  to view watchlist. Click on any ticker or stock name for detailed market intelligence report for that stock. to view watchlist. Click on any ticker or stock name for detailed market intelligence report for that stock. |
12Stocks.com Performance of Stocks in Smallcap Index
| Ticker | Stock Name | Watchlist | Category | Recent Price | Smart Investing & Trading Score | Change % | Weekly Change% |
| BLUE | bluebird bio |   | Health Care | 0.90 | 22 | -0.59% | -2.05% |
| JOE | St. Joe | | Financials | 57.33 | 51 | 0.64% | -2.06% |
| HAYN | Haynes | | Industrials | 59.06 | 51 | -2.10% | -2.06% |
| SHO | Sunstone Hotel | | Financials | 10.09 | 18 | -1.42% | -2.09% |
| XHR | Xenia Hotels | | Financials | 13.84 | 10 | -0.75% | -2.09% |
| CVGI | Commercial Vehicle | | Services & Goods | 6.05 | 10 | 3.07% | -2.10% |
| LCNB | LCNB | | Financials | 14.92 | 58 | 3.83% | -2.10% |
| TSQ | Townsquare Media | | Services & Goods | 11.98 | 43 | 0.25% | -2.12% |
| DTC | Solo Brands | | Services & Goods | 1.84 | 17 | -0.54% | -2.13% |
| PRLB | Proto Labs | | Industrials | 30.70 | 17 | -0.10% | -2.14% |
| CLDT | Chatham Lodging | | Financials | 9.10 | 0 | -0.33% | -2.15% |
| EXFY | Expensify | | Technology | 1.60 | 30 | -1.85% | -2.15% |
| EXTR | Extreme s | | Technology | 11.35 | 54 | -0.87% | -2.16% |
| SCVL | Shoe Carnival | | Services & Goods | 33.78 | 46 | 1.29% | -2.17% |
| VMEO | Vimeo | | Technology | 3.61 | 25 | -0.69% | -2.17% |
| NX | Quanex Building | | Industrials | 33.07 | 17 | -0.06% | -2.19% |
| NGVC | Natural Grocers | | Services & Goods | 16.51 | 52 | -0.06% | -2.19% |
| POWI | Power Integrations | | Technology | 65.78 | 10 | 0.05% | -2.21% |
| VIGL | Vigil Neuroscience | | Health Care | 2.65 | 27 | 0.19% | -2.21% |
| VVI | Viad Corp | | Services & Goods | 34.35 | 0 | 0.26% | -2.22% |
| upst | Upstart | | Financials | 22.93 | 42 | 0.31% | -2.22% |
| SHAK | Shake Shack | | Services & Goods | 102.54 | 27 | -0.76% | -2.23% |
| INTA | Intapp | | Technology | 31.19 | 37 | 0.21% | -2.23% |
| JBLU | JetBlue Airways | | Transports | 5.65 | 15 | 1.16% | -2.25% |
| RC | Ready Capital | | Financials | 8.65 | 42 | -0.23% | -2.26% |
| For chart view version of above stock list: Chart View ➞ 0 - 25 , 25 - 50 , 50 - 75 , 75 - 100 , 100 - 125 , 125 - 150 , 150 - 175 , 175 - 200 , 200 - 225 , 225 - 250 , 250 - 275 , 275 - 300 , 300 - 325 , 325 - 350 , 350 - 375 , 375 - 400 , 400 - 425 , 425 - 450 , 450 - 475 , 475 - 500 , 500 - 525 , 525 - 550 , 550 - 575 , 575 - 600 , 600 - 625 , 625 - 650 , 650 - 675 , 675 - 700 , 700 - 725 , 725 - 750 , 750 - 775 , 775 - 800 , 800 - 825 , 825 - 850 , 850 - 875 , 875 - 900 , 900 - 925 , 925 - 950 , 950 - 975 , 975 - 1000 , 1000 - 1025 , 1025 - 1050 , 1050 - 1075 , 1075 - 1100 , 1100 - 1125 , 1125 - 1150 , 1150 - 1175 , 1175 - 1200 , 1200 - 1225 , 1225 - 1250 , 1250 - 1275 , 1275 - 1300 , 1300 - 1325 , 1325 - 1350 , 1350 - 1375 , 1375 - 1400 , 1400 - 1425 , 1425 - 1450 , 1450 - 1475 , 1475 - 1500 , 1500 - 1525 , 1525 - 1550 , 1550 - 1575 | ||
 | Click To Change The Sort Order: By Market Cap or Company Size Performance: Year-to-date, Week and Day |  |
| Too many stocks? View smallcap stocks filtered by marketcap & sector |
| Marketcap: All SmallCap Stocks (default-no microcap), Large, Mid-Range, Small |
| Smallcap Sector: Tech, Finance, Energy, Staples, Retail, Industrial, Materials, & Medical |
|
Get the most comprehensive stock market coverage daily at 12Stocks.com ➞ Best Stocks Today ➞ Best Stocks Weekly ➞ Best Stocks Year-to-Date ➞ Best Stocks Trends ➞  Best Stocks Today 12Stocks.com Best Nasdaq Stocks ➞ Best S&P 500 Stocks ➞ Best Tech Stocks ➞ Best Biotech Stocks ➞ |
| Detailed Overview of SmallCap Stocks |
| SmallCap Technical Overview, Leaders & Laggards, Top SmallCap ETF Funds & Detailed SmallCap Stocks List, Charts, Trends & More |
| Smallcap: Technical Analysis, Trends & YTD Performance | |
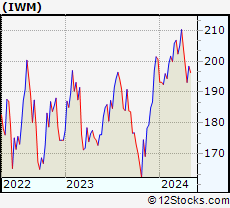
| SmallCap segment as represented by
IWM, an exchange-traded fund [ETF], holds basket of thousands of smallcap stocks from across all major sectors of the US stock market. The smallcap index (contains stocks like Riverbed & Sotheby's) is down by -1.78% and is currently underperforming the overall market by -6.59% year-to-date. Below is a quick view of technical charts and trends: | |
 IWM Weekly Chart |
|
| Long Term Trend: Not Good | |
| Medium Term Trend: Not Good | |
 IWM Daily Chart |
|
| Short Term Trend: Deteriorating | |
| Overall Trend Score: 24 | |
| YTD Performance: -1.78% | |
| **Trend Scores & Views Are Only For Educational Purposes And Not For Investing | |
| 12Stocks.com: Top Performing Small Cap Index Stocks | ||||||||||||||||||||||||||||||||||||||||||||||||
 The top performing Small Cap Index stocks year to date are
Now, more recently, over last week, the top performing Small Cap Index stocks on the move are


|
||||||||||||||||||||||||||||||||||||||||||||||||
| 12Stocks.com: Investing in Smallcap Index using Exchange Traded Funds | |
|
The following table shows list of key exchange traded funds (ETF) that
help investors track Smallcap index. The following list also includes leveraged ETF funds that track twice or thrice the daily returns of Smallcap indices. Short or inverse ETF funds move in the opposite direction to the index they track and are useful during market pullbacks or during bear markets. Quick View: Move mouse or cursor over ETF symbol (ticker) to view short-term technical chart and over ETF name to view long term chart. Click on ticker or stock name for detailed view. Click on to add stock symbol to your watchlist and to view watchlist. |
12Stocks.com List of ETFs that track Smallcap Index
| Ticker | ETF Name | Watchlist | Recent Price | Smart Investing & Trading Score | Change % | Week % | Year-to-date % |
| IWM | iShares Russell 2000 | | 197.13 | 24 | 0.42 | -0.64 | -1.78% |
| 12Stocks.com: Charts, Trends, Fundamental Data and Performances of SmallCap Stocks | |
|
We now take in-depth look at all SmallCap stocks including charts, multi-period performances and overall trends (as measured by Smart Investing & Trading Score). One can sort SmallCap stocks (click link to choose) by Daily, Weekly and by Year-to-Date performances. Also, one can sort by size of the company or by market capitalization. |
| Select Your Default Chart Type: | |||||
| |||||
| Click on stock symbol or name for detailed view. Click on to add stock symbol to your watchlist and to view watchlist. Quick View: Move mouse or cursor over "Daily" to quickly view daily technical stock chart and over "Weekly" to view weekly technical stock chart. | |||||

 | BLUE bluebird bio, Inc. |
| Sector: Health Care | |
| SubSector: Biotechnology | |
| MarketCap: 3365.05 Millions | |
| Recent Price: 0.90 Smart Investing & Trading Score: 22 | |
| Day Percent Change: -0.59% Day Change: -0.01 | |
| Week Change: -2.05% Year-to-date Change: -34.5% | |
| BLUE Links: Profile News Message Board | |
| Charts:- Daily , Weekly | |
| Add BLUE to Watchlist: View: Get Complete BLUE Trend Analysis ➞ | |
 | JOE The St. Joe Company |
| Sector: Financials | |
| SubSector: Real Estate Development | |
| MarketCap: 1029.39 Millions | |
| Recent Price: 57.33 Smart Investing & Trading Score: 51 | |
| Day Percent Change: 0.64% Day Change: 0.37 | |
| Week Change: -2.06% Year-to-date Change: -4.7% | |
| JOE Links: Profile News Message Board | |
| Charts:- Daily , Weekly | |
| Add JOE to Watchlist: View: Get Complete JOE Trend Analysis ➞ | |
 | HAYN Haynes International, Inc. |
| Sector: Industrials | |
| SubSector: Metal Fabrication | |
| MarketCap: 245.75 Millions | |
| Recent Price: 59.06 Smart Investing & Trading Score: 51 | |
| Day Percent Change: -2.10% Day Change: -1.27 | |
| Week Change: -2.06% Year-to-date Change: 3.5% | |
| HAYN Links: Profile News Message Board | |
| Charts:- Daily , Weekly | |
| Add HAYN to Watchlist: View: Get Complete HAYN Trend Analysis ➞ | |
 | SHO Sunstone Hotel Investors, Inc. |
| Sector: Financials | |
| SubSector: REIT - Hotel/Motel | |
| MarketCap: 1861.04 Millions | |
| Recent Price: 10.09 Smart Investing & Trading Score: 18 | |
| Day Percent Change: -1.42% Day Change: -0.14 | |
| Week Change: -2.09% Year-to-date Change: -6.0% | |
| SHO Links: Profile News Message Board | |
| Charts:- Daily , Weekly | |
| Add SHO to Watchlist: View: Get Complete SHO Trend Analysis ➞ | |
 | XHR Xenia Hotels & Resorts, Inc. |
| Sector: Financials | |
| SubSector: REIT - Hotel/Motel | |
| MarketCap: 1058.24 Millions | |
| Recent Price: 13.84 Smart Investing & Trading Score: 10 | |
| Day Percent Change: -0.75% Day Change: -0.10 | |
| Week Change: -2.09% Year-to-date Change: 1.6% | |
| XHR Links: Profile News Message Board | |
| Charts:- Daily , Weekly | |
| Add XHR to Watchlist: View: Get Complete XHR Trend Analysis ➞ | |
 | CVGI Commercial Vehicle Group, Inc. |
| Sector: Services & Goods | |
| SubSector: Auto Parts Wholesale | |
| MarketCap: 56.6 Millions | |
| Recent Price: 6.05 Smart Investing & Trading Score: 10 | |
| Day Percent Change: 3.07% Day Change: 0.18 | |
| Week Change: -2.1% Year-to-date Change: -13.7% | |
| CVGI Links: Profile News Message Board | |
| Charts:- Daily , Weekly | |
| Add CVGI to Watchlist: View: Get Complete CVGI Trend Analysis ➞ | |
 | LCNB LCNB Corp. |
| Sector: Financials | |
| SubSector: Regional - Mid-Atlantic Banks | |
| MarketCap: 176.759 Millions | |
| Recent Price: 14.92 Smart Investing & Trading Score: 58 | |
| Day Percent Change: 3.83% Day Change: 0.55 | |
| Week Change: -2.1% Year-to-date Change: -5.4% | |
| LCNB Links: Profile News Message Board | |
| Charts:- Daily , Weekly | |
| Add LCNB to Watchlist: View: Get Complete LCNB Trend Analysis ➞ | |
 | TSQ Townsquare Media, Inc. |
| Sector: Services & Goods | |
| SubSector: Broadcasting - Radio | |
| MarketCap: 101.795 Millions | |
| Recent Price: 11.98 Smart Investing & Trading Score: 43 | |
| Day Percent Change: 0.25% Day Change: 0.03 | |
| Week Change: -2.12% Year-to-date Change: 13.5% | |
| TSQ Links: Profile News Message Board | |
| Charts:- Daily , Weekly | |
| Add TSQ to Watchlist: View: Get Complete TSQ Trend Analysis ➞ | |
 | DTC Solo Brands, Inc. |
| Sector: Services & Goods | |
| SubSector: Internet Retail | |
| MarketCap: 525 Millions | |
| Recent Price: 1.84 Smart Investing & Trading Score: 17 | |
| Day Percent Change: -0.54% Day Change: -0.01 | |
| Week Change: -2.13% Year-to-date Change: -70.3% | |
| DTC Links: Profile News Message Board | |
| Charts:- Daily , Weekly | |
| Add DTC to Watchlist: View: Get Complete DTC Trend Analysis ➞ | |
 | PRLB Proto Labs, Inc. |
| Sector: Industrials | |
| SubSector: Machine Tools & Accessories | |
| MarketCap: 1944.78 Millions | |
| Recent Price: 30.70 Smart Investing & Trading Score: 17 | |
| Day Percent Change: -0.10% Day Change: -0.03 | |
| Week Change: -2.14% Year-to-date Change: -21.2% | |
| PRLB Links: Profile News Message Board | |
| Charts:- Daily , Weekly | |
| Add PRLB to Watchlist: View: Get Complete PRLB Trend Analysis ➞ | |
 | CLDT Chatham Lodging Trust |
| Sector: Financials | |
| SubSector: REIT - Hotel/Motel | |
| MarketCap: 274.734 Millions | |
| Recent Price: 9.10 Smart Investing & Trading Score: 0 | |
| Day Percent Change: -0.33% Day Change: -0.03 | |
| Week Change: -2.15% Year-to-date Change: -15.1% | |
| CLDT Links: Profile News Message Board | |
| Charts:- Daily , Weekly | |
| Add CLDT to Watchlist: View: Get Complete CLDT Trend Analysis ➞ | |
 | EXFY Expensify, Inc. |
| Sector: Technology | |
| SubSector: Software - Application | |
| MarketCap: 678 Millions | |
| Recent Price: 1.60 Smart Investing & Trading Score: 30 | |
| Day Percent Change: -1.85% Day Change: -0.03 | |
| Week Change: -2.15% Year-to-date Change: -36.7% | |
| EXFY Links: Profile News Message Board | |
| Charts:- Daily , Weekly | |
| Add EXFY to Watchlist: View: Get Complete EXFY Trend Analysis ➞ | |
 | EXTR Extreme Networks, Inc. |
| Sector: Technology | |
| SubSector: Communication Equipment | |
| MarketCap: 339.939 Millions | |
| Recent Price: 11.35 Smart Investing & Trading Score: 54 | |
| Day Percent Change: -0.87% Day Change: -0.10 | |
| Week Change: -2.16% Year-to-date Change: -35.7% | |
| EXTR Links: Profile News Message Board | |
| Charts:- Daily , Weekly | |
| Add EXTR to Watchlist: View: Get Complete EXTR Trend Analysis ➞ | |
 | SCVL Shoe Carnival, Inc. |
| Sector: Services & Goods | |
| SubSector: Apparel Stores | |
| MarketCap: 252.508 Millions | |
| Recent Price: 33.78 Smart Investing & Trading Score: 46 | |
| Day Percent Change: 1.29% Day Change: 0.43 | |
| Week Change: -2.17% Year-to-date Change: 11.8% | |
| SCVL Links: Profile News Message Board | |
| Charts:- Daily , Weekly | |
| Add SCVL to Watchlist: View: Get Complete SCVL Trend Analysis ➞ | |
 | VMEO Vimeo, Inc. |
| Sector: Technology | |
| SubSector: Software - Application | |
| MarketCap: 678 Millions | |
| Recent Price: 3.61 Smart Investing & Trading Score: 25 | |
| Day Percent Change: -0.69% Day Change: -0.02 | |
| Week Change: -2.17% Year-to-date Change: -8.0% | |
| VMEO Links: Profile News Message Board | |
| Charts:- Daily , Weekly | |
| Add VMEO to Watchlist: View: Get Complete VMEO Trend Analysis ➞ | |
 | NX Quanex Building Products Corporation |
| Sector: Industrials | |
| SubSector: General Building Materials | |
| MarketCap: 315.453 Millions | |
| Recent Price: 33.07 Smart Investing & Trading Score: 17 | |
| Day Percent Change: -0.06% Day Change: -0.02 | |
| Week Change: -2.19% Year-to-date Change: 8.2% | |
| NX Links: Profile News Message Board | |
| Charts:- Daily , Weekly | |
| Add NX to Watchlist: View: Get Complete NX Trend Analysis ➞ | |
 | NGVC Natural Grocers by Vitamin Cottage, Inc. |
| Sector: Services & Goods | |
| SubSector: Grocery Stores | |
| MarketCap: 185.475 Millions | |
| Recent Price: 16.51 Smart Investing & Trading Score: 52 | |
| Day Percent Change: -0.06% Day Change: -0.01 | |
| Week Change: -2.19% Year-to-date Change: 3.2% | |
| NGVC Links: Profile News Message Board | |
| Charts:- Daily , Weekly | |
| Add NGVC to Watchlist: View: Get Complete NGVC Trend Analysis ➞ | |
 | POWI Power Integrations, Inc. |
| Sector: Technology | |
| SubSector: Semiconductor - Integrated Circuits | |
| MarketCap: 2612.1 Millions | |
| Recent Price: 65.78 Smart Investing & Trading Score: 10 | |
| Day Percent Change: 0.05% Day Change: 0.03 | |
| Week Change: -2.21% Year-to-date Change: -19.9% | |
| POWI Links: Profile News Message Board | |
| Charts:- Daily , Weekly | |
| Add POWI to Watchlist: View: Get Complete POWI Trend Analysis ➞ | |
 | VIGL Vigil Neuroscience, Inc. |
| Sector: Health Care | |
| SubSector: Biotechnology | |
| MarketCap: 339 Millions | |
| Recent Price: 2.65 Smart Investing & Trading Score: 27 | |
| Day Percent Change: 0.19% Day Change: 0.00 | |
| Week Change: -2.21% Year-to-date Change: -22.7% | |
| VIGL Links: Profile News Message Board | |
| Charts:- Daily , Weekly | |
| Add VIGL to Watchlist: View: Get Complete VIGL Trend Analysis ➞ | |
 | VVI Viad Corp |
| Sector: Services & Goods | |
| SubSector: Business Services | |
| MarketCap: 270.682 Millions | |
| Recent Price: 34.35 Smart Investing & Trading Score: 0 | |
| Day Percent Change: 0.26% Day Change: 0.09 | |
| Week Change: -2.22% Year-to-date Change: -5.1% | |
| VVI Links: Profile News Message Board | |
| Charts:- Daily , Weekly | |
| Add VVI to Watchlist: View: Get Complete VVI Trend Analysis ➞ | |
 | upst Upstart Holdings, Inc. |
| Sector: Financials | |
| SubSector: Credit Services | |
| MarketCap: 2900 Millions | |
| Recent Price: 22.93 Smart Investing & Trading Score: 42 | |
| Day Percent Change: 0.31% Day Change: 0.07 | |
| Week Change: -2.22% Year-to-date Change: -43.4% | |
| upst Links: Profile News Message Board | |
| Charts:- Daily , Weekly | |
| Add upst to Watchlist: View: Get Complete upst Trend Analysis ➞ | |
 | SHAK Shake Shack Inc. |
| Sector: Services & Goods | |
| SubSector: Specialty Eateries | |
| MarketCap: 1497.67 Millions | |
| Recent Price: 102.54 Smart Investing & Trading Score: 27 | |
| Day Percent Change: -0.76% Day Change: -0.79 | |
| Week Change: -2.23% Year-to-date Change: 38.3% | |
| SHAK Links: Profile News Message Board | |
| Charts:- Daily , Weekly | |
| Add SHAK to Watchlist: View: Get Complete SHAK Trend Analysis ➞ | |
 | INTA Intapp, Inc. |
| Sector: Technology | |
| SubSector: Software - Application | |
| MarketCap: 2820 Millions | |
| Recent Price: 31.19 Smart Investing & Trading Score: 37 | |
| Day Percent Change: 0.21% Day Change: 0.07 | |
| Week Change: -2.23% Year-to-date Change: -18.3% | |
| INTA Links: Profile News Message Board | |
| Charts:- Daily , Weekly | |
| Add INTA to Watchlist: View: Get Complete INTA Trend Analysis ➞ | |
 | JBLU JetBlue Airways Corporation |
| Sector: Transports | |
| SubSector: Regional Airlines | |
| MarketCap: 2383.1 Millions | |
| Recent Price: 5.65 Smart Investing & Trading Score: 15 | |
| Day Percent Change: 1.16% Day Change: 0.07 | |
| Week Change: -2.25% Year-to-date Change: 1.8% | |
| JBLU Links: Profile News Message Board | |
| Charts:- Daily , Weekly | |
| Add JBLU to Watchlist: View: Get Complete JBLU Trend Analysis ➞ | |
 | RC Ready Capital Corporation |
| Sector: Financials | |
| SubSector: Mortgage Investment | |
| MarketCap: 358.039 Millions | |
| Recent Price: 8.65 Smart Investing & Trading Score: 42 | |
| Day Percent Change: -0.23% Day Change: -0.02 | |
| Week Change: -2.26% Year-to-date Change: -15.6% | |
| RC Links: Profile News Message Board | |
| Charts:- Daily , Weekly | |
| Add RC to Watchlist: View: Get Complete RC Trend Analysis ➞ | |
| For tabular summary view of above stock list: Summary View ➞ 0 - 25 , 25 - 50 , 50 - 75 , 75 - 100 , 100 - 125 , 125 - 150 , 150 - 175 , 175 - 200 , 200 - 225 , 225 - 250 , 250 - 275 , 275 - 300 , 300 - 325 , 325 - 350 , 350 - 375 , 375 - 400 , 400 - 425 , 425 - 450 , 450 - 475 , 475 - 500 , 500 - 525 , 525 - 550 , 550 - 575 , 575 - 600 , 600 - 625 , 625 - 650 , 650 - 675 , 675 - 700 , 700 - 725 , 725 - 750 , 750 - 775 , 775 - 800 , 800 - 825 , 825 - 850 , 850 - 875 , 875 - 900 , 900 - 925 , 925 - 950 , 950 - 975 , 975 - 1000 , 1000 - 1025 , 1025 - 1050 , 1050 - 1075 , 1075 - 1100 , 1100 - 1125 , 1125 - 1150 , 1150 - 1175 , 1175 - 1200 , 1200 - 1225 , 1225 - 1250 , 1250 - 1275 , 1275 - 1300 , 1300 - 1325 , 1325 - 1350 , 1350 - 1375 , 1375 - 1400 , 1400 - 1425 , 1425 - 1450 , 1450 - 1475 , 1475 - 1500 , 1500 - 1525 , 1525 - 1550 , 1550 - 1575 | ||
| Click To Change The Sort Order: By Market Cap or Company Size Performance: Year-to-date, Week and Day | |
| Select Chart Type: | ||
| Too many stocks? View smallcap stocks filtered by marketcap & sector |
| Marketcap: All SmallCap Stocks (default-no microcap), Large, Mid-Range, Small & MicroCap |
| Sector: Tech, Finance, Energy, Staples, Retail, Industrial, Materials, Utilities & Medical |
|
Best Stocks Today 12Stocks.com |
© 2024 12Stocks.com Terms & Conditions Privacy Contact Us
All Information Provided Only For Education And Not To Be Used For Investing or Trading. See Terms & Conditions


One More Thing ... Get Best Stocks Delivered Daily!
Never Ever Miss A Move With Our Top Ten Stocks Lists
Find Best Stocks In Any Market - Bull or Bear Market
Take A Peek At Our Top Ten Stocks Lists: Daily, Weekly, Year-to-Date & Top Trends
Find Best Stocks In Any Market - Bull or Bear Market
Take A Peek At Our Top Ten Stocks Lists: Daily, Weekly, Year-to-Date & Top Trends
Smallcap Stocks With Best Up Trends [0-bearish to 100-bullish]: Gannett Co[100], Pitney Bowes[100], Sprouts Farmers[100], Herbalife Nutrition[100], UFP [100], Carriage Services[100], Fluence Energy[100], Gray Television[100], USCB Financial[100], Outbrain [100], BankUnited [100]
Best Smallcap Stocks Year-to-Date:
Janux [434.2%], Longboard [253.44%], Alpine Immune[239.36%], Avidity Biosciences[180.42%], Cullinan Oncology[171.9%], Bakkt [169.51%], Vera [168.8%], Arcutis Bio[163.93%], Super Micro[150.63%], Y-mAbs [145.23%], Sana [130.96%] Best Smallcap Stocks This Week:
Emergent BioSolutions[61.72%], Eyenovia [44.86%], Cue Biopharma[35.9%], Poseida [34.51%], P3 Health[30.18%], Surmodics [29.08%], Phibro Animal[28.91%], TransMedics Group[28.2%], Enovix [27.36%], MediaAlpha [26.88%], Seres [26.67%] Best Smallcap Stocks Daily:
Emergent BioSolutions[60.88%], Enovix [26.38%], Gannett Co[23.65%], Office Properties[22.00%], Perdoceo Education[19.25%], Pitney Bowes[18.76%], Benchmark Electronics[17.86%], Butterfly [16.81%], Pulmonx [15.80%], MediaAlpha [13.63%], Sunnova Energy[13.46%]