
 Login Sign Up


| |||||
 |  | ||||

| 12Stocks.com Market Intelligence |
Best SmallCap Stocks
|
| In a hurry? Small Cap Stock Lists: Performance Trends Table, Stock Charts
Sort Small Cap stocks: Daily, Weekly, Year-to-Date, Market Cap & Trends. Filter Small Cap stocks list by sector: Show all, Tech, Finance, Energy, Staples, Retail, Industrial, Materials, Utilities and HealthCare Filter Small Cap stocks list by size: All Large Medium Small and MicroCap |
| 12Stocks.com Small Cap Stocks Performances & Trends Daily | |||||||||
|
|  The overall Smart Investing & Trading Score is 49 (0-bearish to 100-bullish) which puts Small Cap index in short term neutral trend. The Smart Investing & Trading Score from previous trading session is 14 and hence an improvement of trend.
| ||||||||
Here are the Smart Investing & Trading Scores of the most requested small cap stocks at 12Stocks.com (click stock name for detailed review):
|


| 12Stocks.com: Investing in Smallcap Index with Stocks | |
|
The following table helps investors and traders sort through current performance and trends (as measured by Smart Investing & Trading Score) of various
stocks in the Smallcap Index. Quick View: Move mouse or cursor over stock symbol (ticker) to view short-term technical chart and over stock name to view long term chart. Click on  to add stock symbol to your watchlist and to add stock symbol to your watchlist and  to view watchlist. Click on any ticker or stock name for detailed market intelligence report for that stock. to view watchlist. Click on any ticker or stock name for detailed market intelligence report for that stock. |
12Stocks.com Performance of Stocks in Smallcap Index
| Ticker | Stock Name | Watchlist | Category | Recent Price | Smart Investing & Trading Score | Change % | Weekly Change% |
| AROC | Archrock |   | Energy | 20.03 | 56 | 2.72% | -0.84% |
| ROG | Rogers | | Technology | 120.00 | 80 | 1.16% | -0.85% |
| NVEE | NV5 Global | | Services & Goods | 93.18 | 39 | 0.96% | -0.85% |
| ANNX | Annexon | | Health Care | 4.66 | 24 | -1.89% | -0.85% |
| NXT | Nextracker | | Technology | 43.41 | 24 | 1.12% | -0.86% |
| EVH | Evolent Health | | Technology | 27.41 | 10 | 0.51% | -0.87% |
| EGHT | 8x8 | | Technology | 2.25 | 22 | 1.35% | -0.88% |
| SMP | Standard Motor | | Consumer Staples | 32.17 | 83 | -1.86% | -0.89% |
| GABC | German American | | Financials | 31.96 | 68 | 0.88% | -0.90% |
| NVEC | NVE | | Technology | 79.67 | 14 | -2.11% | -0.90% |
| PSFE | Paysafe | | Technology | 14.33 | 28 | 1.13% | -0.90% |
| SLAB | Silicon | | Technology | 121.02 | 10 | 1.87% | -0.91% |
| SHOO | Steven Madden | | Consumer Staples | 40.11 | 30 | 1.75% | -0.91% |
| GDYN | Grid Dynamics | | Technology | 9.84 | 27 | -0.71% | -0.91% |
| GATX | GATX | | Transports | 126.34 | 45 | 1.50% | -0.92% |
| IRTC | iRhythm | | Health Care | 110.88 | 20 | -0.77% | -0.92% |
| ODP | Office Depot | | Services & Goods | 50.91 | 37 | 0.12% | -0.93% |
| DFIN | Donnelley Financial | | Services & Goods | 62.42 | 0 | 4.85% | -0.95% |
| NSP | Insperity | | Services & Goods | 103.17 | 26 | -1.08% | -0.96% |
| FIP | FTAI Infrastructure | | Industrials | 7.24 | 63 | 1.83% | -0.96% |
| MHO | M/I Homes | | Industrials | 118.91 | 32 | 2.21% | -0.97% |
| OVID | Ovid | | Health Care | 3.07 | 7 | 0.33% | -0.97% |
| WHD | Cactus | | Energy | 51.30 | 68 | 3.55% | -0.97% |
| TRS | TriMas | | Industrials | 26.22 | 68 | 1.67% | -0.98% |
| XHR | Xenia Hotels | | Financials | 13.99 | 10 | 0.36% | -0.99% |


| Too many stocks? View smallcap stocks filtered by marketcap & sector |
| Marketcap: All SmallCap Stocks (default-no microcap), Large, Mid-Range, Small |
| Smallcap Sector: Tech, Finance, Energy, Staples, Retail, Industrial, Materials, & Medical |
|
Get the most comprehensive stock market coverage daily at 12Stocks.com ➞ Best Stocks Today ➞ Best Stocks Weekly ➞ Best Stocks Year-to-Date ➞ Best Stocks Trends ➞  Best Stocks Today 12Stocks.com Best Nasdaq Stocks ➞ Best S&P 500 Stocks ➞ Best Tech Stocks ➞ Best Biotech Stocks ➞ |
| Detailed Overview of SmallCap Stocks |
| SmallCap Technical Overview, Leaders & Laggards, Top SmallCap ETF Funds & Detailed SmallCap Stocks List, Charts, Trends & More |
| Smallcap: Technical Analysis, Trends & YTD Performance | |
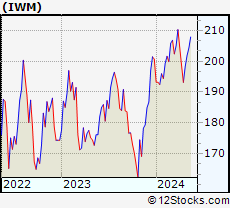
| SmallCap segment as represented by
IWM, an exchange-traded fund [ETF], holds basket of thousands of smallcap stocks from across all major sectors of the US stock market. The smallcap index (contains stocks like Riverbed & Sotheby's) is down by -0.39% and is currently underperforming the overall market by -6.01% year-to-date. Below is a quick view of technical charts and trends: | |
 IWM Weekly Chart |
|
| Long Term Trend: Not Good | |
| Medium Term Trend: Good | |
 IWM Daily Chart |
|
| Short Term Trend: Deteriorating | |
| Overall Trend Score: 49 | |
| YTD Performance: -0.39% | |
| **Trend Scores & Views Are Only For Educational Purposes And Not For Investing | |
| 12Stocks.com: Top Performing Small Cap Index Stocks | ||||||||||||||||||||||||||||||||||||||||||||||||
 The top performing Small Cap Index stocks year to date are
Now, more recently, over last week, the top performing Small Cap Index stocks on the move are


|
||||||||||||||||||||||||||||||||||||||||||||||||
| 12Stocks.com: Investing in Smallcap Index using Exchange Traded Funds | |
|
The following table shows list of key exchange traded funds (ETF) that
help investors track Smallcap index. The following list also includes leveraged ETF funds that track twice or thrice the daily returns of Smallcap indices. Short or inverse ETF funds move in the opposite direction to the index they track and are useful during market pullbacks or during bear markets. Quick View: Move mouse or cursor over ETF symbol (ticker) to view short-term technical chart and over ETF name to view long term chart. Click on ticker or stock name for detailed view. Click on to add stock symbol to your watchlist and to view watchlist. |
12Stocks.com List of ETFs that track Smallcap Index
| Ticker | ETF Name | Watchlist | Recent Price | Smart Investing & Trading Score | Change % | Week % | Year-to-date % |
| IWM | iShares Russell 2000 | | 199.92 | 49 | 1.84 | 0.77 | -0.39% |
| IJR | iShares Core S&P Small-Cap | | 106.33 | 50 | 1.52 | 0.64 | -1.77% |
| VTWO | Vanguard Russell 2000 ETF | | 80.85 | 7 | 1.88 | 0.79 | -0.31% |
| IWN | iShares Russell 2000 Value | | 152.88 | 57 | 2.04 | 1.15 | -1.58% |
| IWO | iShares Russell 2000 Growth | | 254.34 | 17 | 1.91 | 0.49 | 0.84% |
| IJS | iShares S&P Small-Cap 600 Value | | 98.02 | 13 | 1.68 | 0.85 | -4.9% |
| IJT | iShares S&P Small-Cap 600 Growth | | 126.72 | 20 | 1.42 | 0.5 | 1.26% |
| XSLV | PowerShares S&P SmallCap Low Volatil ETF | | 43.14 | 42 | 0.72 | 0.98 | -2.29% |
| SDD | ProShares UltraShort SmallCap600 | | 19.31 | 61 | -2.02 | -0.21 | 4.79% |
| SMLV | SPDR SSGA US Small Cap Low Volatil ETF | | 108.83 | 44 | 1.30 | 1.22 | -3.27% |
| SAA | ProShares Ultra SmallCap600 | | 22.93 | 32 | 1.56 | -0.46 | -8.08% |
| SBB | ProShares Short SmallCap600 | | 16.37 | 71 | -1.14 | -0.09 | 2.76% |
| 12Stocks.com: Charts, Trends, Fundamental Data and Performances of SmallCap Stocks | |
|
We now take in-depth look at all SmallCap stocks including charts, multi-period performances and overall trends (as measured by Smart Investing & Trading Score). One can sort SmallCap stocks (click link to choose) by Daily, Weekly and by Year-to-Date performances. Also, one can sort by size of the company or by market capitalization. |
| Select Your Default Chart Type: | |||||
| |||||
| Click on stock symbol or name for detailed view. Click on to add stock symbol to your watchlist and to view watchlist. Quick View: Move mouse or cursor over "Daily" to quickly view daily technical stock chart and over "Weekly" to view weekly technical stock chart. | |||||

 | AROC Archrock, Inc. |
| Sector: Energy | |
| SubSector: Oil & Gas Equipment & Services | |
| MarketCap: 614.961 Millions | |
| Recent Price: 20.03 Smart Investing & Trading Score: 56 | |
| Day Percent Change: 2.72% Day Change: 0.53 | |
| Week Change: -0.84% Year-to-date Change: 30.1% | |
| AROC Links: Profile News Message Board | |
| Charts:- Daily , Weekly | |
| Add AROC to Watchlist: View: Get Complete AROC Trend Analysis ➞ | |
 | ROG Rogers Corporation |
| Sector: Technology | |
| SubSector: Diversified Electronics | |
| MarketCap: 1756.36 Millions | |
| Recent Price: 120.00 Smart Investing & Trading Score: 80 | |
| Day Percent Change: 1.16% Day Change: 1.38 | |
| Week Change: -0.85% Year-to-date Change: -9.1% | |
| ROG Links: Profile News Message Board | |
| Charts:- Daily , Weekly | |
| Add ROG to Watchlist: View: Get Complete ROG Trend Analysis ➞ | |
 | NVEE NV5 Global, Inc. |
| Sector: Services & Goods | |
| SubSector: Technical Services | |
| MarketCap: 484.91 Millions | |
| Recent Price: 93.18 Smart Investing & Trading Score: 39 | |
| Day Percent Change: 0.96% Day Change: 0.89 | |
| Week Change: -0.85% Year-to-date Change: -16.1% | |
| NVEE Links: Profile News Message Board | |
| Charts:- Daily , Weekly | |
| Add NVEE to Watchlist: View: Get Complete NVEE Trend Analysis ➞ | |
 | ANNX Annexon, Inc. |
| Sector: Health Care | |
| SubSector: Biotechnology | |
| MarketCap: 94487 Millions | |
| Recent Price: 4.66 Smart Investing & Trading Score: 24 | |
| Day Percent Change: -1.89% Day Change: -0.09 | |
| Week Change: -0.85% Year-to-date Change: 2.2% | |
| ANNX Links: Profile News Message Board | |
| Charts:- Daily , Weekly | |
| Add ANNX to Watchlist: View: Get Complete ANNX Trend Analysis ➞ | |
 | NXT Nextracker Inc. |
| Sector: Technology | |
| SubSector: Solar | |
| MarketCap: 5590 Millions | |
| Recent Price: 43.41 Smart Investing & Trading Score: 24 | |
| Day Percent Change: 1.12% Day Change: 0.48 | |
| Week Change: -0.86% Year-to-date Change: -7.1% | |
| NXT Links: Profile News Message Board | |
| Charts:- Daily , Weekly | |
| Add NXT to Watchlist: View: Get Complete NXT Trend Analysis ➞ | |
 | EVH Evolent Health, Inc. |
| Sector: Technology | |
| SubSector: Healthcare Information Services | |
| MarketCap: 486.755 Millions | |
| Recent Price: 27.41 Smart Investing & Trading Score: 10 | |
| Day Percent Change: 0.51% Day Change: 0.14 | |
| Week Change: -0.87% Year-to-date Change: -17.0% | |
| EVH Links: Profile News Message Board | |
| Charts:- Daily , Weekly | |
| Add EVH to Watchlist: View: Get Complete EVH Trend Analysis ➞ | |
 | EGHT 8x8, Inc. |
| Sector: Technology | |
| SubSector: Diversified Communication Services | |
| MarketCap: 1861.64 Millions | |
| Recent Price: 2.25 Smart Investing & Trading Score: 22 | |
| Day Percent Change: 1.35% Day Change: 0.03 | |
| Week Change: -0.88% Year-to-date Change: -40.5% | |
| EGHT Links: Profile News Message Board | |
| Charts:- Daily , Weekly | |
| Add EGHT to Watchlist: View: Get Complete EGHT Trend Analysis ➞ | |
 | SMP Standard Motor Products, Inc. |
| Sector: Consumer Staples | |
| SubSector: Auto Parts | |
| MarketCap: 909.939 Millions | |
| Recent Price: 32.17 Smart Investing & Trading Score: 83 | |
| Day Percent Change: -1.86% Day Change: -0.61 | |
| Week Change: -0.89% Year-to-date Change: -19.2% | |
| SMP Links: Profile News Message Board | |
| Charts:- Daily , Weekly | |
| Add SMP to Watchlist: View: Get Complete SMP Trend Analysis ➞ | |
 | GABC German American Bancorp, Inc. |
| Sector: Financials | |
| SubSector: Regional - Midwest Banks | |
| MarketCap: 731.47 Millions | |
| Recent Price: 31.96 Smart Investing & Trading Score: 68 | |
| Day Percent Change: 0.88% Day Change: 0.28 | |
| Week Change: -0.9% Year-to-date Change: -1.4% | |
| GABC Links: Profile News Message Board | |
| Charts:- Daily , Weekly | |
| Add GABC to Watchlist: View: Get Complete GABC Trend Analysis ➞ | |
 | NVEC NVE Corporation |
| Sector: Technology | |
| SubSector: Semiconductor - Specialized | |
| MarketCap: 231.26 Millions | |
| Recent Price: 79.67 Smart Investing & Trading Score: 14 | |
| Day Percent Change: -2.11% Day Change: -1.72 | |
| Week Change: -0.9% Year-to-date Change: 1.6% | |
| NVEC Links: Profile News Message Board | |
| Charts:- Daily , Weekly | |
| Add NVEC to Watchlist: View: Get Complete NVEC Trend Analysis ➞ | |
 | PSFE Paysafe Limited |
| Sector: Technology | |
| SubSector: Software - Infrastructure | |
| MarketCap: 605 Millions | |
| Recent Price: 14.33 Smart Investing & Trading Score: 28 | |
| Day Percent Change: 1.13% Day Change: 0.16 | |
| Week Change: -0.9% Year-to-date Change: 11.1% | |
| PSFE Links: Profile News Message Board | |
| Charts:- Daily , Weekly | |
| Add PSFE to Watchlist: View: Get Complete PSFE Trend Analysis ➞ | |
 | SLAB Silicon Laboratories Inc. |
| Sector: Technology | |
| SubSector: Semiconductor - Integrated Circuits | |
| MarketCap: 3710.2 Millions | |
| Recent Price: 121.02 Smart Investing & Trading Score: 10 | |
| Day Percent Change: 1.87% Day Change: 2.22 | |
| Week Change: -0.91% Year-to-date Change: -8.5% | |
| SLAB Links: Profile News Message Board | |
| Charts:- Daily , Weekly | |
| Add SLAB to Watchlist: View: Get Complete SLAB Trend Analysis ➞ | |
 | SHOO Steven Madden, Ltd. |
| Sector: Consumer Staples | |
| SubSector: Textile - Apparel Footwear & Accessories | |
| MarketCap: 1756.3 Millions | |
| Recent Price: 40.11 Smart Investing & Trading Score: 30 | |
| Day Percent Change: 1.75% Day Change: 0.69 | |
| Week Change: -0.91% Year-to-date Change: -4.5% | |
| SHOO Links: Profile News Message Board | |
| Charts:- Daily , Weekly | |
| Add SHOO to Watchlist: View: Get Complete SHOO Trend Analysis ➞ | |
 | GDYN Grid Dynamics Holdings, Inc. |
| Sector: Technology | |
| SubSector: Information Technology Services | |
| MarketCap: 318.968 Millions | |
| Recent Price: 9.84 Smart Investing & Trading Score: 27 | |
| Day Percent Change: -0.71% Day Change: -0.07 | |
| Week Change: -0.91% Year-to-date Change: -26.2% | |
| GDYN Links: Profile News Message Board | |
| Charts:- Daily , Weekly | |
| Add GDYN to Watchlist: View: Get Complete GDYN Trend Analysis ➞ | |
 | GATX GATX Corporation |
| Sector: Transports | |
| SubSector: Rental & Leasing Services | |
| MarketCap: 2080.34 Millions | |
| Recent Price: 126.34 Smart Investing & Trading Score: 45 | |
| Day Percent Change: 1.50% Day Change: 1.87 | |
| Week Change: -0.92% Year-to-date Change: 5.1% | |
| GATX Links: Profile News Message Board | |
| Charts:- Daily , Weekly | |
| Add GATX to Watchlist: View: Get Complete GATX Trend Analysis ➞ | |
 | IRTC iRhythm Technologies, Inc. |
| Sector: Health Care | |
| SubSector: Medical Instruments & Supplies | |
| MarketCap: 2167.9 Millions | |
| Recent Price: 110.88 Smart Investing & Trading Score: 20 | |
| Day Percent Change: -0.77% Day Change: -0.86 | |
| Week Change: -0.92% Year-to-date Change: 3.6% | |
| IRTC Links: Profile News Message Board | |
| Charts:- Daily , Weekly | |
| Add IRTC to Watchlist: View: Get Complete IRTC Trend Analysis ➞ | |
 | ODP Office Depot, Inc. |
| Sector: Services & Goods | |
| SubSector: Specialty Retail, Other | |
| MarketCap: 1024.44 Millions | |
| Recent Price: 50.91 Smart Investing & Trading Score: 37 | |
| Day Percent Change: 0.12% Day Change: 0.06 | |
| Week Change: -0.93% Year-to-date Change: -9.6% | |
| ODP Links: Profile News Message Board | |
| Charts:- Daily , Weekly | |
| Add ODP to Watchlist: View: Get Complete ODP Trend Analysis ➞ | |
 | DFIN Donnelley Financial Solutions, Inc. |
| Sector: Services & Goods | |
| SubSector: Business Services | |
| MarketCap: 229.882 Millions | |
| Recent Price: 62.42 Smart Investing & Trading Score: 0 | |
| Day Percent Change: 4.85% Day Change: 2.89 | |
| Week Change: -0.95% Year-to-date Change: 0.1% | |
| DFIN Links: Profile News Message Board | |
| Charts:- Daily , Weekly | |
| Add DFIN to Watchlist: View: Get Complete DFIN Trend Analysis ➞ | |
 | NSP Insperity, Inc. |
| Sector: Services & Goods | |
| SubSector: Business Services | |
| MarketCap: 1385.32 Millions | |
| Recent Price: 103.17 Smart Investing & Trading Score: 26 | |
| Day Percent Change: -1.08% Day Change: -1.13 | |
| Week Change: -0.96% Year-to-date Change: -12.0% | |
| NSP Links: Profile News Message Board | |
| Charts:- Daily , Weekly | |
| Add NSP to Watchlist: View: Get Complete NSP Trend Analysis ➞ | |
 | FIP FTAI Infrastructure Inc. |
| Sector: Industrials | |
| SubSector: Industrials | |
| MarketCap: 368 Millions | |
| Recent Price: 7.24 Smart Investing & Trading Score: 63 | |
| Day Percent Change: 1.83% Day Change: 0.13 | |
| Week Change: -0.96% Year-to-date Change: 86.1% | |
| FIP Links: Profile News Message Board | |
| Charts:- Daily , Weekly | |
| Add FIP to Watchlist: View: Get Complete FIP Trend Analysis ➞ | |
 | MHO M/I Homes, Inc. |
| Sector: Industrials | |
| SubSector: Residential Construction | |
| MarketCap: 437.106 Millions | |
| Recent Price: 118.91 Smart Investing & Trading Score: 32 | |
| Day Percent Change: 2.21% Day Change: 2.57 | |
| Week Change: -0.97% Year-to-date Change: -13.7% | |
| MHO Links: Profile News Message Board | |
| Charts:- Daily , Weekly | |
| Add MHO to Watchlist: View: Get Complete MHO Trend Analysis ➞ | |
 | OVID Ovid Therapeutics Inc. |
| Sector: Health Care | |
| SubSector: Biotechnology | |
| MarketCap: 130.385 Millions | |
| Recent Price: 3.07 Smart Investing & Trading Score: 7 | |
| Day Percent Change: 0.33% Day Change: 0.01 | |
| Week Change: -0.97% Year-to-date Change: -4.7% | |
| OVID Links: Profile News Message Board | |
| Charts:- Daily , Weekly | |
| Add OVID to Watchlist: View: Get Complete OVID Trend Analysis ➞ | |
 | WHD Cactus, Inc. |
| Sector: Energy | |
| SubSector: Oil & Gas Equipment & Services | |
| MarketCap: 920.261 Millions | |
| Recent Price: 51.30 Smart Investing & Trading Score: 68 | |
| Day Percent Change: 3.55% Day Change: 1.76 | |
| Week Change: -0.97% Year-to-date Change: 13.0% | |
| WHD Links: Profile News Message Board | |
| Charts:- Daily , Weekly | |
| Add WHD to Watchlist: View: Get Complete WHD Trend Analysis ➞ | |
 | TRS TriMas Corporation |
| Sector: Industrials | |
| SubSector: Industrial Equipment & Components | |
| MarketCap: 963.509 Millions | |
| Recent Price: 26.22 Smart Investing & Trading Score: 68 | |
| Day Percent Change: 1.67% Day Change: 0.43 | |
| Week Change: -0.98% Year-to-date Change: 3.5% | |
| TRS Links: Profile News Message Board | |
| Charts:- Daily , Weekly | |
| Add TRS to Watchlist: View: Get Complete TRS Trend Analysis ➞ | |
 | XHR Xenia Hotels & Resorts, Inc. |
| Sector: Financials | |
| SubSector: REIT - Hotel/Motel | |
| MarketCap: 1058.24 Millions | |
| Recent Price: 13.99 Smart Investing & Trading Score: 10 | |
| Day Percent Change: 0.36% Day Change: 0.05 | |
| Week Change: -0.99% Year-to-date Change: 2.7% | |
| XHR Links: Profile News Message Board | |
| Charts:- Daily , Weekly | |
| Add XHR to Watchlist: View: Get Complete XHR Trend Analysis ➞ | |
| Too many stocks? View smallcap stocks filtered by marketcap & sector |
| Marketcap: All SmallCap Stocks (default-no microcap), Large, Mid-Range, Small & MicroCap |
| Sector: Tech, Finance, Energy, Staples, Retail, Industrial, Materials, Utilities & Medical |
|
Best Stocks Today 12Stocks.com |
© 2024 12Stocks.com Terms & Conditions Privacy Contact Us
All Information Provided Only For Education And Not To Be Used For Investing or Trading. See Terms & Conditions


One More Thing ... Get Best Stocks Delivered Daily!
Never Ever Miss A Move With Our Top Ten Stocks Lists
Find Best Stocks In Any Market - Bull or Bear Market
Take A Peek At Our Top Ten Stocks Lists: Daily, Weekly, Year-to-Date & Top Trends
Find Best Stocks In Any Market - Bull or Bear Market
Take A Peek At Our Top Ten Stocks Lists: Daily, Weekly, Year-to-Date & Top Trends
Smallcap Stocks With Best Up Trends [0-bearish to 100-bullish]: Emergent BioSolutions[100], Aspen Aerogels[100], Perdoceo Education[100], Gannett Co[100], Pitney Bowes[100], Benchmark Electronics[100], Origin Materials[100], FormFactor [100], Lantheus [100], Q2 [100], Blueprint Medicines[100]
Best Smallcap Stocks Year-to-Date:
Janux [440.16%], Viking [307.09%], Longboard [273.98%], Alpine Immune[239.23%], Bakkt [187.89%], Avidity Biosciences[182.96%], Vera [170.74%], Cullinan Oncology[169.74%], Super Micro[168.25%], Arcutis Bio[166.25%], Y-mAbs [152.93%] Best Smallcap Stocks This Week:
Deciphera [73.24%], Emergent BioSolutions[71.88%], Eyenovia [48.36%], Aspen Aerogels[48.14%], P3 Health[38.51%], Carvana Co[38.18%], Cue Biopharma[37.73%], Origin Materials[36.24%], TransMedics Group[35.14%], Seres [34.55%], Enovix [32.07%] Best Smallcap Stocks Daily:
Emergent BioSolutions[70.98%], Aspen Aerogels[56.70%], Carvana Co[33.77%], Perdoceo Education[31.46%], Enovix [31.06%], Office Properties[28.00%], Gannett Co[26.97%], Sunnova Energy[25.21%], Pitney Bowes[24.70%], Pulmonx [21.37%], CommScope Holding[20.95%]