
 Login Sign Up


| |||||
 |  | ||||

| 12Stocks.com Market Intelligence |
Best SmallCap Stocks
|
| In a hurry? Small Cap Stock Lists: Performance Trends Table, Stock Charts
Sort Small Cap stocks: Daily, Weekly, Year-to-Date, Market Cap & Trends. Filter Small Cap stocks list by sector: Show all, Tech, Finance, Energy, Staples, Retail, Industrial, Materials, Utilities and HealthCare Filter Small Cap stocks list by size: All Large Medium Small and MicroCap |
| 12Stocks.com Small Cap Stocks Performances & Trends Daily | |||||||||
|
|  The overall Smart Investing & Trading Score is 44 (0-bearish to 100-bullish) which puts Small Cap index in short term neutral trend. The Smart Investing & Trading Score from previous trading session is 58 and hence a deterioration of trend.
| ||||||||
Here are the Smart Investing & Trading Scores of the most requested small cap stocks at 12Stocks.com (click stock name for detailed review):
|


| 12Stocks.com: Investing in Smallcap Index with Stocks | |
|
The following table helps investors and traders sort through current performance and trends (as measured by Smart Investing & Trading Score) of various
stocks in the Smallcap Index. Quick View: Move mouse or cursor over stock symbol (ticker) to view short-term technical chart and over stock name to view long term chart. Click on  to add stock symbol to your watchlist and to add stock symbol to your watchlist and  to view watchlist. Click on any ticker or stock name for detailed market intelligence report for that stock. to view watchlist. Click on any ticker or stock name for detailed market intelligence report for that stock. |
12Stocks.com Performance of Stocks in Smallcap Index
| Ticker | Stock Name | Watchlist | Category | Recent Price | Smart Investing & Trading Score | Change % | YTD Change% |
| RYAM | Rayonier Advanced |   | Materials | 3.88 | 10 | -5.83 | -4.20% |
| SKIN | Beauty Health | | Consumer Staples | 3.06 | 46 | -5.85 | -3.32% |
| CABA | Cabaletta Bio | | Health Care | 12.20 | 18 | -5.90 | -46.28% |
| KOD | Kodiak Sciences | | Health Care | 3.18 | 10 | -5.92 | 4.61% |
| OPFI | OppFi | | Financials | 2.70 | 25 | -5.92 | -47.16% |
| ATRI | Atrion | | Health Care | 398.97 | 68 | -5.95 | 5.33% |
| GRTS | Gritstone Oncology | | Health Care | 0.76 | 25 | -5.95 | -62.52% |
| KYMR | Kymera | | Health Care | 33.08 | 56 | -5.97 | 30.18% |
| ARWR | Arrowhead | | Health Care | 21.87 | 42 | -6.10 | -28.53% |
| MNRO | Monro | | Consumer Staples | 28.08 | 35 | -6.12 | -4.29% |
| ORGN | Origin Materials | | Materials | 0.69 | 68 | -6.18 | -17.84% |
| LUMN | Lumen | | Technology | 1.21 | 10 | -6.20 | -33.70% |
| DH | Definitive Healthcare | | Health Care | 6.73 | 40 | -6.20 | -33.17% |
| LESL | Leslies | | Services & Goods | 3.99 | 0 | -6.23 | -42.34% |
| ALLO | Allogene | | Health Care | 2.85 | 15 | -6.25 | -11.21% |
| RCKT | Rocket | | Health Care | 22.13 | 20 | -6.35 | -26.16% |
| NOVA | Sunnova Energy | | Services & Goods | 3.68 | 15 | -6.36 | -75.87% |
| PFSI | PennyMac Financial | | Financials | 86.20 | 81 | -6.38 | -2.46% |
| CNOB | ConnectOne Bancorp | | Financials | 18.46 | 67 | -6.44 | -19.42% |
| RNA | Avidity Biosciences | | Health Care | 23.48 | 43 | -6.45 | 159.79% |
| CRNC | Cerence | | Technology | 9.39 | 10 | -6.57 | -52.24% |
| VAXX | Vaxxinity | | Health Care | 0.12 | 0 | -6.62 | -85.55% |
| AKRO | Akero | | Health Care | 18.91 | 20 | -6.64 | -18.99% |
| NRIX | Nurix | | Health Care | 12.81 | 46 | -6.70 | 24.01% |
| PHR | Phreesia | | Technology | 20.46 | 35 | -6.75 | -11.62% |


| Too many stocks? View smallcap stocks filtered by marketcap & sector |
| Marketcap: All SmallCap Stocks (default-no microcap), Large, Mid-Range, Small |
| Smallcap Sector: Tech, Finance, Energy, Staples, Retail, Industrial, Materials, & Medical |
|
Get the most comprehensive stock market coverage daily at 12Stocks.com ➞ Best Stocks Today ➞ Best Stocks Weekly ➞ Best Stocks Year-to-Date ➞ Best Stocks Trends ➞  Best Stocks Today 12Stocks.com Best Nasdaq Stocks ➞ Best S&P 500 Stocks ➞ Best Tech Stocks ➞ Best Biotech Stocks ➞ |
| Detailed Overview of SmallCap Stocks |
| SmallCap Technical Overview, Leaders & Laggards, Top SmallCap ETF Funds & Detailed SmallCap Stocks List, Charts, Trends & More |
| Smallcap: Technical Analysis, Trends & YTD Performance | |
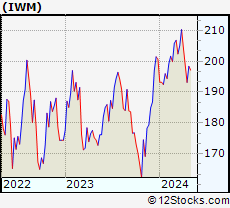
| SmallCap segment as represented by
IWM, an exchange-traded fund [ETF], holds basket of thousands of smallcap stocks from across all major sectors of the US stock market. The smallcap index (contains stocks like Riverbed & Sotheby's) is down by -2.11% and is currently underperforming the overall market by -7.27% year-to-date. Below is a quick view of technical charts and trends: | |
 IWM Weekly Chart |
|
| Long Term Trend: Good | |
| Medium Term Trend: Not Good | |
 IWM Daily Chart |
|
| Short Term Trend: Very Good | |
| Overall Trend Score: 44 | |
| YTD Performance: -2.11% | |
| **Trend Scores & Views Are Only For Educational Purposes And Not For Investing | |
| 12Stocks.com: Top Performing Small Cap Index Stocks | ||||||||||||||||||||||||||||||||||||||||||||||||
 The top performing Small Cap Index stocks year to date are
Now, more recently, over last week, the top performing Small Cap Index stocks on the move are


|
||||||||||||||||||||||||||||||||||||||||||||||||
| 12Stocks.com: Investing in Smallcap Index using Exchange Traded Funds | |
|
The following table shows list of key exchange traded funds (ETF) that
help investors track Smallcap index. The following list also includes leveraged ETF funds that track twice or thrice the daily returns of Smallcap indices. Short or inverse ETF funds move in the opposite direction to the index they track and are useful during market pullbacks or during bear markets. Quick View: Move mouse or cursor over ETF symbol (ticker) to view short-term technical chart and over ETF name to view long term chart. Click on ticker or stock name for detailed view. Click on to add stock symbol to your watchlist and to view watchlist. |
12Stocks.com List of ETFs that track Smallcap Index
| Ticker | ETF Name | Watchlist | Recent Price | Smart Investing & Trading Score | Change % | Week % | Year-to-date % |
| IWM | iShares Russell 2000 | | 196.48 | 44 | -0.61 | 1.73 | -2.11% |
| IJR | iShares Core S&P Small-Cap | | 104.86 | 78 | -0.80 | 1.59 | -3.13% |
| VTWO | Vanguard Russell 2000 ETF | | 79.45 | 63 | -0.60 | 1.75 | -2.03% |
| IWN | iShares Russell 2000 Value | | 150.18 | 68 | -0.73 | 1.62 | -3.32% |
| IWO | iShares Russell 2000 Growth | | 249.86 | 51 | -0.56 | 1.86 | -0.94% |
| IJS | iShares S&P Small-Cap 600 Value | | 96.69 | 60 | -1.04 | 1.13 | -6.19% |
| IJT | iShares S&P Small-Cap 600 Growth | | 125.06 | 63 | -0.25 | 2.33 | -0.06% |
| XSLV | PowerShares S&P SmallCap Low Volatil ETF | | 42.54 | 73 | -0.93 | 0.85 | -3.65% |
| SDD | ProShares UltraShort SmallCap600 | | 19.58 | 42 | 0.46 | -3.74 | 6.26% |
| SBB | ProShares Short SmallCap600 | | 16.50 | 40 | 0.79 | -2.02 | 3.58% |
| SMLV | SPDR SSGA US Small Cap Low Volatil ETF | | 107.33 | 73 | -1.01 | 1.17 | -4.61% |
| SAA | ProShares Ultra SmallCap600 | | 22.66 | 58 | -1.52 | 3.94 | -9.18% |
| 12Stocks.com: Charts, Trends, Fundamental Data and Performances of SmallCap Stocks | |
|
We now take in-depth look at all SmallCap stocks including charts, multi-period performances and overall trends (as measured by Smart Investing & Trading Score). One can sort SmallCap stocks (click link to choose) by Daily, Weekly and by Year-to-Date performances. Also, one can sort by size of the company or by market capitalization. |
| Select Your Default Chart Type: | |||||
| |||||
| Click on stock symbol or name for detailed view. Click on to add stock symbol to your watchlist and to view watchlist. Quick View: Move mouse or cursor over "Daily" to quickly view daily technical stock chart and over "Weekly" to view weekly technical stock chart. | |||||

 | RYAM Rayonier Advanced Materials Inc. |
| Sector: Materials | |
| SubSector: Chemicals - Major Diversified | |
| MarketCap: 116.736 Millions | |
| Recent Price: 3.88 Smart Investing & Trading Score: 10 | |
| Day Percent Change: -5.83% Day Change: -0.24 | |
| Week Change: -9.77% Year-to-date Change: -4.2% | |
| RYAM Links: Profile News Message Board | |
| Charts:- Daily , Weekly | |
| Add RYAM to Watchlist: View: Get Complete RYAM Trend Analysis ➞ | |
 | SKIN The Beauty Health Company |
| Sector: Consumer Staples | |
| SubSector: Household & Personal Products | |
| MarketCap: 1070 Millions | |
| Recent Price: 3.06 Smart Investing & Trading Score: 46 | |
| Day Percent Change: -5.85% Day Change: -0.19 | |
| Week Change: -6.42% Year-to-date Change: -3.3% | |
| SKIN Links: Profile News Message Board | |
| Charts:- Daily , Weekly | |
| Add SKIN to Watchlist: View: Get Complete SKIN Trend Analysis ➞ | |
 | CABA Cabaletta Bio, Inc. |
| Sector: Health Care | |
| SubSector: Biotechnology | |
| MarketCap: 222.085 Millions | |
| Recent Price: 12.20 Smart Investing & Trading Score: 18 | |
| Day Percent Change: -5.90% Day Change: -0.77 | |
| Week Change: -8.38% Year-to-date Change: -46.3% | |
| CABA Links: Profile News Message Board | |
| Charts:- Daily , Weekly | |
| Add CABA to Watchlist: View: Get Complete CABA Trend Analysis ➞ | |
 | KOD Kodiak Sciences Inc. |
| Sector: Health Care | |
| SubSector: Biotechnology | |
| MarketCap: 2132.15 Millions | |
| Recent Price: 3.18 Smart Investing & Trading Score: 10 | |
| Day Percent Change: -5.92% Day Change: -0.20 | |
| Week Change: -5.36% Year-to-date Change: 4.6% | |
| KOD Links: Profile News Message Board | |
| Charts:- Daily , Weekly | |
| Add KOD to Watchlist: View: Get Complete KOD Trend Analysis ➞ | |
 | OPFI OppFi Inc. |
| Sector: Financials | |
| SubSector: Credit Services | |
| MarketCap: 226 Millions | |
| Recent Price: 2.70 Smart Investing & Trading Score: 25 | |
| Day Percent Change: -5.92% Day Change: -0.17 | |
| Week Change: -9.7% Year-to-date Change: -47.2% | |
| OPFI Links: Profile News Message Board | |
| Charts:- Daily , Weekly | |
| Add OPFI to Watchlist: View: Get Complete OPFI Trend Analysis ➞ | |
 | ATRI Atrion Corporation |
| Sector: Health Care | |
| SubSector: Medical Instruments & Supplies | |
| MarketCap: 1234.6 Millions | |
| Recent Price: 398.97 Smart Investing & Trading Score: 68 | |
| Day Percent Change: -5.95% Day Change: -25.22 | |
| Week Change: -0.84% Year-to-date Change: 5.3% | |
| ATRI Links: Profile News Message Board | |
| Charts:- Daily , Weekly | |
| Add ATRI to Watchlist: View: Get Complete ATRI Trend Analysis ➞ | |
 | GRTS Gritstone Oncology, Inc. |
| Sector: Health Care | |
| SubSector: Biotechnology | |
| MarketCap: 240.085 Millions | |
| Recent Price: 0.76 Smart Investing & Trading Score: 25 | |
| Day Percent Change: -5.95% Day Change: -0.05 | |
| Week Change: 3.12% Year-to-date Change: -62.5% | |
| GRTS Links: Profile News Message Board | |
| Charts:- Daily , Weekly | |
| Add GRTS to Watchlist: View: Get Complete GRTS Trend Analysis ➞ | |
 | KYMR Kymera Therapeutics, Inc. |
| Sector: Health Care | |
| SubSector: Biotechnology | |
| MarketCap: 27087 Millions | |
| Recent Price: 33.08 Smart Investing & Trading Score: 56 | |
| Day Percent Change: -5.97% Day Change: -2.10 | |
| Week Change: -4.5% Year-to-date Change: 30.2% | |
| KYMR Links: Profile News Message Board | |
| Charts:- Daily , Weekly | |
| Add KYMR to Watchlist: View: Get Complete KYMR Trend Analysis ➞ | |
 | ARWR Arrowhead Pharmaceuticals, Inc. |
| Sector: Health Care | |
| SubSector: Biotechnology | |
| MarketCap: 3226.15 Millions | |
| Recent Price: 21.87 Smart Investing & Trading Score: 42 | |
| Day Percent Change: -6.10% Day Change: -1.42 | |
| Week Change: -2.06% Year-to-date Change: -28.5% | |
| ARWR Links: Profile News Message Board | |
| Charts:- Daily , Weekly | |
| Add ARWR to Watchlist: View: Get Complete ARWR Trend Analysis ➞ | |
 | MNRO Monro, Inc. |
| Sector: Consumer Staples | |
| SubSector: Auto Parts | |
| MarketCap: 1514.89 Millions | |
| Recent Price: 28.08 Smart Investing & Trading Score: 35 | |
| Day Percent Change: -6.12% Day Change: -1.83 | |
| Week Change: -5.07% Year-to-date Change: -4.3% | |
| MNRO Links: Profile News Message Board | |
| Charts:- Daily , Weekly | |
| Add MNRO to Watchlist: View: Get Complete MNRO Trend Analysis ➞ | |
 | ORGN Origin Materials, Inc. |
| Sector: Materials | |
| SubSector: Chemicals | |
| MarketCap: 586 Millions | |
| Recent Price: 0.69 Smart Investing & Trading Score: 68 | |
| Day Percent Change: -6.18% Day Change: -0.05 | |
| Week Change: 0.29% Year-to-date Change: -17.8% | |
| ORGN Links: Profile News Message Board | |
| Charts:- Daily , Weekly | |
| Add ORGN to Watchlist: View: Get Complete ORGN Trend Analysis ➞ | |
 | LUMN Lumen Technologies, Inc. |
| Sector: Technology | |
| SubSector: Telecom Services - Domestic | |
| MarketCap: 1242 Millions | |
| Recent Price: 1.21 Smart Investing & Trading Score: 10 | |
| Day Percent Change: -6.20% Day Change: -0.08 | |
| Week Change: -7.63% Year-to-date Change: -33.7% | |
| LUMN Links: Profile News Message Board | |
| Charts:- Daily , Weekly | |
| Add LUMN to Watchlist: View: Get Complete LUMN Trend Analysis ➞ | |
 | DH Definitive Healthcare Corp. |
| Sector: Health Care | |
| SubSector: Health Information Services | |
| MarketCap: 1690 Millions | |
| Recent Price: 6.73 Smart Investing & Trading Score: 40 | |
| Day Percent Change: -6.20% Day Change: -0.44 | |
| Week Change: -4.67% Year-to-date Change: -33.2% | |
| DH Links: Profile News Message Board | |
| Charts:- Daily , Weekly | |
| Add DH to Watchlist: View: Get Complete DH Trend Analysis ➞ | |
 | LESL Leslies, Inc. |
| Sector: Services & Goods | |
| SubSector: Home Improvement Retail | |
| MarketCap: 37927 Millions | |
| Recent Price: 3.99 Smart Investing & Trading Score: 0 | |
| Day Percent Change: -6.23% Day Change: -0.26 | |
| Week Change: -10.03% Year-to-date Change: -42.3% | |
| LESL Links: Profile News Message Board | |
| Charts:- Daily , Weekly | |
| Add LESL to Watchlist: View: Get Complete LESL Trend Analysis ➞ | |
 | ALLO Allogene Therapeutics, Inc. |
| Sector: Health Care | |
| SubSector: Biotechnology | |
| MarketCap: 2858.65 Millions | |
| Recent Price: 2.85 Smart Investing & Trading Score: 15 | |
| Day Percent Change: -6.25% Day Change: -0.19 | |
| Week Change: -18.1% Year-to-date Change: -11.2% | |
| ALLO Links: Profile News Message Board | |
| Charts:- Daily , Weekly | |
| Add ALLO to Watchlist: View: Get Complete ALLO Trend Analysis ➞ | |
 | RCKT Rocket Pharmaceuticals, Inc. |
| Sector: Health Care | |
| SubSector: Biotechnology | |
| MarketCap: 899.585 Millions | |
| Recent Price: 22.13 Smart Investing & Trading Score: 20 | |
| Day Percent Change: -6.35% Day Change: -1.50 | |
| Week Change: -3.02% Year-to-date Change: -26.2% | |
| RCKT Links: Profile News Message Board | |
| Charts:- Daily , Weekly | |
| Add RCKT to Watchlist: View: Get Complete RCKT Trend Analysis ➞ | |
 | NOVA Sunnova Energy International Inc. |
| Sector: Services & Goods | |
| SubSector: Management Services | |
| MarketCap: 1180.45 Millions | |
| Recent Price: 3.68 Smart Investing & Trading Score: 15 | |
| Day Percent Change: -6.36% Day Change: -0.25 | |
| Week Change: -3.16% Year-to-date Change: -75.9% | |
| NOVA Links: Profile News Message Board | |
| Charts:- Daily , Weekly | |
| Add NOVA to Watchlist: View: Get Complete NOVA Trend Analysis ➞ | |
 | PFSI PennyMac Financial Services, Inc. |
| Sector: Financials | |
| SubSector: Mortgage Investment | |
| MarketCap: 1588.09 Millions | |
| Recent Price: 86.20 Smart Investing & Trading Score: 81 | |
| Day Percent Change: -6.38% Day Change: -5.87 | |
| Week Change: -2% Year-to-date Change: -2.5% | |
| PFSI Links: Profile News Message Board | |
| Charts:- Daily , Weekly | |
| Add PFSI to Watchlist: View: Get Complete PFSI Trend Analysis ➞ | |
 | CNOB ConnectOne Bancorp, Inc. |
| Sector: Financials | |
| SubSector: Regional - Northeast Banks | |
| MarketCap: 491.899 Millions | |
| Recent Price: 18.46 Smart Investing & Trading Score: 67 | |
| Day Percent Change: -6.44% Day Change: -1.27 | |
| Week Change: -0.97% Year-to-date Change: -19.4% | |
| CNOB Links: Profile News Message Board | |
| Charts:- Daily , Weekly | |
| Add CNOB to Watchlist: View: Get Complete CNOB Trend Analysis ➞ | |
 | RNA Avidity Biosciences, Inc. |
| Sector: Health Care | |
| SubSector: Biotechnology | |
| MarketCap: 12287 Millions | |
| Recent Price: 23.48 Smart Investing & Trading Score: 43 | |
| Day Percent Change: -6.45% Day Change: -1.62 | |
| Week Change: 2.42% Year-to-date Change: 159.8% | |
| RNA Links: Profile News Message Board | |
| Charts:- Daily , Weekly | |
| Add RNA to Watchlist: View: Get Complete RNA Trend Analysis ➞ | |
 | CRNC Cerence Inc. |
| Sector: Technology | |
| SubSector: Application Software | |
| MarketCap: 640.662 Millions | |
| Recent Price: 9.39 Smart Investing & Trading Score: 10 | |
| Day Percent Change: -6.57% Day Change: -0.66 | |
| Week Change: -9.45% Year-to-date Change: -52.2% | |
| CRNC Links: Profile News Message Board | |
| Charts:- Daily , Weekly | |
| Add CRNC to Watchlist: View: Get Complete CRNC Trend Analysis ➞ | |
 | VAXX Vaxxinity, Inc. |
| Sector: Health Care | |
| SubSector: Biotechnology | |
| MarketCap: 320 Millions | |
| Recent Price: 0.12 Smart Investing & Trading Score: 0 | |
| Day Percent Change: -6.62% Day Change: -0.01 | |
| Week Change: -74.5% Year-to-date Change: -85.6% | |
| VAXX Links: Profile News Message Board | |
| Charts:- Daily , Weekly | |
| Add VAXX to Watchlist: View: Get Complete VAXX Trend Analysis ➞ | |
 | AKRO Akero Therapeutics, Inc. |
| Sector: Health Care | |
| SubSector: Biotechnology | |
| MarketCap: 675.085 Millions | |
| Recent Price: 18.91 Smart Investing & Trading Score: 20 | |
| Day Percent Change: -6.64% Day Change: -1.35 | |
| Week Change: -8.89% Year-to-date Change: -19.0% | |
| AKRO Links: Profile News Message Board | |
| Charts:- Daily , Weekly | |
| Add AKRO to Watchlist: View: Get Complete AKRO Trend Analysis ➞ | |
 | NRIX Nurix Therapeutics, Inc. |
| Sector: Health Care | |
| SubSector: Biotechnology | |
| MarketCap: 16787 Millions | |
| Recent Price: 12.81 Smart Investing & Trading Score: 46 | |
| Day Percent Change: -6.70% Day Change: -0.92 | |
| Week Change: -9.57% Year-to-date Change: 24.0% | |
| NRIX Links: Profile News Message Board | |
| Charts:- Daily , Weekly | |
| Add NRIX to Watchlist: View: Get Complete NRIX Trend Analysis ➞ | |
 | PHR Phreesia, Inc. |
| Sector: Technology | |
| SubSector: Healthcare Information Services | |
| MarketCap: 810.255 Millions | |
| Recent Price: 20.46 Smart Investing & Trading Score: 35 | |
| Day Percent Change: -6.75% Day Change: -1.48 | |
| Week Change: -5.71% Year-to-date Change: -11.6% | |
| PHR Links: Profile News Message Board | |
| Charts:- Daily , Weekly | |
| Add PHR to Watchlist: View: Get Complete PHR Trend Analysis ➞ | |
| Too many stocks? View smallcap stocks filtered by marketcap & sector |
| Marketcap: All SmallCap Stocks (default-no microcap), Large, Mid-Range, Small & MicroCap |
| Sector: Tech, Finance, Energy, Staples, Retail, Industrial, Materials, Utilities & Medical |
|
Best Stocks Today 12Stocks.com |
© 2024 12Stocks.com Terms & Conditions Privacy Contact Us
All Information Provided Only For Education And Not To Be Used For Investing or Trading. See Terms & Conditions


One More Thing ... Get Best Stocks Delivered Daily!
Never Ever Miss A Move With Our Top Ten Stocks Lists
Find Best Stocks In Any Market - Bull or Bear Market
Take A Peek At Our Top Ten Stocks Lists: Daily, Weekly, Year-to-Date & Top Trends
Find Best Stocks In Any Market - Bull or Bear Market
Take A Peek At Our Top Ten Stocks Lists: Daily, Weekly, Year-to-Date & Top Trends
Smallcap Stocks With Best Up Trends [0-bearish to 100-bullish]: B. Riley[100], Central Pacific[100], California Water[100], Cricut [100], Carpenter [100], Haemonetics [100], Sanmina [100], Trustmark [100], Comstock Resources[100], EchoStar [100], Mueller Industries[100]
Best Smallcap Stocks Year-to-Date:
CareMax [490.72%], Janux [338.34%], Viking [270.02%], Alpine Immune[239.52%], Longboard [218%], Super Micro[177%], Arcutis Bio[166.56%], Avidity Biosciences[159.79%], Vera [149.94%], Hippo [128.87%], Stoke [122.15%] Best Smallcap Stocks This Week:
Matterport [168.97%], B. Riley[73.54%], Impinj [33.73%], ProKidney [32.84%], Seres [32.65%], Riot Blockchain[32.64%], Ribbon [25.58%], Cullinan Oncology[22.92%], P.A.M. Transportation[22.85%], NuScale Power[21.44%], Hibbett Sports[21.03%] Best Smallcap Stocks Daily:
Impinj [28.65%], P.A.M. Transportation[17.95%], B. Riley[16.61%], Strategic Education[16.28%], OptiNose [14.56%], JELD-WEN Holding[11.54%], Sonic Automotive[10.86%], Intevac [10.54%], SiTime [8.84%], Noodles & [8.08%], ProKidney [7.75%]