
 Login Sign Up


| |||||
 |  | ||||

| 12Stocks.com Market Intelligence |
Best SmallCap Stocks
|
| In a hurry? Small Cap Stock Lists: Performance Trends Table, Stock Charts
Sort Small Cap stocks: Daily, Weekly, Year-to-Date, Market Cap & Trends. Filter Small Cap stocks list by sector: Show all, Tech, Finance, Energy, Staples, Retail, Industrial, Materials, Utilities and HealthCare Filter Small Cap stocks list by size: All Large Medium Small and MicroCap |
| 12Stocks.com Small Cap Stocks Performances & Trends Daily | |||||||||
|
|  The overall Smart Investing & Trading Score is 23 (0-bearish to 100-bullish) which puts Small Cap index in short term bearish to neutral trend. The Smart Investing & Trading Score from previous trading session is 13 and hence an improvement of trend.
| ||||||||
Here are the Smart Investing & Trading Scores of the most requested small cap stocks at 12Stocks.com (click stock name for detailed review):
|


| 12Stocks.com: Investing in Smallcap Index with Stocks | |
|
The following table helps investors and traders sort through current performance and trends (as measured by Smart Investing & Trading Score) of various
stocks in the Smallcap Index. Quick View: Move mouse or cursor over stock symbol (ticker) to view short-term technical chart and over stock name to view long term chart. Click on  to add stock symbol to your watchlist and to add stock symbol to your watchlist and  to view watchlist. Click on any ticker or stock name for detailed market intelligence report for that stock. to view watchlist. Click on any ticker or stock name for detailed market intelligence report for that stock. |
12Stocks.com Performance of Stocks in Smallcap Index
| Ticker | Stock Name | Watchlist | Category | Recent Price | Smart Investing & Trading Score | Change % | YTD Change% |
| NREF | NexPoint Real |   | Financials | 13.01 | 35 | 0.08 | -17.32% |
| HRT | HireRight | | Industrials | 14.25 | 68 | 0.07 | 5.95% |
| PEB | Pebblebrook Hotel | | Financials | 14.35 | 0 | 0.07 | -10.20% |
| OUT | Outfront Media | | Services & Goods | 14.87 | 46 | 0.07 | 6.52% |
| HLIO | Helios | | Industrials | 46.04 | 71 | 0.07 | 1.52% |
| STNE | StoneCo | | Technology | 15.26 | 0 | 0.07 | -15.36% |
| ASAN | Asana | | Technology | 13.73 | 17 | 0.07 | -27.77% |
| LQDT | Liquidity Services | | Services & Goods | 16.91 | 0 | 0.06 | -1.74% |
| ACIW | ACI Worldwide | | Technology | 31.51 | 56 | 0.06 | 2.97% |
| QLYS | Qualys | | Technology | 162.84 | 18 | 0.06 | -17.04% |
| FSBW | FS Bancorp | | Financials | 30.91 | 10 | 0.06 | -16.37% |
| VREX | Varex Imaging | | Health Care | 16.92 | 0 | 0.06 | -17.46% |
| CARS | Cars.com | | Services & Goods | 16.17 | 25 | 0.06 | -14.76% |
| NUVL | Nuvalent | | Health Care | 64.23 | 17 | 0.06 | -12.60% |
| MDC | M.D.C | | Industrials | 62.98 | 57 | 0.05 | 13.99% |
| AVAV | AeroVironment | | Industrials | 146.70 | 61 | 0.05 | 16.39% |
| RELY | Remitly Global | | Technology | 18.60 | 71 | 0.05 | -4.22% |
| SHCR | Sharecare | | Health Care | 0.66 | 17 | 0.05 | -39.14% |
| STRA | Strategic Education | | Services & Goods | 98.11 | 51 | 0.04 | 6.21% |
| RM | Regional Management | | Financials | 24.87 | 83 | 0.04 | -0.84% |
| STHO | Star | | Financials | 11.68 | 40 | 0.04 | -22.14% |
| METCB | Ramaco Resources | | Materials | 11.41 | 32 | 0.04 | -13.89% |
| FOSL | Fossil Group | | Consumer Staples | 0.78 | 10 | 0.03 | -46.59% |
| ENV | Envestnet | | Services & Goods | 62.22 | 100 | 0.03 | 25.65% |
| DOOR | Masonite | | Industrials | 131.39 | 83 | 0.03 | 55.20% |


| Too many stocks? View smallcap stocks filtered by marketcap & sector |
| Marketcap: All SmallCap Stocks (default-no microcap), Large, Mid-Range, Small |
| Smallcap Sector: Tech, Finance, Energy, Staples, Retail, Industrial, Materials, & Medical |
|
Get the most comprehensive stock market coverage daily at 12Stocks.com ➞ Best Stocks Today ➞ Best Stocks Weekly ➞ Best Stocks Year-to-Date ➞ Best Stocks Trends ➞  Best Stocks Today 12Stocks.com Best Nasdaq Stocks ➞ Best S&P 500 Stocks ➞ Best Tech Stocks ➞ Best Biotech Stocks ➞ |
| Detailed Overview of SmallCap Stocks |
| SmallCap Technical Overview, Leaders & Laggards, Top SmallCap ETF Funds & Detailed SmallCap Stocks List, Charts, Trends & More |
| Smallcap: Technical Analysis, Trends & YTD Performance | |
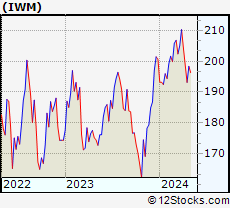
| SmallCap segment as represented by
IWM, an exchange-traded fund [ETF], holds basket of thousands of smallcap stocks from across all major sectors of the US stock market. The smallcap index (contains stocks like Riverbed & Sotheby's) is down by -3.92% and is currently underperforming the overall market by -8.11% year-to-date. Below is a quick view of technical charts and trends: | |
 IWM Weekly Chart |
|
| Long Term Trend: Not Good | |
| Medium Term Trend: Not Good | |
 IWM Daily Chart |
|
| Short Term Trend: Not Good | |
| Overall Trend Score: 23 | |
| YTD Performance: -3.92% | |
| **Trend Scores & Views Are Only For Educational Purposes And Not For Investing | |
| 12Stocks.com: Top Performing Small Cap Index Stocks | ||||||||||||||||||||||||||||||||||||||||||||||||
 The top performing Small Cap Index stocks year to date are
Now, more recently, over last week, the top performing Small Cap Index stocks on the move are


|
||||||||||||||||||||||||||||||||||||||||||||||||
| 12Stocks.com: Investing in Smallcap Index using Exchange Traded Funds | |
|
The following table shows list of key exchange traded funds (ETF) that
help investors track Smallcap index. The following list also includes leveraged ETF funds that track twice or thrice the daily returns of Smallcap indices. Short or inverse ETF funds move in the opposite direction to the index they track and are useful during market pullbacks or during bear markets. Quick View: Move mouse or cursor over ETF symbol (ticker) to view short-term technical chart and over ETF name to view long term chart. Click on ticker or stock name for detailed view. Click on to add stock symbol to your watchlist and to view watchlist. |
12Stocks.com List of ETFs that track Smallcap Index
| Ticker | ETF Name | Watchlist | Recent Price | Smart Investing & Trading Score | Change % | Week % | Year-to-date % |
| IWM | iShares Russell 2000 | | 192.84 | 23 | -0.08 | -2.94 | -3.92% |
| IJR | iShares Core S&P Small-Cap | | 102.34 | 10 | 0.21 | -2.08 | -5.46% |
| VTWO | Vanguard Russell 2000 ETF | | 77.95 | 23 | -0.13 | -2.95 | -3.88% |
| IWN | iShares Russell 2000 Value | | 146.33 | 10 | 0.21 | -2.69 | -5.79% |
| IJS | iShares S&P Small-Cap 600 Value | | 94.51 | 18 | 0.41 | -1.73 | -8.31% |
| IWO | iShares Russell 2000 Growth | | 246.94 | 36 | -0.44 | -3.3 | -2.09% |
| IJT | iShares S&P Small-Cap 600 Growth | | 121.57 | 13 | -0.22 | -2.57 | -2.85% |
| XSLV | PowerShares S&P SmallCap Low Volatil ETF | | 41.65 | 25 | 0.56 | -1.05 | -5.66% |
| SAA | ProShares Ultra SmallCap600 | | 21.62 | 10 | -0.18 | -4.17 | -13.35% |
| SMLV | SPDR SSGA US Small Cap Low Volatil ETF | | 103.83 | 10 | 0.16 | -1.13 | -7.72% |
| SBB | ProShares Short SmallCap600 | | 16.98 | 100 | 0.77 | 2.62 | 6.59% |
| SDD | ProShares UltraShort SmallCap600 | | 20.69 | 95 | 0.44 | 4.33 | 12.28% |
| 12Stocks.com: Charts, Trends, Fundamental Data and Performances of SmallCap Stocks | |
|
We now take in-depth look at all SmallCap stocks including charts, multi-period performances and overall trends (as measured by Smart Investing & Trading Score). One can sort SmallCap stocks (click link to choose) by Daily, Weekly and by Year-to-Date performances. Also, one can sort by size of the company or by market capitalization. |
| Select Your Default Chart Type: | |||||
| |||||
| Click on stock symbol or name for detailed view. Click on to add stock symbol to your watchlist and to view watchlist. Quick View: Move mouse or cursor over "Daily" to quickly view daily technical stock chart and over "Weekly" to view weekly technical stock chart. | |||||

 | NREF NexPoint Real Estate Finance, Inc. |
| Sector: Financials | |
| SubSector: REIT Diversified | |
| MarketCap: 97267 Millions | |
| Recent Price: 13.01 Smart Investing & Trading Score: 35 | |
| Day Percent Change: 0.08% Day Change: 0.01 | |
| Week Change: -0.46% Year-to-date Change: -17.3% | |
| NREF Links: Profile News Message Board | |
| Charts:- Daily , Weekly | |
| Add NREF to Watchlist: View: Get Complete NREF Trend Analysis ➞ | |
 | HRT HireRight Holdings Corporation |
| Sector: Industrials | |
| SubSector: Staffing & Employment Services | |
| MarketCap: 823 Millions | |
| Recent Price: 14.25 Smart Investing & Trading Score: 68 | |
| Day Percent Change: 0.07% Day Change: 0.01 | |
| Week Change: 0.07% Year-to-date Change: 6.0% | |
| HRT Links: Profile News Message Board | |
| Charts:- Daily , Weekly | |
| Add HRT to Watchlist: View: Get Complete HRT Trend Analysis ➞ | |
 | PEB Pebblebrook Hotel Trust |
| Sector: Financials | |
| SubSector: REIT - Hotel/Motel | |
| MarketCap: 1472.84 Millions | |
| Recent Price: 14.35 Smart Investing & Trading Score: 0 | |
| Day Percent Change: 0.07% Day Change: 0.01 | |
| Week Change: -6.21% Year-to-date Change: -10.2% | |
| PEB Links: Profile News Message Board | |
| Charts:- Daily , Weekly | |
| Add PEB to Watchlist: View: Get Complete PEB Trend Analysis ➞ | |
 | OUT Outfront Media Inc. |
| Sector: Services & Goods | |
| SubSector: Marketing Services | |
| MarketCap: 1388.15 Millions | |
| Recent Price: 14.87 Smart Investing & Trading Score: 46 | |
| Day Percent Change: 0.07% Day Change: 0.01 | |
| Week Change: -4.86% Year-to-date Change: 6.5% | |
| OUT Links: Profile News Message Board | |
| Charts:- Daily , Weekly | |
| Add OUT to Watchlist: View: Get Complete OUT Trend Analysis ➞ | |
 | HLIO Helios Technologies, Inc. |
| Sector: Industrials | |
| SubSector: Diversified Machinery | |
| MarketCap: 1455.66 Millions | |
| Recent Price: 46.04 Smart Investing & Trading Score: 71 | |
| Day Percent Change: 0.07% Day Change: 0.03 | |
| Week Change: -0.2% Year-to-date Change: 1.5% | |
| HLIO Links: Profile News Message Board | |
| Charts:- Daily , Weekly | |
| Add HLIO to Watchlist: View: Get Complete HLIO Trend Analysis ➞ | |
 | STNE StoneCo Ltd. |
| Sector: Technology | |
| SubSector: Application Software | |
| MarketCap: 7347.82 Millions | |
| Recent Price: 15.26 Smart Investing & Trading Score: 0 | |
| Day Percent Change: 0.07% Day Change: 0.01 | |
| Week Change: -5.33% Year-to-date Change: -15.4% | |
| STNE Links: Profile News Message Board | |
| Charts:- Daily , Weekly | |
| Add STNE to Watchlist: View: Get Complete STNE Trend Analysis ➞ | |
 | ASAN Asana, Inc. |
| Sector: Technology | |
| SubSector: Software Application | |
| MarketCap: 45087 Millions | |
| Recent Price: 13.73 Smart Investing & Trading Score: 17 | |
| Day Percent Change: 0.07% Day Change: 0.01 | |
| Week Change: -4.98% Year-to-date Change: -27.8% | |
| ASAN Links: Profile News Message Board | |
| Charts:- Daily , Weekly | |
| Add ASAN to Watchlist: View: Get Complete ASAN Trend Analysis ➞ | |
 | LQDT Liquidity Services, Inc. |
| Sector: Services & Goods | |
| SubSector: Catalog & Mail Order Houses | |
| MarketCap: 144.492 Millions | |
| Recent Price: 16.91 Smart Investing & Trading Score: 0 | |
| Day Percent Change: 0.06% Day Change: 0.01 | |
| Week Change: -5.58% Year-to-date Change: -1.7% | |
| LQDT Links: Profile News Message Board | |
| Charts:- Daily , Weekly | |
| Add LQDT to Watchlist: View: Get Complete LQDT Trend Analysis ➞ | |
 | ACIW ACI Worldwide, Inc. |
| Sector: Technology | |
| SubSector: Technical & System Software | |
| MarketCap: 2645.7 Millions | |
| Recent Price: 31.51 Smart Investing & Trading Score: 56 | |
| Day Percent Change: 0.06% Day Change: 0.02 | |
| Week Change: -1.53% Year-to-date Change: 3.0% | |
| ACIW Links: Profile News Message Board | |
| Charts:- Daily , Weekly | |
| Add ACIW to Watchlist: View: Get Complete ACIW Trend Analysis ➞ | |
 | QLYS Qualys, Inc. |
| Sector: Technology | |
| SubSector: Application Software | |
| MarketCap: 3475.02 Millions | |
| Recent Price: 162.84 Smart Investing & Trading Score: 18 | |
| Day Percent Change: 0.06% Day Change: 0.09 | |
| Week Change: -1.99% Year-to-date Change: -17.0% | |
| QLYS Links: Profile News Message Board | |
| Charts:- Daily , Weekly | |
| Add QLYS to Watchlist: View: Get Complete QLYS Trend Analysis ➞ | |
 | FSBW FS Bancorp, Inc. |
| Sector: Financials | |
| SubSector: Regional - Pacific Banks | |
| MarketCap: 140.429 Millions | |
| Recent Price: 30.91 Smart Investing & Trading Score: 10 | |
| Day Percent Change: 0.06% Day Change: 0.02 | |
| Week Change: -3.19% Year-to-date Change: -16.4% | |
| FSBW Links: Profile News Message Board | |
| Charts:- Daily , Weekly | |
| Add FSBW to Watchlist: View: Get Complete FSBW Trend Analysis ➞ | |
 | VREX Varex Imaging Corporation |
| Sector: Health Care | |
| SubSector: Medical Appliances & Equipment | |
| MarketCap: 718.78 Millions | |
| Recent Price: 16.92 Smart Investing & Trading Score: 0 | |
| Day Percent Change: 0.06% Day Change: 0.01 | |
| Week Change: -1.91% Year-to-date Change: -17.5% | |
| VREX Links: Profile News Message Board | |
| Charts:- Daily , Weekly | |
| Add VREX to Watchlist: View: Get Complete VREX Trend Analysis ➞ | |
 | CARS Cars.com Inc. |
| Sector: Services & Goods | |
| SubSector: Auto Dealerships | |
| MarketCap: 290.321 Millions | |
| Recent Price: 16.17 Smart Investing & Trading Score: 25 | |
| Day Percent Change: 0.06% Day Change: 0.01 | |
| Week Change: -2.36% Year-to-date Change: -14.8% | |
| CARS Links: Profile News Message Board | |
| Charts:- Daily , Weekly | |
| Add CARS to Watchlist: View: Get Complete CARS Trend Analysis ➞ | |
 | NUVL Nuvalent, Inc. |
| Sector: Health Care | |
| SubSector: Biotechnology | |
| MarketCap: 2400 Millions | |
| Recent Price: 64.23 Smart Investing & Trading Score: 17 | |
| Day Percent Change: 0.06% Day Change: 0.04 | |
| Week Change: -1.95% Year-to-date Change: -12.6% | |
| NUVL Links: Profile News Message Board | |
| Charts:- Daily , Weekly | |
| Add NUVL to Watchlist: View: Get Complete NUVL Trend Analysis ➞ | |
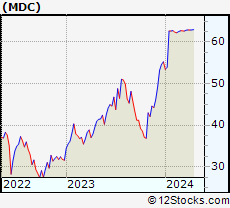 | MDC M.D.C. Holdings, Inc. |
| Sector: Industrials | |
| SubSector: Residential Construction | |
| MarketCap: 1606.26 Millions | |
| Recent Price: 62.98 Smart Investing & Trading Score: 57 | |
| Day Percent Change: 0.05% Day Change: 0.03 | |
| Week Change: 0.11% Year-to-date Change: 14.0% | |
| MDC Links: Profile News Message Board | |
| Charts:- Daily , Weekly | |
| Add MDC to Watchlist: View: Get Complete MDC Trend Analysis ➞ | |
 | AVAV AeroVironment, Inc. |
| Sector: Industrials | |
| SubSector: Aerospace/Defense Products & Services | |
| MarketCap: 1502.41 Millions | |
| Recent Price: 146.70 Smart Investing & Trading Score: 61 | |
| Day Percent Change: 0.05% Day Change: 0.08 | |
| Week Change: -0.29% Year-to-date Change: 16.4% | |
| AVAV Links: Profile News Message Board | |
| Charts:- Daily , Weekly | |
| Add AVAV to Watchlist: View: Get Complete AVAV Trend Analysis ➞ | |
 | RELY Remitly Global, Inc. |
| Sector: Technology | |
| SubSector: Software - Infrastructure | |
| MarketCap: 3320 Millions | |
| Recent Price: 18.60 Smart Investing & Trading Score: 71 | |
| Day Percent Change: 0.05% Day Change: 0.01 | |
| Week Change: -2.57% Year-to-date Change: -4.2% | |
| RELY Links: Profile News Message Board | |
| Charts:- Daily , Weekly | |
| Add RELY to Watchlist: View: Get Complete RELY Trend Analysis ➞ | |
 | SHCR Sharecare, Inc. |
| Sector: Health Care | |
| SubSector: Health Information Services | |
| MarketCap: 640 Millions | |
| Recent Price: 0.66 Smart Investing & Trading Score: 17 | |
| Day Percent Change: 0.05% Day Change: 0.00 | |
| Week Change: -11.06% Year-to-date Change: -39.1% | |
| SHCR Links: Profile News Message Board | |
| Charts:- Daily , Weekly | |
| Add SHCR to Watchlist: View: Get Complete SHCR Trend Analysis ➞ | |
 | STRA Strategic Education, Inc. |
| Sector: Services & Goods | |
| SubSector: Education & Training Services | |
| MarketCap: 2621.56 Millions | |
| Recent Price: 98.11 Smart Investing & Trading Score: 51 | |
| Day Percent Change: 0.04% Day Change: 0.04 | |
| Week Change: -0.35% Year-to-date Change: 6.2% | |
| STRA Links: Profile News Message Board | |
| Charts:- Daily , Weekly | |
| Add STRA to Watchlist: View: Get Complete STRA Trend Analysis ➞ | |
 | RM Regional Management Corp. |
| Sector: Financials | |
| SubSector: Credit Services | |
| MarketCap: 148.008 Millions | |
| Recent Price: 24.87 Smart Investing & Trading Score: 83 | |
| Day Percent Change: 0.04% Day Change: 0.01 | |
| Week Change: -0.52% Year-to-date Change: -0.8% | |
| RM Links: Profile News Message Board | |
| Charts:- Daily , Weekly | |
| Add RM to Watchlist: View: Get Complete RM Trend Analysis ➞ | |
 | STHO Star Holdings |
| Sector: Financials | |
| SubSector: Financials Services | |
| MarketCap: 195 Millions | |
| Recent Price: 11.68 Smart Investing & Trading Score: 40 | |
| Day Percent Change: 0.04% Day Change: 0.01 | |
| Week Change: -3.99% Year-to-date Change: -22.1% | |
| STHO Links: Profile News Message Board | |
| Charts:- Daily , Weekly | |
| Add STHO to Watchlist: View: Get Complete STHO Trend Analysis ➞ | |
 | METCB Ramaco Resources, Inc. |
| Sector: Materials | |
| SubSector: Coking Coal | |
| MarketCap: 469 Millions | |
| Recent Price: 11.41 Smart Investing & Trading Score: 32 | |
| Day Percent Change: 0.04% Day Change: 0.01 | |
| Week Change: 0% Year-to-date Change: -13.9% | |
| METCB Links: Profile News Message Board | |
| Charts:- Daily , Weekly | |
| Add METCB to Watchlist: View: Get Complete METCB Trend Analysis ➞ | |
 | FOSL Fossil Group, Inc. |
| Sector: Consumer Staples | |
| SubSector: Textile - Apparel Footwear & Accessories | |
| MarketCap: 215.87 Millions | |
| Recent Price: 0.78 Smart Investing & Trading Score: 10 | |
| Day Percent Change: 0.03% Day Change: 0.00 | |
| Week Change: -17.58% Year-to-date Change: -46.6% | |
| FOSL Links: Profile News Message Board | |
| Charts:- Daily , Weekly | |
| Add FOSL to Watchlist: View: Get Complete FOSL Trend Analysis ➞ | |
 | ENV Envestnet, Inc. |
| Sector: Services & Goods | |
| SubSector: Business Services | |
| MarketCap: 3114.02 Millions | |
| Recent Price: 62.22 Smart Investing & Trading Score: 100 | |
| Day Percent Change: 0.03% Day Change: 0.02 | |
| Week Change: 8.59% Year-to-date Change: 25.7% | |
| ENV Links: Profile News Message Board | |
| Charts:- Daily , Weekly | |
| Add ENV to Watchlist: View: Get Complete ENV Trend Analysis ➞ | |
 | DOOR Masonite International Corporation |
| Sector: Industrials | |
| SubSector: General Building Materials | |
| MarketCap: 1220.53 Millions | |
| Recent Price: 131.39 Smart Investing & Trading Score: 83 | |
| Day Percent Change: 0.03% Day Change: 0.04 | |
| Week Change: 0.37% Year-to-date Change: 55.2% | |
| DOOR Links: Profile News Message Board | |
| Charts:- Daily , Weekly | |
| Add DOOR to Watchlist: View: Get Complete DOOR Trend Analysis ➞ | |
| Too many stocks? View smallcap stocks filtered by marketcap & sector |
| Marketcap: All SmallCap Stocks (default-no microcap), Large, Mid-Range, Small & MicroCap |
| Sector: Tech, Finance, Energy, Staples, Retail, Industrial, Materials, Utilities & Medical |
|
Best Stocks Today 12Stocks.com |
© 2024 12Stocks.com Terms & Conditions Privacy Contact Us
All Information Provided Only For Education And Not To Be Used For Investing or Trading. See Terms & Conditions


One More Thing ... Get Best Stocks Delivered Daily!
Never Ever Miss A Move With Our Top Ten Stocks Lists
Find Best Stocks In Any Market - Bull or Bear Market
Take A Peek At Our Top Ten Stocks Lists: Daily, Weekly, Year-to-Date & Top Trends
Find Best Stocks In Any Market - Bull or Bear Market
Take A Peek At Our Top Ten Stocks Lists: Daily, Weekly, Year-to-Date & Top Trends
Smallcap Stocks With Best Up Trends [0-bearish to 100-bullish]: Badger Meter[100], Cullinan Oncology[100], Oscar Health[100], NextNav [100], EchoStar [100], Victory Capital[100], Macatawa Bank[100], IMAX [100], Envestnet [100], ALX Oncology[100], Argan [95]
Best Smallcap Stocks Year-to-Date:
Agenus [500.31%], CareMax [417.53%], Janux [348.12%], Viking [247.5%], Alpine Immune[238.5%], Super Micro[226.63%], Longboard [194.76%], Arcutis Bio[192.57%], Vera [161.3%], Avidity Biosciences[154.87%], Hippo [128.32%] Best Smallcap Stocks This Week:
Macatawa Bank[44.42%], 23andMe Holding[33.3%], ProKidney [32%], Snap One[29.73%], Vertex Energy[25.96%], ALX Oncology[20.64%], Vanda [20.63%], Expensify [18.37%], Badger Meter[16.72%], ContextLogic [15%], Cullinan Oncology[13.89%] Best Smallcap Stocks Daily:
23andMe Holding[65.91%], Vertex Energy[33.78%], Zura Bio[17.20%], Badger Meter[16.65%], ContextLogic [15.81%], Expensify [15.23%], Montrose Environmental[12.84%], Vaxxinity [10.05%], Cipher Mining[8.65%], FiscalNote [8.61%], Vuzix [8.15%]