
 Login Sign Up


| |||||
 |  | ||||

| 12Stocks.com Market Intelligence |
Best SmallCap Stocks
|
| In a hurry? Small Cap Stock Lists: Performance Trends Table, Stock Charts
Sort Small Cap stocks: Daily, Weekly, Year-to-Date, Market Cap & Trends. Filter Small Cap stocks list by sector: Show all, Tech, Finance, Energy, Staples, Retail, Industrial, Materials, Utilities and HealthCare Filter Small Cap stocks list by size: All Large Medium Small and MicroCap |
| 12Stocks.com Small Cap Stocks Performances & Trends Daily | |||||||||
|
|  The overall Smart Investing & Trading Score is 56 (0-bearish to 100-bullish) which puts Small Cap index in short term neutral trend. The Smart Investing & Trading Score from previous trading session is 44 and hence an improvement of trend.
| ||||||||
Here are the Smart Investing & Trading Scores of the most requested small cap stocks at 12Stocks.com (click stock name for detailed review):
|


| 12Stocks.com: Investing in Smallcap Index with Stocks | |
|
The following table helps investors and traders sort through current performance and trends (as measured by Smart Investing & Trading Score) of various
stocks in the Smallcap Index. Quick View: Move mouse or cursor over stock symbol (ticker) to view short-term technical chart and over stock name to view long term chart. Click on  to add stock symbol to your watchlist and to add stock symbol to your watchlist and  to view watchlist. Click on any ticker or stock name for detailed market intelligence report for that stock. to view watchlist. Click on any ticker or stock name for detailed market intelligence report for that stock. |
12Stocks.com Performance of Stocks in Smallcap Index
| Ticker | Stock Name | Watchlist | Category | Recent Price | Smart Investing & Trading Score | Change % | YTD Change% |
| EMBC | Embecta |   | Health Care | 10.31 | 52 | -0.87 | -46.04% |
| UVV | Universal | | Consumer Staples | 50.80 | 57 | -0.88 | -24.54% |
| SONO | Sonos | | Technology | 16.97 | 53 | -0.88 | -0.99% |
| NWN | Northwest Natural | | Utilities | 38.32 | 100 | -0.88 | -1.59% |
| ENTA | Enanta | | Health Care | 12.37 | 46 | -0.88 | 31.46% |
| MCS | Marcus | | Services & Goods | 13.35 | 55 | -0.89 | -8.44% |
| ROIC | Retail Opportunity | | Financials | 12.25 | 74 | -0.89 | -12.69% |
| HZO | MarineMax | | Services & Goods | 25.37 | 10 | -0.90 | -34.78% |
| SMBC | Southern Missouri | | Financials | 40.94 | 22 | -0.90 | -23.32% |
| OGS | ONE Gas | | Utilities | 63.95 | 63 | -0.91 | 0.36% |
| ALE | ALLETE | | Utilities | 59.02 | 86 | -0.92 | -3.50% |
| RDNT | RadNet | | Health Care | 48.40 | 83 | -0.92 | 39.20% |
| SGH | SMART Global | | Technology | 18.34 | 10 | -0.92 | -3.12% |
| TDUP | ThredUp | | Services & Goods | 1.61 | 42 | -0.92 | -28.76% |
| HCI | HCI Group | | Financials | 115.00 | 78 | -0.93 | 31.58% |
| PRCT | PROCEPT BioRobotics | | Health Care | 51.79 | 83 | -0.94 | 22.32% |
| FRME | First Merchants | | Financials | 34.13 | 93 | -0.96 | -7.96% |
| WERN | Werner Enterprises | | Transports | 34.74 | 10 | -0.97 | -18.01% |
| ACEL | Accel Entertainment | | Services & Goods | 11.19 | 76 | -0.97 | 8.96% |
| PECO | Phillips Edison | | Financials | 32.61 | 7 | -0.97 | -11.46% |
| BFS | Saul Centers | | Financials | 35.53 | 28 | -0.98 | -9.52% |
| CPK | Chesapeake Utilities | | Utilities | 105.13 | 80 | -0.98 | -0.47% |
| EQBK | Equity Bancshares | | Financials | 33.31 | 86 | -0.98 | -1.74% |
| LNN | Lindsay | | Industrials | 116.24 | 54 | -0.99 | -10.00% |
| ATRI | Atrion | | Health Care | 395.01 | 68 | -0.99 | 4.28% |


| Too many stocks? View smallcap stocks filtered by marketcap & sector |
| Marketcap: All SmallCap Stocks (default-no microcap), Large, Mid-Range, Small |
| Smallcap Sector: Tech, Finance, Energy, Staples, Retail, Industrial, Materials, & Medical |
|
Get the most comprehensive stock market coverage daily at 12Stocks.com ➞ Best Stocks Today ➞ Best Stocks Weekly ➞ Best Stocks Year-to-Date ➞ Best Stocks Trends ➞  Best Stocks Today 12Stocks.com Best Nasdaq Stocks ➞ Best S&P 500 Stocks ➞ Best Tech Stocks ➞ Best Biotech Stocks ➞ |
| Detailed Overview of SmallCap Stocks |
| SmallCap Technical Overview, Leaders & Laggards, Top SmallCap ETF Funds & Detailed SmallCap Stocks List, Charts, Trends & More |
| Smallcap: Technical Analysis, Trends & YTD Performance | |
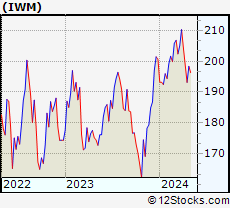
| SmallCap segment as represented by
IWM, an exchange-traded fund [ETF], holds basket of thousands of smallcap stocks from across all major sectors of the US stock market. The smallcap index (contains stocks like Riverbed & Sotheby's) is down by -1.16% and is currently underperforming the overall market by -7.3% year-to-date. Below is a quick view of technical charts and trends: | |
 IWM Weekly Chart |
|
| Long Term Trend: Good | |
| Medium Term Trend: Not Good | |
 IWM Daily Chart |
|
| Short Term Trend: Very Good | |
| Overall Trend Score: 56 | |
| YTD Performance: -1.16% | |
| **Trend Scores & Views Are Only For Educational Purposes And Not For Investing | |
| 12Stocks.com: Top Performing Small Cap Index Stocks | ||||||||||||||||||||||||||||||||||||||||||||||||
 The top performing Small Cap Index stocks year to date are
Now, more recently, over last week, the top performing Small Cap Index stocks on the move are


|
||||||||||||||||||||||||||||||||||||||||||||||||
| 12Stocks.com: Investing in Smallcap Index using Exchange Traded Funds | |
|
The following table shows list of key exchange traded funds (ETF) that
help investors track Smallcap index. The following list also includes leveraged ETF funds that track twice or thrice the daily returns of Smallcap indices. Short or inverse ETF funds move in the opposite direction to the index they track and are useful during market pullbacks or during bear markets. Quick View: Move mouse or cursor over ETF symbol (ticker) to view short-term technical chart and over ETF name to view long term chart. Click on ticker or stock name for detailed view. Click on to add stock symbol to your watchlist and to view watchlist. |
12Stocks.com List of ETFs that track Smallcap Index
| Ticker | ETF Name | Watchlist | Recent Price | Smart Investing & Trading Score | Change % | Week % | Year-to-date % |
| IWM | iShares Russell 2000 | | 198.39 | 56 | 0.97 | 2.72 | -1.16% |
| IJR | iShares Core S&P Small-Cap | | 105.65 | 85 | 0.75 | 2.35 | -2.4% |
| VTWO | Vanguard Russell 2000 ETF | | 80.22 | 70 | 0.97 | 2.74 | -1.09% |
| IWN | iShares Russell 2000 Value | | 151.14 | 75 | 0.64 | 2.27 | -2.7% |
| IWO | iShares Russell 2000 Growth | | 253.09 | 58 | 1.29 | 3.18 | 0.34% |
| IJS | iShares S&P Small-Cap 600 Value | | 97.19 | 67 | 0.52 | 1.65 | -5.7% |
| IJT | iShares S&P Small-Cap 600 Growth | | 126.09 | 70 | 0.82 | 3.17 | 0.76% |
| XSLV | PowerShares S&P SmallCap Low Volatil ETF | | 42.72 | 80 | 0.42 | 1.28 | -3.24% |
| SAA | ProShares Ultra SmallCap600 | | 23.04 | 65 | 1.68 | 5.69 | -7.66% |
| SBB | ProShares Short SmallCap600 | | 16.39 | 33 | -0.70 | -2.7 | 2.86% |
| SDD | ProShares UltraShort SmallCap600 | | 19.35 | 35 | -1.17 | -4.87 | 5.01% |
| SMLV | SPDR SSGA US Small Cap Low Volatil ETF | | 107.52 | 80 | 0.18 | 1.35 | -4.44% |
| 12Stocks.com: Charts, Trends, Fundamental Data and Performances of SmallCap Stocks | |
|
We now take in-depth look at all SmallCap stocks including charts, multi-period performances and overall trends (as measured by Smart Investing & Trading Score). One can sort SmallCap stocks (click link to choose) by Daily, Weekly and by Year-to-Date performances. Also, one can sort by size of the company or by market capitalization. |
| Select Your Default Chart Type: | |||||
| |||||
| Click on stock symbol or name for detailed view. Click on to add stock symbol to your watchlist and to view watchlist. Quick View: Move mouse or cursor over "Daily" to quickly view daily technical stock chart and over "Weekly" to view weekly technical stock chart. | |||||

 | EMBC Embecta Corp. |
| Sector: Health Care | |
| SubSector: Medical Instruments & Supplies | |
| MarketCap: 1260 Millions | |
| Recent Price: 10.31 Smart Investing & Trading Score: 52 | |
| Day Percent Change: -0.87% Day Change: -0.09 | |
| Week Change: -2.92% Year-to-date Change: -46.0% | |
| EMBC Links: Profile News Message Board | |
| Charts:- Daily , Weekly | |
| Add EMBC to Watchlist: View: Get Complete EMBC Trend Analysis ➞ | |
 | UVV Universal Corporation |
| Sector: Consumer Staples | |
| SubSector: Tobacco Products, Other | |
| MarketCap: 1107.7 Millions | |
| Recent Price: 50.80 Smart Investing & Trading Score: 57 | |
| Day Percent Change: -0.88% Day Change: -0.45 | |
| Week Change: -1.28% Year-to-date Change: -24.5% | |
| UVV Links: Profile News Message Board | |
| Charts:- Daily , Weekly | |
| Add UVV to Watchlist: View: Get Complete UVV Trend Analysis ➞ | |
 | SONO Sonos, Inc. |
| Sector: Technology | |
| SubSector: Diversified Electronics | |
| MarketCap: 1047.96 Millions | |
| Recent Price: 16.97 Smart Investing & Trading Score: 53 | |
| Day Percent Change: -0.88% Day Change: -0.15 | |
| Week Change: 0.41% Year-to-date Change: -1.0% | |
| SONO Links: Profile News Message Board | |
| Charts:- Daily , Weekly | |
| Add SONO to Watchlist: View: Get Complete SONO Trend Analysis ➞ | |
 | NWN Northwest Natural Holding Company |
| Sector: Utilities | |
| SubSector: Gas Utilities | |
| MarketCap: 2058.17 Millions | |
| Recent Price: 38.32 Smart Investing & Trading Score: 100 | |
| Day Percent Change: -0.88% Day Change: -0.34 | |
| Week Change: 1.7% Year-to-date Change: -1.6% | |
| NWN Links: Profile News Message Board | |
| Charts:- Daily , Weekly | |
| Add NWN to Watchlist: View: Get Complete NWN Trend Analysis ➞ | |
 | ENTA Enanta Pharmaceuticals, Inc. |
| Sector: Health Care | |
| SubSector: Biotechnology | |
| MarketCap: 998.385 Millions | |
| Recent Price: 12.37 Smart Investing & Trading Score: 46 | |
| Day Percent Change: -0.88% Day Change: -0.11 | |
| Week Change: -7.13% Year-to-date Change: 31.5% | |
| ENTA Links: Profile News Message Board | |
| Charts:- Daily , Weekly | |
| Add ENTA to Watchlist: View: Get Complete ENTA Trend Analysis ➞ | |
 | MCS The Marcus Corporation |
| Sector: Services & Goods | |
| SubSector: Entertainment - Diversified | |
| MarketCap: 441.437 Millions | |
| Recent Price: 13.35 Smart Investing & Trading Score: 55 | |
| Day Percent Change: -0.89% Day Change: -0.12 | |
| Week Change: 1.06% Year-to-date Change: -8.4% | |
| MCS Links: Profile News Message Board | |
| Charts:- Daily , Weekly | |
| Add MCS to Watchlist: View: Get Complete MCS Trend Analysis ➞ | |
 | ROIC Retail Opportunity Investments Corp. |
| Sector: Financials | |
| SubSector: REIT - Retail | |
| MarketCap: 943.414 Millions | |
| Recent Price: 12.25 Smart Investing & Trading Score: 74 | |
| Day Percent Change: -0.89% Day Change: -0.11 | |
| Week Change: -0.24% Year-to-date Change: -12.7% | |
| ROIC Links: Profile News Message Board | |
| Charts:- Daily , Weekly | |
| Add ROIC to Watchlist: View: Get Complete ROIC Trend Analysis ➞ | |
 | HZO MarineMax, Inc. |
| Sector: Services & Goods | |
| SubSector: Specialty Retail, Other | |
| MarketCap: 234.744 Millions | |
| Recent Price: 25.37 Smart Investing & Trading Score: 10 | |
| Day Percent Change: -0.90% Day Change: -0.23 | |
| Week Change: -9.49% Year-to-date Change: -34.8% | |
| HZO Links: Profile News Message Board | |
| Charts:- Daily , Weekly | |
| Add HZO to Watchlist: View: Get Complete HZO Trend Analysis ➞ | |
 | SMBC Southern Missouri Bancorp, Inc. |
| Sector: Financials | |
| SubSector: Savings & Loans | |
| MarketCap: 272.53 Millions | |
| Recent Price: 40.94 Smart Investing & Trading Score: 22 | |
| Day Percent Change: -0.90% Day Change: -0.37 | |
| Week Change: -1.66% Year-to-date Change: -23.3% | |
| SMBC Links: Profile News Message Board | |
| Charts:- Daily , Weekly | |
| Add SMBC to Watchlist: View: Get Complete SMBC Trend Analysis ➞ | |
 | OGS ONE Gas, Inc. |
| Sector: Utilities | |
| SubSector: Gas Utilities | |
| MarketCap: 4051.17 Millions | |
| Recent Price: 63.95 Smart Investing & Trading Score: 63 | |
| Day Percent Change: -0.91% Day Change: -0.59 | |
| Week Change: -0.68% Year-to-date Change: 0.4% | |
| OGS Links: Profile News Message Board | |
| Charts:- Daily , Weekly | |
| Add OGS to Watchlist: View: Get Complete OGS Trend Analysis ➞ | |
 | ALE ALLETE, Inc. |
| Sector: Utilities | |
| SubSector: Diversified Utilities | |
| MarketCap: 3145.4 Millions | |
| Recent Price: 59.02 Smart Investing & Trading Score: 86 | |
| Day Percent Change: -0.92% Day Change: -0.55 | |
| Week Change: -1.16% Year-to-date Change: -3.5% | |
| ALE Links: Profile News Message Board | |
| Charts:- Daily , Weekly | |
| Add ALE to Watchlist: View: Get Complete ALE Trend Analysis ➞ | |
 | RDNT RadNet, Inc. |
| Sector: Health Care | |
| SubSector: Medical Laboratories & Research | |
| MarketCap: 473.2 Millions | |
| Recent Price: 48.40 Smart Investing & Trading Score: 83 | |
| Day Percent Change: -0.92% Day Change: -0.45 | |
| Week Change: 4.04% Year-to-date Change: 39.2% | |
| RDNT Links: Profile News Message Board | |
| Charts:- Daily , Weekly | |
| Add RDNT to Watchlist: View: Get Complete RDNT Trend Analysis ➞ | |
 | SGH SMART Global Holdings, Inc. |
| Sector: Technology | |
| SubSector: Semiconductor- Memory Chips | |
| MarketCap: 657.8 Millions | |
| Recent Price: 18.34 Smart Investing & Trading Score: 10 | |
| Day Percent Change: -0.92% Day Change: -0.17 | |
| Week Change: 8.39% Year-to-date Change: -3.1% | |
| SGH Links: Profile News Message Board | |
| Charts:- Daily , Weekly | |
| Add SGH to Watchlist: View: Get Complete SGH Trend Analysis ➞ | |
 | TDUP ThredUp Inc. |
| Sector: Services & Goods | |
| SubSector: Internet Retail | |
| MarketCap: 258 Millions | |
| Recent Price: 1.61 Smart Investing & Trading Score: 42 | |
| Day Percent Change: -0.92% Day Change: -0.01 | |
| Week Change: 3.21% Year-to-date Change: -28.8% | |
| TDUP Links: Profile News Message Board | |
| Charts:- Daily , Weekly | |
| Add TDUP to Watchlist: View: Get Complete TDUP Trend Analysis ➞ | |
 | HCI HCI Group, Inc. |
| Sector: Financials | |
| SubSector: Property & Casualty Insurance | |
| MarketCap: 297.412 Millions | |
| Recent Price: 115.00 Smart Investing & Trading Score: 78 | |
| Day Percent Change: -0.93% Day Change: -1.08 | |
| Week Change: 2.78% Year-to-date Change: 31.6% | |
| HCI Links: Profile News Message Board | |
| Charts:- Daily , Weekly | |
| Add HCI to Watchlist: View: Get Complete HCI Trend Analysis ➞ | |
 | PRCT PROCEPT BioRobotics Corporation |
| Sector: Health Care | |
| SubSector: Medical Devices | |
| MarketCap: 1600 Millions | |
| Recent Price: 51.79 Smart Investing & Trading Score: 83 | |
| Day Percent Change: -0.94% Day Change: -0.49 | |
| Week Change: 3.19% Year-to-date Change: 22.3% | |
| PRCT Links: Profile News Message Board | |
| Charts:- Daily , Weekly | |
| Add PRCT to Watchlist: View: Get Complete PRCT Trend Analysis ➞ | |
 | FRME First Merchants Corporation |
| Sector: Financials | |
| SubSector: Regional - Midwest Banks | |
| MarketCap: 1490.4 Millions | |
| Recent Price: 34.13 Smart Investing & Trading Score: 93 | |
| Day Percent Change: -0.96% Day Change: -0.33 | |
| Week Change: 0.18% Year-to-date Change: -8.0% | |
| FRME Links: Profile News Message Board | |
| Charts:- Daily , Weekly | |
| Add FRME to Watchlist: View: Get Complete FRME Trend Analysis ➞ | |
 | WERN Werner Enterprises, Inc. |
| Sector: Transports | |
| SubSector: Trucking | |
| MarketCap: 2409.65 Millions | |
| Recent Price: 34.74 Smart Investing & Trading Score: 10 | |
| Day Percent Change: -0.97% Day Change: -0.34 | |
| Week Change: -3.12% Year-to-date Change: -18.0% | |
| WERN Links: Profile News Message Board | |
| Charts:- Daily , Weekly | |
| Add WERN to Watchlist: View: Get Complete WERN Trend Analysis ➞ | |
 | ACEL Accel Entertainment, Inc. |
| Sector: Services & Goods | |
| SubSector: Gaming Activities | |
| MarketCap: 486.589 Millions | |
| Recent Price: 11.19 Smart Investing & Trading Score: 76 | |
| Day Percent Change: -0.97% Day Change: -0.11 | |
| Week Change: -1.58% Year-to-date Change: 9.0% | |
| ACEL Links: Profile News Message Board | |
| Charts:- Daily , Weekly | |
| Add ACEL to Watchlist: View: Get Complete ACEL Trend Analysis ➞ | |
 | PECO Phillips Edison & Company, Inc. |
| Sector: Financials | |
| SubSector: REIT - Retail | |
| MarketCap: 3920 Millions | |
| Recent Price: 32.61 Smart Investing & Trading Score: 7 | |
| Day Percent Change: -0.97% Day Change: -0.32 | |
| Week Change: -1.24% Year-to-date Change: -11.5% | |
| PECO Links: Profile News Message Board | |
| Charts:- Daily , Weekly | |
| Add PECO to Watchlist: View: Get Complete PECO Trend Analysis ➞ | |
 | BFS Saul Centers, Inc. |
| Sector: Financials | |
| SubSector: REIT - Retail | |
| MarketCap: 689.914 Millions | |
| Recent Price: 35.53 Smart Investing & Trading Score: 28 | |
| Day Percent Change: -0.98% Day Change: -0.35 | |
| Week Change: -2.28% Year-to-date Change: -9.5% | |
| BFS Links: Profile News Message Board | |
| Charts:- Daily , Weekly | |
| Add BFS to Watchlist: View: Get Complete BFS Trend Analysis ➞ | |
 | CPK Chesapeake Utilities Corporation |
| Sector: Utilities | |
| SubSector: Gas Utilities | |
| MarketCap: 1465.77 Millions | |
| Recent Price: 105.13 Smart Investing & Trading Score: 80 | |
| Day Percent Change: -0.98% Day Change: -1.04 | |
| Week Change: 0.31% Year-to-date Change: -0.5% | |
| CPK Links: Profile News Message Board | |
| Charts:- Daily , Weekly | |
| Add CPK to Watchlist: View: Get Complete CPK Trend Analysis ➞ | |
 | EQBK Equity Bancshares, Inc. |
| Sector: Financials | |
| SubSector: Regional - Midwest Banks | |
| MarketCap: 272.87 Millions | |
| Recent Price: 33.31 Smart Investing & Trading Score: 86 | |
| Day Percent Change: -0.98% Day Change: -0.33 | |
| Week Change: 2.75% Year-to-date Change: -1.7% | |
| EQBK Links: Profile News Message Board | |
| Charts:- Daily , Weekly | |
| Add EQBK to Watchlist: View: Get Complete EQBK Trend Analysis ➞ | |
 | LNN Lindsay Corporation |
| Sector: Industrials | |
| SubSector: Farm & Construction Machinery | |
| MarketCap: 1097.57 Millions | |
| Recent Price: 116.24 Smart Investing & Trading Score: 54 | |
| Day Percent Change: -0.99% Day Change: -1.16 | |
| Week Change: -0.96% Year-to-date Change: -10.0% | |
| LNN Links: Profile News Message Board | |
| Charts:- Daily , Weekly | |
| Add LNN to Watchlist: View: Get Complete LNN Trend Analysis ➞ | |
 | ATRI Atrion Corporation |
| Sector: Health Care | |
| SubSector: Medical Instruments & Supplies | |
| MarketCap: 1234.6 Millions | |
| Recent Price: 395.01 Smart Investing & Trading Score: 68 | |
| Day Percent Change: -0.99% Day Change: -3.96 | |
| Week Change: -1.82% Year-to-date Change: 4.3% | |
| ATRI Links: Profile News Message Board | |
| Charts:- Daily , Weekly | |
| Add ATRI to Watchlist: View: Get Complete ATRI Trend Analysis ➞ | |
| Too many stocks? View smallcap stocks filtered by marketcap & sector |
| Marketcap: All SmallCap Stocks (default-no microcap), Large, Mid-Range, Small & MicroCap |
| Sector: Tech, Finance, Energy, Staples, Retail, Industrial, Materials, Utilities & Medical |
|
Best Stocks Today 12Stocks.com |
© 2024 12Stocks.com Terms & Conditions Privacy Contact Us
All Information Provided Only For Education And Not To Be Used For Investing or Trading. See Terms & Conditions


One More Thing ... Get Best Stocks Delivered Daily!
Never Ever Miss A Move With Our Top Ten Stocks Lists
Find Best Stocks In Any Market - Bull or Bear Market
Take A Peek At Our Top Ten Stocks Lists: Daily, Weekly, Year-to-Date & Top Trends
Find Best Stocks In Any Market - Bull or Bear Market
Take A Peek At Our Top Ten Stocks Lists: Daily, Weekly, Year-to-Date & Top Trends
Smallcap Stocks With Best Up Trends [0-bearish to 100-bullish]: Cullinan Oncology[100], NextNav [100], MBIA [100], Reservoir Media[100], B. Riley[100], Braemar Hotels[100], Wolverine World[100], Haemonetics [100], Pactiv Evergreen[100], Benchmark Electronics[100], Uniti Group[100]
Best Smallcap Stocks Year-to-Date:
CareMax [543.3%], Janux [341.65%], Viking [299.3%], Alpine Immune[239.08%], Longboard [222.75%], Super Micro[201.64%], Avidity Biosciences[169.47%], Arcutis Bio[162.23%], Vera [156.27%], Cullinan Oncology[148.16%], Hippo [139.52%] Best Smallcap Stocks This Week:
Matterport [170.98%], B. Riley[84.19%], Cullinan Oncology[61.56%], Seres [47.35%], Universal Logistics[36.84%], Tutor Perini[33.89%], Zura Bio[33.23%], Riot Blockchain[30.67%], IGM Biosciences[30.56%], Impinj [29.74%], Sonic Automotive[28.14%] Best Smallcap Stocks Daily:
Universal Logistics[39.37%], Cullinan Oncology[31.43%], Tutor Perini[28.01%], Zura Bio[26.72%], IGM Biosciences[23.36%], U.S. Silica[21.67%], Maxeon Solar[20.46%], Exponent [19.49%], TPI Composites[16.32%], OptimizeRx [15.07%], NextNav [13.97%]