
 Login Sign Up


| |||||
 |  | ||||

| 12Stocks.com Market Intelligence |
Best SmallCap Stocks
|
| In a hurry? Small Cap Stock Lists: Performance Trends Table, Stock Charts
Sort Small Cap stocks: Daily, Weekly, Year-to-Date, Market Cap & Trends. Filter Small Cap stocks list by sector: Show all, Tech, Finance, Energy, Staples, Retail, Industrial, Materials, Utilities and HealthCare Filter Small Cap stocks list by size: All Large Medium Small and MicroCap |
| 12Stocks.com Small Cap Stocks Performances & Trends Daily | |||||||||
|
|  The overall Smart Investing & Trading Score is 69 (0-bearish to 100-bullish) which puts Small Cap index in short term neutral to bullish trend. The Smart Investing & Trading Score from previous trading session is 49 and hence an improvement of trend.
| ||||||||
Here are the Smart Investing & Trading Scores of the most requested small cap stocks at 12Stocks.com (click stock name for detailed review):
|


| 12Stocks.com: Investing in Smallcap Index with Stocks | |
|
The following table helps investors and traders sort through current performance and trends (as measured by Smart Investing & Trading Score) of various
stocks in the Smallcap Index. Quick View: Move mouse or cursor over stock symbol (ticker) to view short-term technical chart and over stock name to view long term chart. Click on  to add stock symbol to your watchlist and to add stock symbol to your watchlist and  to view watchlist. Click on any ticker or stock name for detailed market intelligence report for that stock. to view watchlist. Click on any ticker or stock name for detailed market intelligence report for that stock. |
12Stocks.com Performance of Stocks in Smallcap Index
| Ticker | Stock Name | Watchlist | Category | Recent Price | Smart Investing & Trading Score | Change % | YTD Change% |
| FORR | Forrester Research |   | Services & Goods | 18.19 | 37 | -0.82 | -32.15% |
| UE | Urban Edge | | Financials | 17.00 | 52 | -0.82 | -7.10% |
| ATSG | Air Transport | | Transports | 13.08 | 95 | -0.83 | -25.72% |
| OLO | Olo | | Technology | 4.79 | 38 | -0.83 | -16.26% |
| ZIP | ZipRecruiter | | Industrials | 10.19 | 20 | -0.83 | -27.29% |
| NTCT | NetScout Systems | | Technology | 20.09 | 74 | -0.84 | -8.47% |
| HEES | H&E Equipment | | Transports | 46.65 | 17 | -0.85 | -10.84% |
| RLAY | Relay | | Health Care | 7.02 | 67 | -0.85 | -36.18% |
| HMN | Horace Mann | | Financials | 37.52 | 83 | -0.87 | 14.74% |
| HQI | HireQuest | | Services & Goods | 12.48 | 17 | -0.87 | -18.70% |
| AHCO | AdaptHealth | | Health Care | 10.26 | 70 | -0.87 | 40.74% |
| INTA | Intapp | | Technology | 30.89 | 25 | -0.87 | -19.07% |
| SFL | SFL | | Transports | 13.51 | 90 | -0.88 | 19.77% |
| NYMT | New York | | Financials | 6.21 | 0 | -0.88 | -27.20% |
| EGHT | 8x8 | | Technology | 2.23 | 39 | -0.89 | -41.01% |
| RDNT | RadNet | | Health Care | 51.20 | 100 | -0.89 | 47.25% |
| UUUU | Energy Fuels | | Materials | 5.54 | 49 | -0.89 | -22.95% |
| LZ | LegalZoom.com | | Industrials | 12.05 | 25 | -0.90 | 6.12% |
| BELFB | Bel Fuse | | Technology | 58.04 | 50 | -0.90 | -13.07% |
| FIBK | First Interstate | | Financials | 27.64 | 83 | -0.90 | -10.11% |
| HCAT | Health Catalyst | | Technology | 6.48 | 64 | -0.92 | -30.02% |
| OSG | Overseas Shipholding | | Transports | 6.32 | 90 | -0.94 | 19.92% |
| VRNS | Varonis Systems | | Technology | 43.77 | 15 | -0.95 | -3.33% |
| ACIW | ACI Worldwide | | Technology | 35.12 | 95 | -0.96 | 14.77% |
| THS | TreeHouse Foods | | Consumer Staples | 37.26 | 68 | -0.98 | -10.11% |


| Too many stocks? View smallcap stocks filtered by marketcap & sector |
| Marketcap: All SmallCap Stocks (default-no microcap), Large, Mid-Range, Small |
| Smallcap Sector: Tech, Finance, Energy, Staples, Retail, Industrial, Materials, & Medical |
|
Get the most comprehensive stock market coverage daily at 12Stocks.com ➞ Best Stocks Today ➞ Best Stocks Weekly ➞ Best Stocks Year-to-Date ➞ Best Stocks Trends ➞  Best Stocks Today 12Stocks.com Best Nasdaq Stocks ➞ Best S&P 500 Stocks ➞ Best Tech Stocks ➞ Best Biotech Stocks ➞ |
| Detailed Overview of SmallCap Stocks |
| SmallCap Technical Overview, Leaders & Laggards, Top SmallCap ETF Funds & Detailed SmallCap Stocks List, Charts, Trends & More |
| Smallcap: Technical Analysis, Trends & YTD Performance | |
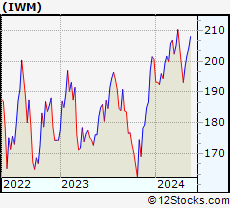
| SmallCap segment as represented by
IWM, an exchange-traded fund [ETF], holds basket of thousands of smallcap stocks from across all major sectors of the US stock market. The smallcap index (contains stocks like Riverbed & Sotheby's) is up by 0.59% and is currently underperforming the overall market by -6.29% year-to-date. Below is a quick view of technical charts and trends: | |
 IWM Weekly Chart |
|
| Long Term Trend: Not Good | |
| Medium Term Trend: Very Good | |
 IWM Daily Chart |
|
| Short Term Trend: Very Good | |
| Overall Trend Score: 69 | |
| YTD Performance: 0.59% | |
| **Trend Scores & Views Are Only For Educational Purposes And Not For Investing | |
| 12Stocks.com: Top Performing Small Cap Index Stocks | ||||||||||||||||||||||||||||||||||||||||||||||||
 The top performing Small Cap Index stocks year to date are
Now, more recently, over last week, the top performing Small Cap Index stocks on the move are


|
||||||||||||||||||||||||||||||||||||||||||||||||
| 12Stocks.com: Investing in Smallcap Index using Exchange Traded Funds | |
|
The following table shows list of key exchange traded funds (ETF) that
help investors track Smallcap index. The following list also includes leveraged ETF funds that track twice or thrice the daily returns of Smallcap indices. Short or inverse ETF funds move in the opposite direction to the index they track and are useful during market pullbacks or during bear markets. Quick View: Move mouse or cursor over ETF symbol (ticker) to view short-term technical chart and over ETF name to view long term chart. Click on ticker or stock name for detailed view. Click on to add stock symbol to your watchlist and to view watchlist. |
12Stocks.com List of ETFs that track Smallcap Index
| Ticker | ETF Name | Watchlist | Recent Price | Smart Investing & Trading Score | Change % | Week % | Year-to-date % |
| IWM | iShares Russell 2000 | | 201.90 | 69 | 0.99 | 1.77 | 0.59% |
| IJR | iShares Core S&P Small-Cap | | 107.13 | 82 | 0.75 | 1.4 | -1.03% |
| VTWO | Vanguard Russell 2000 ETF | | 81.61 | 69 | 0.94 | 1.73 | 0.63% |
| IWN | iShares Russell 2000 Value | | 154.21 | 100 | 0.87 | 2.03 | -0.72% |
| IJS | iShares S&P Small-Cap 600 Value | | 98.72 | 64 | 0.71 | 1.57 | -4.22% |
| IWO | iShares Russell 2000 Growth | | 256.87 | 57 | 0.99 | 1.49 | 1.84% |
| IJT | iShares S&P Small-Cap 600 Growth | | 127.76 | 95 | 0.82 | 1.32 | 2.09% |
| XSLV | PowerShares S&P SmallCap Low Volatil ETF | | 43.22 | 87 | 0.19 | 1.17 | -2.11% |
| SBB | ProShares Short SmallCap600 | | 16.16 | 13 | -1.28 | -1.37 | 1.44% |
| SDD | ProShares UltraShort SmallCap600 | | 18.84 | 23 | -2.41 | -2.61 | 2.27% |
| SAA | ProShares Ultra SmallCap600 | | 23.59 | 69 | 2.86 | 2.39 | -5.45% |
| SMLV | SPDR SSGA US Small Cap Low Volatil ETF | | 109.69 | 87 | 0.78 | 2.01 | -2.52% |
| 12Stocks.com: Charts, Trends, Fundamental Data and Performances of SmallCap Stocks | |
|
We now take in-depth look at all SmallCap stocks including charts, multi-period performances and overall trends (as measured by Smart Investing & Trading Score). One can sort SmallCap stocks (click link to choose) by Daily, Weekly and by Year-to-Date performances. Also, one can sort by size of the company or by market capitalization. |
| Select Your Default Chart Type: | |||||
| |||||
| Click on stock symbol or name for detailed view. Click on to add stock symbol to your watchlist and to view watchlist. Quick View: Move mouse or cursor over "Daily" to quickly view daily technical stock chart and over "Weekly" to view weekly technical stock chart. | |||||

 | FORR Forrester Research, Inc. |
| Sector: Services & Goods | |
| SubSector: Research Services | |
| MarketCap: 473.394 Millions | |
| Recent Price: 18.19 Smart Investing & Trading Score: 37 | |
| Day Percent Change: -0.82% Day Change: -0.15 | |
| Week Change: -3.09% Year-to-date Change: -32.2% | |
| FORR Links: Profile News Message Board | |
| Charts:- Daily , Weekly | |
| Add FORR to Watchlist: View: Get Complete FORR Trend Analysis ➞ | |
 | UE Urban Edge Properties |
| Sector: Financials | |
| SubSector: REIT - Diversified | |
| MarketCap: 1112.33 Millions | |
| Recent Price: 17.00 Smart Investing & Trading Score: 52 | |
| Day Percent Change: -0.82% Day Change: -0.14 | |
| Week Change: 2.97% Year-to-date Change: -7.1% | |
| UE Links: Profile News Message Board | |
| Charts:- Daily , Weekly | |
| Add UE to Watchlist: View: Get Complete UE Trend Analysis ➞ | |
 | ATSG Air Transport Services Group, Inc. |
| Sector: Transports | |
| SubSector: Air Delivery & Freight Services | |
| MarketCap: 1111.68 Millions | |
| Recent Price: 13.08 Smart Investing & Trading Score: 95 | |
| Day Percent Change: -0.83% Day Change: -0.11 | |
| Week Change: 1.32% Year-to-date Change: -25.7% | |
| ATSG Links: Profile News Message Board | |
| Charts:- Daily , Weekly | |
| Add ATSG to Watchlist: View: Get Complete ATSG Trend Analysis ➞ | |
 | OLO Olo Inc. |
| Sector: Technology | |
| SubSector: Software - Application | |
| MarketCap: 1030 Millions | |
| Recent Price: 4.79 Smart Investing & Trading Score: 38 | |
| Day Percent Change: -0.83% Day Change: -0.04 | |
| Week Change: -4.2% Year-to-date Change: -16.3% | |
| OLO Links: Profile News Message Board | |
| Charts:- Daily , Weekly | |
| Add OLO to Watchlist: View: Get Complete OLO Trend Analysis ➞ | |
 | ZIP ZipRecruiter, Inc. |
| Sector: Industrials | |
| SubSector: Staffing & Employment Services | |
| MarketCap: 1730 Millions | |
| Recent Price: 10.19 Smart Investing & Trading Score: 20 | |
| Day Percent Change: -0.83% Day Change: -0.09 | |
| Week Change: -1.64% Year-to-date Change: -27.3% | |
| ZIP Links: Profile News Message Board | |
| Charts:- Daily , Weekly | |
| Add ZIP to Watchlist: View: Get Complete ZIP Trend Analysis ➞ | |
 | NTCT NetScout Systems, Inc. |
| Sector: Technology | |
| SubSector: Business Software & Services | |
| MarketCap: 1657.28 Millions | |
| Recent Price: 20.09 Smart Investing & Trading Score: 74 | |
| Day Percent Change: -0.84% Day Change: -0.17 | |
| Week Change: 0.95% Year-to-date Change: -8.5% | |
| NTCT Links: Profile News Message Board | |
| Charts:- Daily , Weekly | |
| Add NTCT to Watchlist: View: Get Complete NTCT Trend Analysis ➞ | |
 | HEES H&E Equipment Services, Inc. |
| Sector: Transports | |
| SubSector: Rental & Leasing Services | |
| MarketCap: 451.944 Millions | |
| Recent Price: 46.65 Smart Investing & Trading Score: 17 | |
| Day Percent Change: -0.85% Day Change: -0.40 | |
| Week Change: -20.46% Year-to-date Change: -10.8% | |
| HEES Links: Profile News Message Board | |
| Charts:- Daily , Weekly | |
| Add HEES to Watchlist: View: Get Complete HEES Trend Analysis ➞ | |
 | RLAY Relay Therapeutics, Inc. |
| Sector: Health Care | |
| SubSector: Biotechnology | |
| MarketCap: 45887 Millions | |
| Recent Price: 7.02 Smart Investing & Trading Score: 67 | |
| Day Percent Change: -0.85% Day Change: -0.06 | |
| Week Change: 10.2% Year-to-date Change: -36.2% | |
| RLAY Links: Profile News Message Board | |
| Charts:- Daily , Weekly | |
| Add RLAY to Watchlist: View: Get Complete RLAY Trend Analysis ➞ | |
 | HMN Horace Mann Educators Corporation |
| Sector: Financials | |
| SubSector: Property & Casualty Insurance | |
| MarketCap: 1545.52 Millions | |
| Recent Price: 37.52 Smart Investing & Trading Score: 83 | |
| Day Percent Change: -0.87% Day Change: -0.33 | |
| Week Change: 2.12% Year-to-date Change: 14.7% | |
| HMN Links: Profile News Message Board | |
| Charts:- Daily , Weekly | |
| Add HMN to Watchlist: View: Get Complete HMN Trend Analysis ➞ | |
 | HQI HireQuest, Inc. |
| Sector: Services & Goods | |
| SubSector: Staffing & Outsourcing Services | |
| MarketCap: 77 Millions | |
| Recent Price: 12.48 Smart Investing & Trading Score: 17 | |
| Day Percent Change: -0.87% Day Change: -0.11 | |
| Week Change: -1.34% Year-to-date Change: -18.7% | |
| HQI Links: Profile News Message Board | |
| Charts:- Daily , Weekly | |
| Add HQI to Watchlist: View: Get Complete HQI Trend Analysis ➞ | |
 | AHCO AdaptHealth Corp. |
| Sector: Health Care | |
| SubSector: Medical Appliances & Equipment | |
| MarketCap: 1084.8 Millions | |
| Recent Price: 10.26 Smart Investing & Trading Score: 70 | |
| Day Percent Change: -0.87% Day Change: -0.09 | |
| Week Change: 3.01% Year-to-date Change: 40.7% | |
| AHCO Links: Profile News Message Board | |
| Charts:- Daily , Weekly | |
| Add AHCO to Watchlist: View: Get Complete AHCO Trend Analysis ➞ | |
 | INTA Intapp, Inc. |
| Sector: Technology | |
| SubSector: Software - Application | |
| MarketCap: 2820 Millions | |
| Recent Price: 30.89 Smart Investing & Trading Score: 25 | |
| Day Percent Change: -0.87% Day Change: -0.27 | |
| Week Change: -3.17% Year-to-date Change: -19.1% | |
| INTA Links: Profile News Message Board | |
| Charts:- Daily , Weekly | |
| Add INTA to Watchlist: View: Get Complete INTA Trend Analysis ➞ | |
 | SFL SFL Corporation Ltd. |
| Sector: Transports | |
| SubSector: Shipping | |
| MarketCap: 890.414 Millions | |
| Recent Price: 13.51 Smart Investing & Trading Score: 90 | |
| Day Percent Change: -0.88% Day Change: -0.12 | |
| Week Change: 2.04% Year-to-date Change: 19.8% | |
| SFL Links: Profile News Message Board | |
| Charts:- Daily , Weekly | |
| Add SFL to Watchlist: View: Get Complete SFL Trend Analysis ➞ | |
 | NYMT New York Mortgage Trust, Inc. |
| Sector: Financials | |
| SubSector: Mortgage Investment | |
| MarketCap: 1038.39 Millions | |
| Recent Price: 6.21 Smart Investing & Trading Score: 0 | |
| Day Percent Change: -0.88% Day Change: -0.05 | |
| Week Change: -11.79% Year-to-date Change: -27.2% | |
| NYMT Links: Profile News Message Board | |
| Charts:- Daily , Weekly | |
| Add NYMT to Watchlist: View: Get Complete NYMT Trend Analysis ➞ | |
 | EGHT 8x8, Inc. |
| Sector: Technology | |
| SubSector: Diversified Communication Services | |
| MarketCap: 1861.64 Millions | |
| Recent Price: 2.23 Smart Investing & Trading Score: 39 | |
| Day Percent Change: -0.89% Day Change: -0.02 | |
| Week Change: -1.76% Year-to-date Change: -41.0% | |
| EGHT Links: Profile News Message Board | |
| Charts:- Daily , Weekly | |
| Add EGHT to Watchlist: View: Get Complete EGHT Trend Analysis ➞ | |
 | RDNT RadNet, Inc. |
| Sector: Health Care | |
| SubSector: Medical Laboratories & Research | |
| MarketCap: 473.2 Millions | |
| Recent Price: 51.20 Smart Investing & Trading Score: 100 | |
| Day Percent Change: -0.89% Day Change: -0.46 | |
| Week Change: 5.79% Year-to-date Change: 47.3% | |
| RDNT Links: Profile News Message Board | |
| Charts:- Daily , Weekly | |
| Add RDNT to Watchlist: View: Get Complete RDNT Trend Analysis ➞ | |
 | UUUU Energy Fuels Inc. |
| Sector: Materials | |
| SubSector: Industrial Metals & Minerals | |
| MarketCap: 107.61 Millions | |
| Recent Price: 5.54 Smart Investing & Trading Score: 49 | |
| Day Percent Change: -0.89% Day Change: -0.05 | |
| Week Change: 2.59% Year-to-date Change: -23.0% | |
| UUUU Links: Profile News Message Board | |
| Charts:- Daily , Weekly | |
| Add UUUU to Watchlist: View: Get Complete UUUU Trend Analysis ➞ | |
 | LZ LegalZoom.com, Inc. |
| Sector: Industrials | |
| SubSector: Specialty Business Services | |
| MarketCap: 2330 Millions | |
| Recent Price: 12.05 Smart Investing & Trading Score: 25 | |
| Day Percent Change: -0.90% Day Change: -0.11 | |
| Week Change: -3.48% Year-to-date Change: 6.1% | |
| LZ Links: Profile News Message Board | |
| Charts:- Daily , Weekly | |
| Add LZ to Watchlist: View: Get Complete LZ Trend Analysis ➞ | |
 | BELFB Bel Fuse Inc. |
| Sector: Technology | |
| SubSector: Diversified Electronics | |
| MarketCap: 77.0396 Millions | |
| Recent Price: 58.04 Smart Investing & Trading Score: 50 | |
| Day Percent Change: -0.90% Day Change: -0.53 | |
| Week Change: 0.22% Year-to-date Change: -13.1% | |
| BELFB Links: Profile News Message Board | |
| Charts:- Daily , Weekly | |
| Add BELFB to Watchlist: View: Get Complete BELFB Trend Analysis ➞ | |
 | FIBK First Interstate BancSystem, Inc. |
| Sector: Financials | |
| SubSector: Regional - Pacific Banks | |
| MarketCap: 1797.69 Millions | |
| Recent Price: 27.64 Smart Investing & Trading Score: 83 | |
| Day Percent Change: -0.90% Day Change: -0.25 | |
| Week Change: 2.37% Year-to-date Change: -10.1% | |
| FIBK Links: Profile News Message Board | |
| Charts:- Daily , Weekly | |
| Add FIBK to Watchlist: View: Get Complete FIBK Trend Analysis ➞ | |
 | HCAT Health Catalyst, Inc. |
| Sector: Technology | |
| SubSector: Healthcare Information Services | |
| MarketCap: 983.955 Millions | |
| Recent Price: 6.48 Smart Investing & Trading Score: 64 | |
| Day Percent Change: -0.92% Day Change: -0.06 | |
| Week Change: 7.46% Year-to-date Change: -30.0% | |
| HCAT Links: Profile News Message Board | |
| Charts:- Daily , Weekly | |
| Add HCAT to Watchlist: View: Get Complete HCAT Trend Analysis ➞ | |
 | OSG Overseas Shipholding Group, Inc. |
| Sector: Transports | |
| SubSector: Shipping | |
| MarketCap: 184.814 Millions | |
| Recent Price: 6.32 Smart Investing & Trading Score: 90 | |
| Day Percent Change: -0.94% Day Change: -0.06 | |
| Week Change: 4.81% Year-to-date Change: 19.9% | |
| OSG Links: Profile News Message Board | |
| Charts:- Daily , Weekly | |
| Add OSG to Watchlist: View: Get Complete OSG Trend Analysis ➞ | |
 | VRNS Varonis Systems, Inc. |
| Sector: Technology | |
| SubSector: Technical & System Software | |
| MarketCap: 1715 Millions | |
| Recent Price: 43.77 Smart Investing & Trading Score: 15 | |
| Day Percent Change: -0.95% Day Change: -0.42 | |
| Week Change: -3.44% Year-to-date Change: -3.3% | |
| VRNS Links: Profile News Message Board | |
| Charts:- Daily , Weekly | |
| Add VRNS to Watchlist: View: Get Complete VRNS Trend Analysis ➞ | |
 | ACIW ACI Worldwide, Inc. |
| Sector: Technology | |
| SubSector: Technical & System Software | |
| MarketCap: 2645.7 Millions | |
| Recent Price: 35.12 Smart Investing & Trading Score: 95 | |
| Day Percent Change: -0.96% Day Change: -0.34 | |
| Week Change: 5.47% Year-to-date Change: 14.8% | |
| ACIW Links: Profile News Message Board | |
| Charts:- Daily , Weekly | |
| Add ACIW to Watchlist: View: Get Complete ACIW Trend Analysis ➞ | |
 | THS TreeHouse Foods, Inc. |
| Sector: Consumer Staples | |
| SubSector: Processed & Packaged Goods | |
| MarketCap: 2392.08 Millions | |
| Recent Price: 37.26 Smart Investing & Trading Score: 68 | |
| Day Percent Change: -0.98% Day Change: -0.37 | |
| Week Change: 3.96% Year-to-date Change: -10.1% | |
| THS Links: Profile News Message Board | |
| Charts:- Daily , Weekly | |
| Add THS to Watchlist: View: Get Complete THS Trend Analysis ➞ | |
| Too many stocks? View smallcap stocks filtered by marketcap & sector |
| Marketcap: All SmallCap Stocks (default-no microcap), Large, Mid-Range, Small & MicroCap |
| Sector: Tech, Finance, Energy, Staples, Retail, Industrial, Materials, Utilities & Medical |
|
Best Stocks Today 12Stocks.com |
© 2024 12Stocks.com Terms & Conditions Privacy Contact Us
All Information Provided Only For Education And Not To Be Used For Investing or Trading. See Terms & Conditions


One More Thing ... Get Best Stocks Delivered Daily!
Never Ever Miss A Move With Our Top Ten Stocks Lists
Find Best Stocks In Any Market - Bull or Bear Market
Take A Peek At Our Top Ten Stocks Lists: Daily, Weekly, Year-to-Date & Top Trends
Find Best Stocks In Any Market - Bull or Bear Market
Take A Peek At Our Top Ten Stocks Lists: Daily, Weekly, Year-to-Date & Top Trends
Smallcap Stocks With Best Up Trends [0-bearish to 100-bullish]: Twist Bioscience[100], WideOpenWest [100], Joint [100], FTC Solar[100], Origin Materials[100], Alignment Healthcare[100], Clarus [100], IES [100], Emergent BioSolutions[100], Enovix [100], El Pollo[100]
Best Smallcap Stocks Year-to-Date:
Janux [482.74%], Viking [313.59%], Longboard [272.5%], Alpine Immune[239.29%], Bakkt [199.55%], Avidity Biosciences[192.48%], Vera [189.47%], Cullinan Oncology[176.9%], Super Micro[175.35%], Y-mAbs [151.47%], Sana [149.33%] Best Smallcap Stocks This Week:
Emergent BioSolutions[102.6%], Deciphera [73.24%], Origin Materials[66.52%], Eyenovia [60.78%], Cue Biopharma[56.04%], Aspen Aerogels[55.96%], Enovix [54.02%], Luna Innovations[53.77%], Codexis [47.37%], Carvana Co[44.31%], Office Properties[42.79%] Best Smallcap Stocks Daily:
Luna Innovations[36.00%], Twist Bioscience[28.74%], Ardelyx [28.42%], WideOpenWest [28.23%], 2U [26.63%], Joint [25.35%], FTC Solar[25.09%], Origin Materials[22.23%], Alignment Healthcare[21.97%], Clarus [18.67%], Aurora Innovation[18.09%]