
 Login Sign Up


| |||||
 |  | ||||

| 12Stocks.com Market Intelligence |
Best SmallCap Stocks
|
| In a hurry? Small Cap Stock Lists: Performance Trends Table, Stock Charts
Sort Small Cap stocks: Daily, Weekly, Year-to-Date, Market Cap & Trends. Filter Small Cap stocks list by sector: Show all, Tech, Finance, Energy, Staples, Retail, Industrial, Materials, Utilities and HealthCare Filter Small Cap stocks list by size: All Large Medium Small and MicroCap |
| 12Stocks.com Small Cap Stocks Performances & Trends Daily | |||||||||
|
|  The overall Smart Investing & Trading Score is 69 (0-bearish to 100-bullish) which puts Small Cap index in short term neutral to bullish trend. The Smart Investing & Trading Score from previous trading session is 49 and hence an improvement of trend.
| ||||||||
Here are the Smart Investing & Trading Scores of the most requested small cap stocks at 12Stocks.com (click stock name for detailed review):
|


| 12Stocks.com: Investing in Smallcap Index with Stocks | |
|
The following table helps investors and traders sort through current performance and trends (as measured by Smart Investing & Trading Score) of various
stocks in the Smallcap Index. Quick View: Move mouse or cursor over stock symbol (ticker) to view short-term technical chart and over stock name to view long term chart. Click on  to add stock symbol to your watchlist and to add stock symbol to your watchlist and  to view watchlist. Click on any ticker or stock name for detailed market intelligence report for that stock. to view watchlist. Click on any ticker or stock name for detailed market intelligence report for that stock. |
12Stocks.com Performance of Stocks in Smallcap Index
| Ticker | Stock Name | Watchlist | Category | Recent Price | Smart Investing & Trading Score | Change % | YTD Change% |
| WVE | Wave Life |   | Health Care | 6.14 | 100 | 4.42 | 21.58% |
| BCOV | Brightcove | | Technology | 1.90 | 74 | 4.40 | -26.64% |
| NVCT | Nuvectis Pharma | | Health Care | 6.91 | 42 | 4.38 | -16.44% |
| FORM | FormFactor | | Technology | 54.00 | 100 | 4.35 | 29.47% |
| RIGL | Rigel | | Health Care | 1.20 | 49 | 4.35 | -17.24% |
| OM | Outset Medical | | Health Care | 3.13 | 74 | 4.33 | -42.14% |
| VNDA | Vanda | | Health Care | 4.88 | 95 | 4.27 | 15.64% |
| TTI | TETRA | | Energy | 3.95 | 30 | 4.22 | -12.61% |
| IPSC | Century | | Health Care | 3.09 | 44 | 4.22 | -6.36% |
| CRNC | Cerence | | Technology | 10.15 | 42 | 4.21 | -48.37% |
| BKD | Brookdale Senior | | Health Care | 7.49 | 100 | 4.17 | 28.69% |
| USLM | United States | | Industrials | 340.19 | 100 | 4.14 | 47.68% |
| MRNS | Marinus | | Health Care | 1.51 | 39 | 4.14 | -86.11% |
| MORF | Morphic Holding | | Health Care | 29.90 | 74 | 4.14 | 3.53% |
| SWTX | SpringWorks | | Health Care | 45.11 | 32 | 4.06 | 23.59% |
| ETNB | 89bio | | Health Care | 9.22 | 32 | 4.06 | -17.46% |
| BKKT | Bakkt | | Technology | 6.68 | 83 | 4.05 | 199.55% |
| KBH | KB Home | | Industrials | 68.78 | 90 | 4.04 | 10.12% |
| PRTA | Prothena | | Health Care | 22.93 | 74 | 4.04 | -36.90% |
| PAR | PAR | | Technology | 44.69 | 90 | 4.00 | 2.64% |
| VOR | Vor Biopharma | | Health Care | 1.82 | 37 | 4.00 | -18.02% |
| PACB | Pacific Biosciences | | Health Care | 1.83 | 49 | 3.98 | -81.35% |
| TTMI | TTM | | Technology | 17.31 | 100 | 3.96 | 9.49% |
| CYH | Community Health | | Health Care | 3.42 | 88 | 3.95 | 9.27% |
| NEO | NeoGenomics | | Health Care | 15.30 | 69 | 3.94 | -5.44% |


| Too many stocks? View smallcap stocks filtered by marketcap & sector |
| Marketcap: All SmallCap Stocks (default-no microcap), Large, Mid-Range, Small |
| Smallcap Sector: Tech, Finance, Energy, Staples, Retail, Industrial, Materials, & Medical |
|
Get the most comprehensive stock market coverage daily at 12Stocks.com ➞ Best Stocks Today ➞ Best Stocks Weekly ➞ Best Stocks Year-to-Date ➞ Best Stocks Trends ➞  Best Stocks Today 12Stocks.com Best Nasdaq Stocks ➞ Best S&P 500 Stocks ➞ Best Tech Stocks ➞ Best Biotech Stocks ➞ |
| Detailed Overview of SmallCap Stocks |
| SmallCap Technical Overview, Leaders & Laggards, Top SmallCap ETF Funds & Detailed SmallCap Stocks List, Charts, Trends & More |
| Smallcap: Technical Analysis, Trends & YTD Performance | |
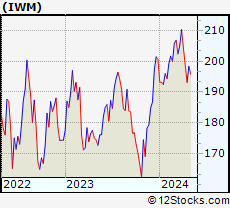
| SmallCap segment as represented by
IWM, an exchange-traded fund [ETF], holds basket of thousands of smallcap stocks from across all major sectors of the US stock market. The smallcap index (contains stocks like Riverbed & Sotheby's) is up by 0.59% and is currently underperforming the overall market by -6.29% year-to-date. Below is a quick view of technical charts and trends: | |
 IWM Weekly Chart |
|
| Long Term Trend: Not Good | |
| Medium Term Trend: Very Good | |
 IWM Daily Chart |
|
| Short Term Trend: Very Good | |
| Overall Trend Score: 69 | |
| YTD Performance: 0.59% | |
| **Trend Scores & Views Are Only For Educational Purposes And Not For Investing | |
| 12Stocks.com: Top Performing Small Cap Index Stocks | ||||||||||||||||||||||||||||||||||||||||||||||||
 The top performing Small Cap Index stocks year to date are
Now, more recently, over last week, the top performing Small Cap Index stocks on the move are


|
||||||||||||||||||||||||||||||||||||||||||||||||
| 12Stocks.com: Investing in Smallcap Index using Exchange Traded Funds | |
|
The following table shows list of key exchange traded funds (ETF) that
help investors track Smallcap index. The following list also includes leveraged ETF funds that track twice or thrice the daily returns of Smallcap indices. Short or inverse ETF funds move in the opposite direction to the index they track and are useful during market pullbacks or during bear markets. Quick View: Move mouse or cursor over ETF symbol (ticker) to view short-term technical chart and over ETF name to view long term chart. Click on ticker or stock name for detailed view. Click on to add stock symbol to your watchlist and to view watchlist. |
12Stocks.com List of ETFs that track Smallcap Index
| Ticker | ETF Name | Watchlist | Recent Price | Smart Investing & Trading Score | Change % | Week % | Year-to-date % |
| IWM | iShares Russell 2000 | | 201.90 | 69 | 0.99 | 1.77 | 0.59% |
| IJR | iShares Core S&P Small-Cap | | 107.13 | 82 | 0.75 | 1.4 | -1.03% |
| VTWO | Vanguard Russell 2000 ETF | | 81.61 | 69 | 0.94 | 1.73 | 0.63% |
| IWN | iShares Russell 2000 Value | | 154.21 | 100 | 0.87 | 2.03 | -0.72% |
| IJS | iShares S&P Small-Cap 600 Value | | 98.72 | 64 | 0.71 | 1.57 | -4.22% |
| IWO | iShares Russell 2000 Growth | | 256.87 | 57 | 0.99 | 1.49 | 1.84% |
| IJT | iShares S&P Small-Cap 600 Growth | | 127.76 | 95 | 0.82 | 1.32 | 2.09% |
| XSLV | PowerShares S&P SmallCap Low Volatil ETF | | 43.22 | 87 | 0.19 | 1.17 | -2.11% |
| SBB | ProShares Short SmallCap600 | | 16.16 | 13 | -1.28 | -1.37 | 1.44% |
| SDD | ProShares UltraShort SmallCap600 | | 18.84 | 23 | -2.41 | -2.61 | 2.27% |
| SAA | ProShares Ultra SmallCap600 | | 23.59 | 69 | 2.86 | 2.39 | -5.45% |
| SMLV | SPDR SSGA US Small Cap Low Volatil ETF | | 109.69 | 87 | 0.78 | 2.01 | -2.52% |
| 12Stocks.com: Charts, Trends, Fundamental Data and Performances of SmallCap Stocks | |
|
We now take in-depth look at all SmallCap stocks including charts, multi-period performances and overall trends (as measured by Smart Investing & Trading Score). One can sort SmallCap stocks (click link to choose) by Daily, Weekly and by Year-to-Date performances. Also, one can sort by size of the company or by market capitalization. |
| Select Your Default Chart Type: | |||||
| |||||
| Click on stock symbol or name for detailed view. Click on to add stock symbol to your watchlist and to view watchlist. Quick View: Move mouse or cursor over "Daily" to quickly view daily technical stock chart and over "Weekly" to view weekly technical stock chart. | |||||

 | WVE Wave Life Sciences Ltd. |
| Sector: Health Care | |
| SubSector: Biotechnology | |
| MarketCap: 452.785 Millions | |
| Recent Price: 6.14 Smart Investing & Trading Score: 100 | |
| Day Percent Change: 4.42% Day Change: 0.26 | |
| Week Change: 31.76% Year-to-date Change: 21.6% | |
| WVE Links: Profile News Message Board | |
| Charts:- Daily , Weekly | |
| Add WVE to Watchlist: View: Get Complete WVE Trend Analysis ➞ | |
 | BCOV Brightcove Inc. |
| Sector: Technology | |
| SubSector: Application Software | |
| MarketCap: 266.162 Millions | |
| Recent Price: 1.90 Smart Investing & Trading Score: 74 | |
| Day Percent Change: 4.40% Day Change: 0.08 | |
| Week Change: 16.56% Year-to-date Change: -26.6% | |
| BCOV Links: Profile News Message Board | |
| Charts:- Daily , Weekly | |
| Add BCOV to Watchlist: View: Get Complete BCOV Trend Analysis ➞ | |
 | NVCT Nuvectis Pharma, Inc. |
| Sector: Health Care | |
| SubSector: Biotechnology | |
| MarketCap: 258 Millions | |
| Recent Price: 6.91 Smart Investing & Trading Score: 42 | |
| Day Percent Change: 4.38% Day Change: 0.29 | |
| Week Change: 6.31% Year-to-date Change: -16.4% | |
| NVCT Links: Profile News Message Board | |
| Charts:- Daily , Weekly | |
| Add NVCT to Watchlist: View: Get Complete NVCT Trend Analysis ➞ | |
 | FORM FormFactor, Inc. |
| Sector: Technology | |
| SubSector: Semiconductor - Broad Line | |
| MarketCap: 1426.42 Millions | |
| Recent Price: 54.00 Smart Investing & Trading Score: 100 | |
| Day Percent Change: 4.35% Day Change: 2.25 | |
| Week Change: 20.67% Year-to-date Change: 29.5% | |
| FORM Links: Profile News Message Board | |
| Charts:- Daily , Weekly | |
| Add FORM to Watchlist: View: Get Complete FORM Trend Analysis ➞ | |
 | RIGL Rigel Pharmaceuticals, Inc. |
| Sector: Health Care | |
| SubSector: Biotechnology | |
| MarketCap: 256.585 Millions | |
| Recent Price: 1.20 Smart Investing & Trading Score: 49 | |
| Day Percent Change: 4.35% Day Change: 0.05 | |
| Week Change: 9.09% Year-to-date Change: -17.2% | |
| RIGL Links: Profile News Message Board | |
| Charts:- Daily , Weekly | |
| Add RIGL to Watchlist: View: Get Complete RIGL Trend Analysis ➞ | |
 | OM Outset Medical, Inc. |
| Sector: Health Care | |
| SubSector: Medical Devices | |
| MarketCap: 21787 Millions | |
| Recent Price: 3.13 Smart Investing & Trading Score: 74 | |
| Day Percent Change: 4.33% Day Change: 0.13 | |
| Week Change: 30.42% Year-to-date Change: -42.1% | |
| OM Links: Profile News Message Board | |
| Charts:- Daily , Weekly | |
| Add OM to Watchlist: View: Get Complete OM Trend Analysis ➞ | |
 | VNDA Vanda Pharmaceuticals Inc. |
| Sector: Health Care | |
| SubSector: Biotechnology | |
| MarketCap: 464.585 Millions | |
| Recent Price: 4.88 Smart Investing & Trading Score: 95 | |
| Day Percent Change: 4.27% Day Change: 0.20 | |
| Week Change: 5.63% Year-to-date Change: 15.6% | |
| VNDA Links: Profile News Message Board | |
| Charts:- Daily , Weekly | |
| Add VNDA to Watchlist: View: Get Complete VNDA Trend Analysis ➞ | |
 | TTI TETRA Technologies, Inc. |
| Sector: Energy | |
| SubSector: Oil & Gas Equipment & Services | |
| MarketCap: 56.9461 Millions | |
| Recent Price: 3.95 Smart Investing & Trading Score: 30 | |
| Day Percent Change: 4.22% Day Change: 0.16 | |
| Week Change: -13.38% Year-to-date Change: -12.6% | |
| TTI Links: Profile News Message Board | |
| Charts:- Daily , Weekly | |
| Add TTI to Watchlist: View: Get Complete TTI Trend Analysis ➞ | |
 | IPSC Century Therapeutics, Inc. |
| Sector: Health Care | |
| SubSector: Biotechnology | |
| MarketCap: 187 Millions | |
| Recent Price: 3.09 Smart Investing & Trading Score: 44 | |
| Day Percent Change: 4.22% Day Change: 0.13 | |
| Week Change: 7.29% Year-to-date Change: -6.4% | |
| IPSC Links: Profile News Message Board | |
| Charts:- Daily , Weekly | |
| Add IPSC to Watchlist: View: Get Complete IPSC Trend Analysis ➞ | |
 | CRNC Cerence Inc. |
| Sector: Technology | |
| SubSector: Application Software | |
| MarketCap: 640.662 Millions | |
| Recent Price: 10.15 Smart Investing & Trading Score: 42 | |
| Day Percent Change: 4.21% Day Change: 0.41 | |
| Week Change: 4.53% Year-to-date Change: -48.4% | |
| CRNC Links: Profile News Message Board | |
| Charts:- Daily , Weekly | |
| Add CRNC to Watchlist: View: Get Complete CRNC Trend Analysis ➞ | |
 | BKD Brookdale Senior Living Inc. |
| Sector: Health Care | |
| SubSector: Long-Term Care Facilities | |
| MarketCap: 420.686 Millions | |
| Recent Price: 7.49 Smart Investing & Trading Score: 100 | |
| Day Percent Change: 4.17% Day Change: 0.30 | |
| Week Change: 7.61% Year-to-date Change: 28.7% | |
| BKD Links: Profile News Message Board | |
| Charts:- Daily , Weekly | |
| Add BKD to Watchlist: View: Get Complete BKD Trend Analysis ➞ | |
 | USLM United States Lime & Minerals, Inc. |
| Sector: Industrials | |
| SubSector: General Building Materials | |
| MarketCap: 427.653 Millions | |
| Recent Price: 340.19 Smart Investing & Trading Score: 100 | |
| Day Percent Change: 4.14% Day Change: 13.51 | |
| Week Change: 10.65% Year-to-date Change: 47.7% | |
| USLM Links: Profile News Message Board | |
| Charts:- Daily , Weekly | |
| Add USLM to Watchlist: View: Get Complete USLM Trend Analysis ➞ | |
 | MRNS Marinus Pharmaceuticals, Inc. |
| Sector: Health Care | |
| SubSector: Biotechnology | |
| MarketCap: 222.885 Millions | |
| Recent Price: 1.51 Smart Investing & Trading Score: 39 | |
| Day Percent Change: 4.14% Day Change: 0.06 | |
| Week Change: 7.47% Year-to-date Change: -86.1% | |
| MRNS Links: Profile News Message Board | |
| Charts:- Daily , Weekly | |
| Add MRNS to Watchlist: View: Get Complete MRNS Trend Analysis ➞ | |
 | MORF Morphic Holding, Inc. |
| Sector: Health Care | |
| SubSector: Biotechnology | |
| MarketCap: 484.885 Millions | |
| Recent Price: 29.90 Smart Investing & Trading Score: 74 | |
| Day Percent Change: 4.14% Day Change: 1.19 | |
| Week Change: 6.52% Year-to-date Change: 3.5% | |
| MORF Links: Profile News Message Board | |
| Charts:- Daily , Weekly | |
| Add MORF to Watchlist: View: Get Complete MORF Trend Analysis ➞ | |
 | SWTX SpringWorks Therapeutics, Inc. |
| Sector: Health Care | |
| SubSector: Biotechnology | |
| MarketCap: 1311.85 Millions | |
| Recent Price: 45.11 Smart Investing & Trading Score: 32 | |
| Day Percent Change: 4.06% Day Change: 1.76 | |
| Week Change: -0.92% Year-to-date Change: 23.6% | |
| SWTX Links: Profile News Message Board | |
| Charts:- Daily , Weekly | |
| Add SWTX to Watchlist: View: Get Complete SWTX Trend Analysis ➞ | |
 | ETNB 89bio, Inc. |
| Sector: Health Care | |
| SubSector: Biotechnology | |
| MarketCap: 517.485 Millions | |
| Recent Price: 9.22 Smart Investing & Trading Score: 32 | |
| Day Percent Change: 4.06% Day Change: 0.36 | |
| Week Change: 11.62% Year-to-date Change: -17.5% | |
| ETNB Links: Profile News Message Board | |
| Charts:- Daily , Weekly | |
| Add ETNB to Watchlist: View: Get Complete ETNB Trend Analysis ➞ | |
 | BKKT Bakkt Holdings, Inc. |
| Sector: Technology | |
| SubSector: Software - Infrastructure | |
| MarketCap: 335 Millions | |
| Recent Price: 6.68 Smart Investing & Trading Score: 83 | |
| Day Percent Change: 4.05% Day Change: 0.26 | |
| Week Change: 1571.25% Year-to-date Change: 199.6% | |
| BKKT Links: Profile News Message Board | |
| Charts:- Daily , Weekly | |
| Add BKKT to Watchlist: View: Get Complete BKKT Trend Analysis ➞ | |
 | KBH KB Home |
| Sector: Industrials | |
| SubSector: Residential Construction | |
| MarketCap: 1249.66 Millions | |
| Recent Price: 68.78 Smart Investing & Trading Score: 90 | |
| Day Percent Change: 4.04% Day Change: 2.67 | |
| Week Change: 4.85% Year-to-date Change: 10.1% | |
| KBH Links: Profile News Message Board | |
| Charts:- Daily , Weekly | |
| Add KBH to Watchlist: View: Get Complete KBH Trend Analysis ➞ | |
 | PRTA Prothena Corporation plc |
| Sector: Health Care | |
| SubSector: Biotechnology | |
| MarketCap: 357.985 Millions | |
| Recent Price: 22.93 Smart Investing & Trading Score: 74 | |
| Day Percent Change: 4.04% Day Change: 0.89 | |
| Week Change: 9.87% Year-to-date Change: -36.9% | |
| PRTA Links: Profile News Message Board | |
| Charts:- Daily , Weekly | |
| Add PRTA to Watchlist: View: Get Complete PRTA Trend Analysis ➞ | |
 | PAR PAR Technology Corporation |
| Sector: Technology | |
| SubSector: Application Software | |
| MarketCap: 255.862 Millions | |
| Recent Price: 44.69 Smart Investing & Trading Score: 90 | |
| Day Percent Change: 4.00% Day Change: 1.72 | |
| Week Change: 3.35% Year-to-date Change: 2.6% | |
| PAR Links: Profile News Message Board | |
| Charts:- Daily , Weekly | |
| Add PAR to Watchlist: View: Get Complete PAR Trend Analysis ➞ | |
 | VOR Vor Biopharma Inc. |
| Sector: Health Care | |
| SubSector: Biotechnology | |
| MarketCap: 224 Millions | |
| Recent Price: 1.82 Smart Investing & Trading Score: 37 | |
| Day Percent Change: 4.00% Day Change: 0.07 | |
| Week Change: 7.69% Year-to-date Change: -18.0% | |
| VOR Links: Profile News Message Board | |
| Charts:- Daily , Weekly | |
| Add VOR to Watchlist: View: Get Complete VOR Trend Analysis ➞ | |
 | PACB Pacific Biosciences of California, Inc. |
| Sector: Health Care | |
| SubSector: Biotechnology | |
| MarketCap: 470.685 Millions | |
| Recent Price: 1.83 Smart Investing & Trading Score: 49 | |
| Day Percent Change: 3.98% Day Change: 0.07 | |
| Week Change: 24.49% Year-to-date Change: -81.4% | |
| PACB Links: Profile News Message Board | |
| Charts:- Daily , Weekly | |
| Add PACB to Watchlist: View: Get Complete PACB Trend Analysis ➞ | |
 | TTMI TTM Technologies, Inc. |
| Sector: Technology | |
| SubSector: Printed Circuit Boards | |
| MarketCap: 1028.35 Millions | |
| Recent Price: 17.31 Smart Investing & Trading Score: 100 | |
| Day Percent Change: 3.96% Day Change: 0.66 | |
| Week Change: 14.41% Year-to-date Change: 9.5% | |
| TTMI Links: Profile News Message Board | |
| Charts:- Daily , Weekly | |
| Add TTMI to Watchlist: View: Get Complete TTMI Trend Analysis ➞ | |
 | CYH Community Health Systems, Inc. |
| Sector: Health Care | |
| SubSector: Hospitals | |
| MarketCap: 371.546 Millions | |
| Recent Price: 3.42 Smart Investing & Trading Score: 88 | |
| Day Percent Change: 3.95% Day Change: 0.13 | |
| Week Change: 0.88% Year-to-date Change: 9.3% | |
| CYH Links: Profile News Message Board | |
| Charts:- Daily , Weekly | |
| Add CYH to Watchlist: View: Get Complete CYH Trend Analysis ➞ | |
 | NEO NeoGenomics, Inc. |
| Sector: Health Care | |
| SubSector: Medical Laboratories & Research | |
| MarketCap: 2763.8 Millions | |
| Recent Price: 15.30 Smart Investing & Trading Score: 69 | |
| Day Percent Change: 3.94% Day Change: 0.58 | |
| Week Change: 8.2% Year-to-date Change: -5.4% | |
| NEO Links: Profile News Message Board | |
| Charts:- Daily , Weekly | |
| Add NEO to Watchlist: View: Get Complete NEO Trend Analysis ➞ | |
| Too many stocks? View smallcap stocks filtered by marketcap & sector |
| Marketcap: All SmallCap Stocks (default-no microcap), Large, Mid-Range, Small & MicroCap |
| Sector: Tech, Finance, Energy, Staples, Retail, Industrial, Materials, Utilities & Medical |
|
Best Stocks Today 12Stocks.com |
© 2024 12Stocks.com Terms & Conditions Privacy Contact Us
All Information Provided Only For Education And Not To Be Used For Investing or Trading. See Terms & Conditions


One More Thing ... Get Best Stocks Delivered Daily!
Never Ever Miss A Move With Our Top Ten Stocks Lists
Find Best Stocks In Any Market - Bull or Bear Market
Take A Peek At Our Top Ten Stocks Lists: Daily, Weekly, Year-to-Date & Top Trends
Find Best Stocks In Any Market - Bull or Bear Market
Take A Peek At Our Top Ten Stocks Lists: Daily, Weekly, Year-to-Date & Top Trends
Smallcap Stocks With Best Up Trends [0-bearish to 100-bullish]: Twist Bioscience[100], WideOpenWest [100], Joint [100], FTC Solar[100], Origin Materials[100], Alignment Healthcare[100], Clarus [100], IES [100], Emergent BioSolutions[100], Enovix [100], El Pollo[100]
Best Smallcap Stocks Year-to-Date:
Janux [482.74%], Viking [313.59%], Longboard [272.5%], Alpine Immune[239.29%], Bakkt [199.55%], Avidity Biosciences[192.48%], Vera [189.47%], Cullinan Oncology[176.9%], Super Micro[175.35%], Y-mAbs [151.47%], Sana [149.33%] Best Smallcap Stocks This Week:
Emergent BioSolutions[102.6%], Deciphera [73.24%], Origin Materials[66.52%], Eyenovia [60.78%], Cue Biopharma[56.04%], Aspen Aerogels[55.96%], Enovix [54.02%], Luna Innovations[53.77%], Codexis [47.37%], Carvana Co[44.31%], Office Properties[42.79%] Best Smallcap Stocks Daily:
Luna Innovations[36.00%], Twist Bioscience[28.74%], Ardelyx [28.42%], WideOpenWest [28.23%], 2U [26.63%], Joint [25.35%], FTC Solar[25.09%], Origin Materials[22.23%], Alignment Healthcare[21.97%], Clarus [18.67%], Aurora Innovation[18.09%]