
 Login Sign Up


| |||||
 |  | ||||

| 12Stocks.com Market Intelligence |
Best SmallCap Stocks
|
| In a hurry? Small Cap Stock Lists: Performance Trends Table, Stock Charts
Sort Small Cap stocks: Daily, Weekly, Year-to-Date, Market Cap & Trends. Filter Small Cap stocks list by sector: Show all, Tech, Finance, Energy, Staples, Retail, Industrial, Materials, Utilities and HealthCare Filter Small Cap stocks list by size: All Large Medium Small and MicroCap |
| 12Stocks.com Small Cap Stocks Performances & Trends Daily | |||||||||
|
|  The overall Smart Investing & Trading Score is 49 (0-bearish to 100-bullish) which puts Small Cap index in short term neutral trend. The Smart Investing & Trading Score from previous trading session is 14 and hence an improvement of trend.
| ||||||||
Here are the Smart Investing & Trading Scores of the most requested small cap stocks at 12Stocks.com (click stock name for detailed review):
|


| 12Stocks.com: Investing in Smallcap Index with Stocks | |
|
The following table helps investors and traders sort through current performance and trends (as measured by Smart Investing & Trading Score) of various
stocks in the Smallcap Index. Quick View: Move mouse or cursor over stock symbol (ticker) to view short-term technical chart and over stock name to view long term chart. Click on  to add stock symbol to your watchlist and to add stock symbol to your watchlist and  to view watchlist. Click on any ticker or stock name for detailed market intelligence report for that stock. to view watchlist. Click on any ticker or stock name for detailed market intelligence report for that stock. |
12Stocks.com Performance of Stocks in Smallcap Index
| Ticker | Stock Name | Watchlist | Category | Recent Price | Smart Investing & Trading Score | Change % | YTD Change% |
| SUPN | Supernus |   | Health Care | 30.27 | 61 | 0.63 | 4.60% |
| RBBN | Ribbon | | Technology | 3.21 | 78 | 0.63 | 10.69% |
| NUVB | Nuvation Bio | | Health Care | 3.22 | 100 | 0.63 | 112.54% |
| EXPO | Exponent | | Services & Goods | 92.42 | 68 | 0.62 | 4.98% |
| UNTY | Unity Bancorp | | Financials | 27.44 | 76 | 0.62 | -7.27% |
| TGAN | Transphorm | | Technology | 4.86 | 63 | 0.62 | 32.61% |
| FA | First Advantage | | Industrials | 16.40 | 70 | 0.61 | -1.68% |
| OLP | One Liberty | | Financials | 23.23 | 100 | 0.61 | 6.02% |
| AROW | Arrow Financial | | Financials | 23.42 | 67 | 0.60 | -16.18% |
| III | Information Services | | Technology | 3.36 | 10 | 0.60 | -28.66% |
| PKBK | Parke Bancorp | | Financials | 16.71 | 64 | 0.60 | -17.48% |
| RXRX | Recursion | | Health Care | 8.38 | 57 | 0.60 | -14.40% |
| BECN | Beacon Roofing | | Industrials | 97.52 | 46 | 0.59 | 12.07% |
| CENTA | Central Garden | | Materials | 35.89 | 59 | 0.59 | -18.51% |
| LXU | LSB Industries | | Materials | 8.52 | 83 | 0.59 | -8.49% |
| NXRT | NexPoint Residential | | Financials | 34.27 | 83 | 0.59 | -0.46% |
| RAMP | LiveRamp | | Technology | 32.48 | 20 | 0.59 | -14.26% |
| GRND | Grindr | | Technology | 10.23 | 70 | 0.59 | 14.17% |
| UIS | Unisys | | Technology | 5.24 | 28 | 0.58 | -6.76% |
| CTO | Consolidated-Tomoka Land | | Financials | 17.47 | 95 | 0.58 | 0.81% |
| FRME | First Merchants | | Financials | 34.39 | 93 | 0.58 | -7.25% |
| PSMT | PriceSmart | | Services & Goods | 82.02 | 52 | 0.58 | 8.23% |
| PSTL | Postal Realty | | Financials | 13.88 | 50 | 0.58 | -4.67% |
| RXT | Rackspace | | Technology | 1.74 | 37 | 0.58 | -13.22% |
| INST | Instructure | | Technology | 19.56 | 42 | 0.57 | -27.58% |


| Too many stocks? View smallcap stocks filtered by marketcap & sector |
| Marketcap: All SmallCap Stocks (default-no microcap), Large, Mid-Range, Small |
| Smallcap Sector: Tech, Finance, Energy, Staples, Retail, Industrial, Materials, & Medical |
|
Get the most comprehensive stock market coverage daily at 12Stocks.com ➞ Best Stocks Today ➞ Best Stocks Weekly ➞ Best Stocks Year-to-Date ➞ Best Stocks Trends ➞  Best Stocks Today 12Stocks.com Best Nasdaq Stocks ➞ Best S&P 500 Stocks ➞ Best Tech Stocks ➞ Best Biotech Stocks ➞ |
| Detailed Overview of SmallCap Stocks |
| SmallCap Technical Overview, Leaders & Laggards, Top SmallCap ETF Funds & Detailed SmallCap Stocks List, Charts, Trends & More |
| Smallcap: Technical Analysis, Trends & YTD Performance | |
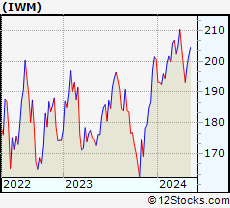
| SmallCap segment as represented by
IWM, an exchange-traded fund [ETF], holds basket of thousands of smallcap stocks from across all major sectors of the US stock market. The smallcap index (contains stocks like Riverbed & Sotheby's) is down by -0.39% and is currently underperforming the overall market by -6.01% year-to-date. Below is a quick view of technical charts and trends: | |
 IWM Weekly Chart |
|
| Long Term Trend: Not Good | |
| Medium Term Trend: Good | |
 IWM Daily Chart |
|
| Short Term Trend: Deteriorating | |
| Overall Trend Score: 49 | |
| YTD Performance: -0.39% | |
| **Trend Scores & Views Are Only For Educational Purposes And Not For Investing | |
| 12Stocks.com: Top Performing Small Cap Index Stocks | ||||||||||||||||||||||||||||||||||||||||||||||||
 The top performing Small Cap Index stocks year to date are
Now, more recently, over last week, the top performing Small Cap Index stocks on the move are


|
||||||||||||||||||||||||||||||||||||||||||||||||
| 12Stocks.com: Investing in Smallcap Index using Exchange Traded Funds | |
|
The following table shows list of key exchange traded funds (ETF) that
help investors track Smallcap index. The following list also includes leveraged ETF funds that track twice or thrice the daily returns of Smallcap indices. Short or inverse ETF funds move in the opposite direction to the index they track and are useful during market pullbacks or during bear markets. Quick View: Move mouse or cursor over ETF symbol (ticker) to view short-term technical chart and over ETF name to view long term chart. Click on ticker or stock name for detailed view. Click on to add stock symbol to your watchlist and to view watchlist. |
12Stocks.com List of ETFs that track Smallcap Index
| Ticker | ETF Name | Watchlist | Recent Price | Smart Investing & Trading Score | Change % | Week % | Year-to-date % |
| IWM | iShares Russell 2000 | | 199.92 | 49 | 1.84 | 0.77 | -0.39% |
| IJR | iShares Core S&P Small-Cap | | 106.33 | 50 | 1.52 | 0.64 | -1.77% |
| VTWO | Vanguard Russell 2000 ETF | | 80.85 | 42 | 1.88 | 0.79 | -0.31% |
| IWN | iShares Russell 2000 Value | | 152.88 | 75 | 2.04 | 1.15 | -1.58% |
| IWO | iShares Russell 2000 Growth | | 254.34 | 32 | 1.91 | 0.49 | 0.84% |
| IJS | iShares S&P Small-Cap 600 Value | | 98.02 | 43 | 1.68 | 0.85 | -4.9% |
| IJT | iShares S&P Small-Cap 600 Growth | | 126.72 | 63 | 1.42 | 0.5 | 1.26% |
| XSLV | PowerShares S&P SmallCap Low Volatil ETF | | 43.14 | 73 | 0.72 | 0.98 | -2.29% |
| SDD | ProShares UltraShort SmallCap600 | | 19.31 | 56 | -2.02 | -0.21 | 4.79% |
| SMLV | SPDR SSGA US Small Cap Low Volatil ETF | | 108.83 | 87 | 1.30 | 1.22 | -3.27% |
| SAA | ProShares Ultra SmallCap600 | | 22.93 | 42 | 1.56 | -0.46 | -8.08% |
| SBB | ProShares Short SmallCap600 | | 16.37 | 49 | -1.14 | -0.09 | 2.76% |
| 12Stocks.com: Charts, Trends, Fundamental Data and Performances of SmallCap Stocks | |
|
We now take in-depth look at all SmallCap stocks including charts, multi-period performances and overall trends (as measured by Smart Investing & Trading Score). One can sort SmallCap stocks (click link to choose) by Daily, Weekly and by Year-to-Date performances. Also, one can sort by size of the company or by market capitalization. |
| Select Your Default Chart Type: | |||||
| |||||
| Click on stock symbol or name for detailed view. Click on to add stock symbol to your watchlist and to view watchlist. Quick View: Move mouse or cursor over "Daily" to quickly view daily technical stock chart and over "Weekly" to view weekly technical stock chart. | |||||

 | SUPN Supernus Pharmaceuticals, Inc. |
| Sector: Health Care | |
| SubSector: Drugs - Generic | |
| MarketCap: 833.585 Millions | |
| Recent Price: 30.27 Smart Investing & Trading Score: 61 | |
| Day Percent Change: 0.63% Day Change: 0.19 | |
| Week Change: 0.67% Year-to-date Change: 4.6% | |
| SUPN Links: Profile News Message Board | |
| Charts:- Daily , Weekly | |
| Add SUPN to Watchlist: View: Get Complete SUPN Trend Analysis ➞ | |
 | RBBN Ribbon Communications Inc. |
| Sector: Technology | |
| SubSector: Telecom Services - Domestic | |
| MarketCap: 284.577 Millions | |
| Recent Price: 3.21 Smart Investing & Trading Score: 78 | |
| Day Percent Change: 0.63% Day Change: 0.02 | |
| Week Change: 2.56% Year-to-date Change: 10.7% | |
| RBBN Links: Profile News Message Board | |
| Charts:- Daily , Weekly | |
| Add RBBN to Watchlist: View: Get Complete RBBN Trend Analysis ➞ | |
 | NUVB Nuvation Bio Inc. |
| Sector: Health Care | |
| SubSector: Biotechnology | |
| MarketCap: 381 Millions | |
| Recent Price: 3.22 Smart Investing & Trading Score: 100 | |
| Day Percent Change: 0.63% Day Change: 0.02 | |
| Week Change: 20.15% Year-to-date Change: 112.5% | |
| NUVB Links: Profile News Message Board | |
| Charts:- Daily , Weekly | |
| Add NUVB to Watchlist: View: Get Complete NUVB Trend Analysis ➞ | |
 | EXPO Exponent, Inc. |
| Sector: Services & Goods | |
| SubSector: Management Services | |
| MarketCap: 3605.95 Millions | |
| Recent Price: 92.42 Smart Investing & Trading Score: 68 | |
| Day Percent Change: 0.62% Day Change: 0.57 | |
| Week Change: -2.93% Year-to-date Change: 5.0% | |
| EXPO Links: Profile News Message Board | |
| Charts:- Daily , Weekly | |
| Add EXPO to Watchlist: View: Get Complete EXPO Trend Analysis ➞ | |
 | UNTY Unity Bancorp, Inc. |
| Sector: Financials | |
| SubSector: Money Center Banks | |
| MarketCap: 149.099 Millions | |
| Recent Price: 27.44 Smart Investing & Trading Score: 76 | |
| Day Percent Change: 0.62% Day Change: 0.17 | |
| Week Change: -0.65% Year-to-date Change: -7.3% | |
| UNTY Links: Profile News Message Board | |
| Charts:- Daily , Weekly | |
| Add UNTY to Watchlist: View: Get Complete UNTY Trend Analysis ➞ | |
 | TGAN Transphorm, Inc. |
| Sector: Technology | |
| SubSector: Semiconductor Equipment & Materials | |
| MarketCap: 194 Millions | |
| Recent Price: 4.86 Smart Investing & Trading Score: 63 | |
| Day Percent Change: 0.62% Day Change: 0.03 | |
| Week Change: 0% Year-to-date Change: 32.6% | |
| TGAN Links: Profile News Message Board | |
| Charts:- Daily , Weekly | |
| Add TGAN to Watchlist: View: Get Complete TGAN Trend Analysis ➞ | |
 | FA First Advantage Corporation |
| Sector: Industrials | |
| SubSector: Specialty Business Services | |
| MarketCap: 2170 Millions | |
| Recent Price: 16.40 Smart Investing & Trading Score: 70 | |
| Day Percent Change: 0.61% Day Change: 0.10 | |
| Week Change: 0% Year-to-date Change: -1.7% | |
| FA Links: Profile News Message Board | |
| Charts:- Daily , Weekly | |
| Add FA to Watchlist: View: Get Complete FA Trend Analysis ➞ | |
 | OLP One Liberty Properties, Inc. |
| Sector: Financials | |
| SubSector: REIT - Diversified | |
| MarketCap: 378.353 Millions | |
| Recent Price: 23.23 Smart Investing & Trading Score: 100 | |
| Day Percent Change: 0.61% Day Change: 0.14 | |
| Week Change: 2.2% Year-to-date Change: 6.0% | |
| OLP Links: Profile News Message Board | |
| Charts:- Daily , Weekly | |
| Add OLP to Watchlist: View: Get Complete OLP Trend Analysis ➞ | |
 | AROW Arrow Financial Corporation |
| Sector: Financials | |
| SubSector: Regional - Northeast Banks | |
| MarketCap: 413.999 Millions | |
| Recent Price: 23.42 Smart Investing & Trading Score: 67 | |
| Day Percent Change: 0.60% Day Change: 0.14 | |
| Week Change: 2% Year-to-date Change: -16.2% | |
| AROW Links: Profile News Message Board | |
| Charts:- Daily , Weekly | |
| Add AROW to Watchlist: View: Get Complete AROW Trend Analysis ➞ | |
 | III Information Services Group, Inc. |
| Sector: Technology | |
| SubSector: Information Technology Services | |
| MarketCap: 166.968 Millions | |
| Recent Price: 3.36 Smart Investing & Trading Score: 10 | |
| Day Percent Change: 0.60% Day Change: 0.02 | |
| Week Change: -2.61% Year-to-date Change: -28.7% | |
| III Links: Profile News Message Board | |
| Charts:- Daily , Weekly | |
| Add III to Watchlist: View: Get Complete III Trend Analysis ➞ | |
 | PKBK Parke Bancorp, Inc. |
| Sector: Financials | |
| SubSector: Regional - Northeast Banks | |
| MarketCap: 165.799 Millions | |
| Recent Price: 16.71 Smart Investing & Trading Score: 64 | |
| Day Percent Change: 0.60% Day Change: 0.10 | |
| Week Change: 1.52% Year-to-date Change: -17.5% | |
| PKBK Links: Profile News Message Board | |
| Charts:- Daily , Weekly | |
| Add PKBK to Watchlist: View: Get Complete PKBK Trend Analysis ➞ | |
 | RXRX Recursion Pharmaceuticals, Inc. |
| Sector: Health Care | |
| SubSector: Biotechnology | |
| MarketCap: 1470 Millions | |
| Recent Price: 8.38 Smart Investing & Trading Score: 57 | |
| Day Percent Change: 0.60% Day Change: 0.05 | |
| Week Change: 3.27% Year-to-date Change: -14.4% | |
| RXRX Links: Profile News Message Board | |
| Charts:- Daily , Weekly | |
| Add RXRX to Watchlist: View: Get Complete RXRX Trend Analysis ➞ | |
 | BECN Beacon Roofing Supply, Inc. |
| Sector: Industrials | |
| SubSector: General Building Materials | |
| MarketCap: 1210.13 Millions | |
| Recent Price: 97.52 Smart Investing & Trading Score: 46 | |
| Day Percent Change: 0.59% Day Change: 0.57 | |
| Week Change: -1.49% Year-to-date Change: 12.1% | |
| BECN Links: Profile News Message Board | |
| Charts:- Daily , Weekly | |
| Add BECN to Watchlist: View: Get Complete BECN Trend Analysis ➞ | |
 | CENTA Central Garden & Pet Company |
| Sector: Materials | |
| SubSector: Agricultural Chemicals | |
| MarketCap: 953 Millions | |
| Recent Price: 35.89 Smart Investing & Trading Score: 59 | |
| Day Percent Change: 0.59% Day Change: 0.21 | |
| Week Change: 0.98% Year-to-date Change: -18.5% | |
| CENTA Links: Profile News Message Board | |
| Charts:- Daily , Weekly | |
| Add CENTA to Watchlist: View: Get Complete CENTA Trend Analysis ➞ | |
 | LXU LSB Industries, Inc. |
| Sector: Materials | |
| SubSector: Chemicals - Major Diversified | |
| MarketCap: 51.7736 Millions | |
| Recent Price: 8.52 Smart Investing & Trading Score: 83 | |
| Day Percent Change: 0.59% Day Change: 0.05 | |
| Week Change: 3.78% Year-to-date Change: -8.5% | |
| LXU Links: Profile News Message Board | |
| Charts:- Daily , Weekly | |
| Add LXU to Watchlist: View: Get Complete LXU Trend Analysis ➞ | |
 | NXRT NexPoint Residential Trust, Inc. |
| Sector: Financials | |
| SubSector: REIT - Residential | |
| MarketCap: 839.161 Millions | |
| Recent Price: 34.27 Smart Investing & Trading Score: 83 | |
| Day Percent Change: 0.59% Day Change: 0.20 | |
| Week Change: 3.01% Year-to-date Change: -0.5% | |
| NXRT Links: Profile News Message Board | |
| Charts:- Daily , Weekly | |
| Add NXRT to Watchlist: View: Get Complete NXRT Trend Analysis ➞ | |
 | RAMP LiveRamp Holdings, Inc. |
| Sector: Technology | |
| SubSector: Information Technology Services | |
| MarketCap: 2124.38 Millions | |
| Recent Price: 32.48 Smart Investing & Trading Score: 20 | |
| Day Percent Change: 0.59% Day Change: 0.19 | |
| Week Change: -0.49% Year-to-date Change: -14.3% | |
| RAMP Links: Profile News Message Board | |
| Charts:- Daily , Weekly | |
| Add RAMP to Watchlist: View: Get Complete RAMP Trend Analysis ➞ | |
 | GRND Grindr Inc. |
| Sector: Technology | |
| SubSector: Software - Application | |
| MarketCap: 929 Millions | |
| Recent Price: 10.23 Smart Investing & Trading Score: 70 | |
| Day Percent Change: 0.59% Day Change: 0.06 | |
| Week Change: 3.44% Year-to-date Change: 14.2% | |
| GRND Links: Profile News Message Board | |
| Charts:- Daily , Weekly | |
| Add GRND to Watchlist: View: Get Complete GRND Trend Analysis ➞ | |
 | UIS Unisys Corporation |
| Sector: Technology | |
| SubSector: Information Technology Services | |
| MarketCap: 803.868 Millions | |
| Recent Price: 5.24 Smart Investing & Trading Score: 28 | |
| Day Percent Change: 0.58% Day Change: 0.03 | |
| Week Change: -4.03% Year-to-date Change: -6.8% | |
| UIS Links: Profile News Message Board | |
| Charts:- Daily , Weekly | |
| Add UIS to Watchlist: View: Get Complete UIS Trend Analysis ➞ | |
 | CTO Consolidated-Tomoka Land Co. |
| Sector: Financials | |
| SubSector: Real Estate Development | |
| MarketCap: 205.119 Millions | |
| Recent Price: 17.47 Smart Investing & Trading Score: 95 | |
| Day Percent Change: 0.58% Day Change: 0.10 | |
| Week Change: 1.98% Year-to-date Change: 0.8% | |
| CTO Links: Profile News Message Board | |
| Charts:- Daily , Weekly | |
| Add CTO to Watchlist: View: Get Complete CTO Trend Analysis ➞ | |
 | FRME First Merchants Corporation |
| Sector: Financials | |
| SubSector: Regional - Midwest Banks | |
| MarketCap: 1490.4 Millions | |
| Recent Price: 34.39 Smart Investing & Trading Score: 93 | |
| Day Percent Change: 0.58% Day Change: 0.20 | |
| Week Change: 0.76% Year-to-date Change: -7.3% | |
| FRME Links: Profile News Message Board | |
| Charts:- Daily , Weekly | |
| Add FRME to Watchlist: View: Get Complete FRME Trend Analysis ➞ | |
 | PSMT PriceSmart, Inc. |
| Sector: Services & Goods | |
| SubSector: Discount, Variety Stores | |
| MarketCap: 1655.72 Millions | |
| Recent Price: 82.02 Smart Investing & Trading Score: 52 | |
| Day Percent Change: 0.58% Day Change: 0.47 | |
| Week Change: 0.65% Year-to-date Change: 8.2% | |
| PSMT Links: Profile News Message Board | |
| Charts:- Daily , Weekly | |
| Add PSMT to Watchlist: View: Get Complete PSMT Trend Analysis ➞ | |
 | PSTL Postal Realty Trust, Inc. |
| Sector: Financials | |
| SubSector: REIT - Office | |
| MarketCap: 82.9866 Millions | |
| Recent Price: 13.88 Smart Investing & Trading Score: 50 | |
| Day Percent Change: 0.58% Day Change: 0.08 | |
| Week Change: 1.09% Year-to-date Change: -4.7% | |
| PSTL Links: Profile News Message Board | |
| Charts:- Daily , Weekly | |
| Add PSTL to Watchlist: View: Get Complete PSTL Trend Analysis ➞ | |
 | RXT Rackspace Technology, Inc. |
| Sector: Technology | |
| SubSector: Software Infrastructure | |
| MarketCap: 40287 Millions | |
| Recent Price: 1.74 Smart Investing & Trading Score: 37 | |
| Day Percent Change: 0.58% Day Change: 0.01 | |
| Week Change: -0.57% Year-to-date Change: -13.2% | |
| RXT Links: Profile News Message Board | |
| Charts:- Daily , Weekly | |
| Add RXT to Watchlist: View: Get Complete RXT Trend Analysis ➞ | |
 | INST Instructure Holdings, Inc. |
| Sector: Technology | |
| SubSector: Software - Application | |
| MarketCap: 3580 Millions | |
| Recent Price: 19.56 Smart Investing & Trading Score: 42 | |
| Day Percent Change: 0.57% Day Change: 0.11 | |
| Week Change: -0.46% Year-to-date Change: -27.6% | |
| INST Links: Profile News Message Board | |
| Charts:- Daily , Weekly | |
| Add INST to Watchlist: View: Get Complete INST Trend Analysis ➞ | |
| Too many stocks? View smallcap stocks filtered by marketcap & sector |
| Marketcap: All SmallCap Stocks (default-no microcap), Large, Mid-Range, Small & MicroCap |
| Sector: Tech, Finance, Energy, Staples, Retail, Industrial, Materials, Utilities & Medical |
|
Best Stocks Today 12Stocks.com |
© 2024 12Stocks.com Terms & Conditions Privacy Contact Us
All Information Provided Only For Education And Not To Be Used For Investing or Trading. See Terms & Conditions


One More Thing ... Get Best Stocks Delivered Daily!
Never Ever Miss A Move With Our Top Ten Stocks Lists
Find Best Stocks In Any Market - Bull or Bear Market
Take A Peek At Our Top Ten Stocks Lists: Daily, Weekly, Year-to-Date & Top Trends
Find Best Stocks In Any Market - Bull or Bear Market
Take A Peek At Our Top Ten Stocks Lists: Daily, Weekly, Year-to-Date & Top Trends
Smallcap Stocks With Best Up Trends [0-bearish to 100-bullish]: Emergent BioSolutions[100], Aspen Aerogels[100], Carvana Co[100], Perdoceo Education[100], Gannett Co[100], Pitney Bowes[100], Benchmark Electronics[100], Origin Materials[100], FormFactor [100], Lantheus [100], Q2 [100]
Best Smallcap Stocks Year-to-Date:
Janux [440.16%], Viking [307.09%], Longboard [273.98%], Alpine Immune[239.29%], Bakkt [187.89%], Avidity Biosciences[182.96%], Vera [170.74%], Cullinan Oncology[169.74%], Super Micro[168.25%], Arcutis Bio[166.25%], Y-mAbs [152.93%] Best Smallcap Stocks This Week:
Deciphera [73.24%], Emergent BioSolutions[71.88%], Eyenovia [49.22%], Aspen Aerogels[48.14%], P3 Health[38.51%], Carvana Co[38.18%], Cue Biopharma[37.73%], Origin Materials[36.24%], TransMedics Group[35.14%], Seres [34.55%], Enovix [32.07%] Best Smallcap Stocks Daily:
Emergent BioSolutions[70.98%], Aspen Aerogels[56.70%], Carvana Co[33.77%], Perdoceo Education[31.46%], Enovix [31.06%], Office Properties[28.00%], Gannett Co[26.97%], Sunnova Energy[25.21%], Pitney Bowes[24.70%], Pulmonx [21.50%], CommScope Holding[20.95%]