
 Login Sign Up


| |||||
 |  | ||||

| 12Stocks.com Market Intelligence |
Best SmallCap Stocks
|
| In a hurry? Small Cap Stock Lists: Performance Trends Table, Stock Charts
Sort Small Cap stocks: Daily, Weekly, Year-to-Date, Market Cap & Trends. Filter Small Cap stocks list by sector: Show all, Tech, Finance, Energy, Staples, Retail, Industrial, Materials, Utilities and HealthCare Filter Small Cap stocks list by size: All Large Medium Small and MicroCap |
| 12Stocks.com Small Cap Stocks Performances & Trends Daily | |||||||||
|
|  The overall Smart Investing & Trading Score is 69 (0-bearish to 100-bullish) which puts Small Cap index in short term neutral to bullish trend. The Smart Investing & Trading Score from previous trading session is 49 and hence an improvement of trend.
| ||||||||
Here are the Smart Investing & Trading Scores of the most requested small cap stocks at 12Stocks.com (click stock name for detailed review):
|


| 12Stocks.com: Investing in Smallcap Index with Stocks | |
|
The following table helps investors and traders sort through current performance and trends (as measured by Smart Investing & Trading Score) of various
stocks in the Smallcap Index. Quick View: Move mouse or cursor over stock symbol (ticker) to view short-term technical chart and over stock name to view long term chart. Click on  to add stock symbol to your watchlist and to add stock symbol to your watchlist and  to view watchlist. Click on any ticker or stock name for detailed market intelligence report for that stock. to view watchlist. Click on any ticker or stock name for detailed market intelligence report for that stock. |
12Stocks.com Performance of Stocks in Smallcap Index
| Ticker | Stock Name | Watchlist | Category | Recent Price | Smart Investing & Trading Score | Change % | YTD Change% |
| SIBN | SI-BONE |   | Health Care | 14.20 | 18 | -2.81 | -32.35% |
| PLSE | Pulse Biosciences | | Health Care | 7.82 | 64 | -2.86 | -36.11% |
| SPWH | Sportsman s | | Consumer Staples | 3.21 | 27 | -2.87 | -24.65% |
| TWKS | Thoughtworks Holding | | Technology | 2.25 | 20 | -3.02 | -53.70% |
| FLYW | Flywire | | Technology | 19.57 | 0 | -3.02 | -16.47% |
| UIS | Unisys | | Technology | 5.08 | 0 | -3.05 | -9.61% |
| BFS | Saul Centers | | Financials | 35.98 | 38 | -3.07 | -8.38% |
| VVI | Viad Corp | | Services & Goods | 34.20 | 0 | -3.09 | -5.52% |
| SIG | Signet Jewelers | | Services & Goods | 94.35 | 0 | -3.13 | -12.04% |
| RELY | Remitly Global | | Technology | 14.91 | 71 | -3.18 | -23.22% |
| ULH | Universal Logistics | | Transports | 42.53 | 68 | -3.21 | 51.78% |
| CCO | Clear Channel | | Services & Goods | 1.50 | 52 | -3.23 | -17.58% |
| ELA | Envela | | Services & Goods | 4.47 | 100 | -3.25 | -8.02% |
| DFH | Dream Finders | | Services & Goods | 31.16 | 7 | -3.27 | -13.43% |
| WISH | ContextLogic | | Services & Goods | 5.31 | 20 | -3.28 | -10.68% |
| USNA | USANA Health | | Health Care | 45.55 | 67 | -3.29 | -15.02% |
| ZVIA | Zevia PBC | | Consumer Staples | 0.87 | 25 | -3.32 | -56.82% |
| JBSS | John B. | | Consumer Staples | 97.98 | 15 | -3.34 | -4.91% |
| PRLD | Prelude | | Health Care | 3.86 | 37 | -3.38 | -11.38% |
| LNTH | Lantheus | | Health Care | 75.53 | 100 | -3.39 | 21.82% |
| NEOG | Neogen | | Health Care | 12.02 | 17 | -3.45 | -40.23% |
| FSLY | Fastly | | Technology | 8.48 | 7 | -3.53 | -52.36% |
| SENEA | Seneca Foods | | Consumer Staples | 57.86 | 71 | -3.57 | 10.34% |
| KWR | Quaker Chemical | | Materials | 185.56 | 8 | -3.71 | -13.05% |
| NN | NextNav | | Technology | 8.93 | 56 | -3.88 | 100.67% |


| Too many stocks? View smallcap stocks filtered by marketcap & sector |
| Marketcap: All SmallCap Stocks (default-no microcap), Large, Mid-Range, Small |
| Smallcap Sector: Tech, Finance, Energy, Staples, Retail, Industrial, Materials, & Medical |
|
Get the most comprehensive stock market coverage daily at 12Stocks.com ➞ Best Stocks Today ➞ Best Stocks Weekly ➞ Best Stocks Year-to-Date ➞ Best Stocks Trends ➞  Best Stocks Today 12Stocks.com Best Nasdaq Stocks ➞ Best S&P 500 Stocks ➞ Best Tech Stocks ➞ Best Biotech Stocks ➞ |
| Detailed Overview of SmallCap Stocks |
| SmallCap Technical Overview, Leaders & Laggards, Top SmallCap ETF Funds & Detailed SmallCap Stocks List, Charts, Trends & More |
| Smallcap: Technical Analysis, Trends & YTD Performance | |
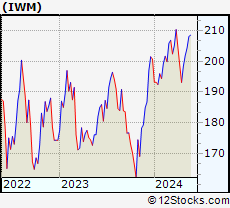
| SmallCap segment as represented by
IWM, an exchange-traded fund [ETF], holds basket of thousands of smallcap stocks from across all major sectors of the US stock market. The smallcap index (contains stocks like Riverbed & Sotheby's) is up by 0.59% and is currently underperforming the overall market by -6.29% year-to-date. Below is a quick view of technical charts and trends: | |
 IWM Weekly Chart |
|
| Long Term Trend: Not Good | |
| Medium Term Trend: Very Good | |
 IWM Daily Chart |
|
| Short Term Trend: Very Good | |
| Overall Trend Score: 69 | |
| YTD Performance: 0.59% | |
| **Trend Scores & Views Are Only For Educational Purposes And Not For Investing | |
| 12Stocks.com: Top Performing Small Cap Index Stocks | ||||||||||||||||||||||||||||||||||||||||||||||||
 The top performing Small Cap Index stocks year to date are
Now, more recently, over last week, the top performing Small Cap Index stocks on the move are


|
||||||||||||||||||||||||||||||||||||||||||||||||
| 12Stocks.com: Investing in Smallcap Index using Exchange Traded Funds | |
|
The following table shows list of key exchange traded funds (ETF) that
help investors track Smallcap index. The following list also includes leveraged ETF funds that track twice or thrice the daily returns of Smallcap indices. Short or inverse ETF funds move in the opposite direction to the index they track and are useful during market pullbacks or during bear markets. Quick View: Move mouse or cursor over ETF symbol (ticker) to view short-term technical chart and over ETF name to view long term chart. Click on ticker or stock name for detailed view. Click on to add stock symbol to your watchlist and to view watchlist. |
12Stocks.com List of ETFs that track Smallcap Index
| Ticker | ETF Name | Watchlist | Recent Price | Smart Investing & Trading Score | Change % | Week % | Year-to-date % |
| IWM | iShares Russell 2000 | | 201.90 | 69 | 0.99 | 1.77 | 0.59% |
| IJR | iShares Core S&P Small-Cap | | 107.13 | 82 | 0.75 | 1.4 | -1.03% |
| VTWO | Vanguard Russell 2000 ETF | | 81.61 | 69 | 0.94 | 1.73 | 0.63% |
| IWN | iShares Russell 2000 Value | | 154.21 | 100 | 0.87 | 2.03 | -0.72% |
| IJS | iShares S&P Small-Cap 600 Value | | 98.72 | 64 | 0.71 | 1.57 | -4.22% |
| IWO | iShares Russell 2000 Growth | | 256.87 | 57 | 0.99 | 1.49 | 1.84% |
| IJT | iShares S&P Small-Cap 600 Growth | | 127.76 | 95 | 0.82 | 1.32 | 2.09% |
| XSLV | PowerShares S&P SmallCap Low Volatil ETF | | 43.22 | 87 | 0.19 | 1.17 | -2.11% |
| SBB | ProShares Short SmallCap600 | | 16.16 | 13 | -1.28 | -1.37 | 1.44% |
| SDD | ProShares UltraShort SmallCap600 | | 18.84 | 23 | -2.41 | -2.61 | 2.27% |
| SAA | ProShares Ultra SmallCap600 | | 23.59 | 69 | 2.86 | 2.39 | -5.45% |
| SMLV | SPDR SSGA US Small Cap Low Volatil ETF | | 109.69 | 87 | 0.78 | 2.01 | -2.52% |
| 12Stocks.com: Charts, Trends, Fundamental Data and Performances of SmallCap Stocks | |
|
We now take in-depth look at all SmallCap stocks including charts, multi-period performances and overall trends (as measured by Smart Investing & Trading Score). One can sort SmallCap stocks (click link to choose) by Daily, Weekly and by Year-to-Date performances. Also, one can sort by size of the company or by market capitalization. |
| Select Your Default Chart Type: | |||||
| |||||
| Click on stock symbol or name for detailed view. Click on to add stock symbol to your watchlist and to view watchlist. Quick View: Move mouse or cursor over "Daily" to quickly view daily technical stock chart and over "Weekly" to view weekly technical stock chart. | |||||

 | SIBN SI-BONE, Inc. |
| Sector: Health Care | |
| SubSector: Medical Appliances & Equipment | |
| MarketCap: 234.78 Millions | |
| Recent Price: 14.20 Smart Investing & Trading Score: 18 | |
| Day Percent Change: -2.81% Day Change: -0.41 | |
| Week Change: -2.54% Year-to-date Change: -32.4% | |
| SIBN Links: Profile News Message Board | |
| Charts:- Daily , Weekly | |
| Add SIBN to Watchlist: View: Get Complete SIBN Trend Analysis ➞ | |
 | PLSE Pulse Biosciences, Inc. |
| Sector: Health Care | |
| SubSector: Medical Instruments & Supplies | |
| MarketCap: 131.96 Millions | |
| Recent Price: 7.82 Smart Investing & Trading Score: 64 | |
| Day Percent Change: -2.86% Day Change: -0.23 | |
| Week Change: 8.76% Year-to-date Change: -36.1% | |
| PLSE Links: Profile News Message Board | |
| Charts:- Daily , Weekly | |
| Add PLSE to Watchlist: View: Get Complete PLSE Trend Analysis ➞ | |
 | SPWH Sportsman s Warehouse Holdings, Inc. |
| Sector: Consumer Staples | |
| SubSector: Sporting Goods | |
| MarketCap: 247.144 Millions | |
| Recent Price: 3.21 Smart Investing & Trading Score: 27 | |
| Day Percent Change: -2.87% Day Change: -0.10 | |
| Week Change: -2.73% Year-to-date Change: -24.7% | |
| SPWH Links: Profile News Message Board | |
| Charts:- Daily , Weekly | |
| Add SPWH to Watchlist: View: Get Complete SPWH Trend Analysis ➞ | |
 | TWKS Thoughtworks Holding, Inc. |
| Sector: Technology | |
| SubSector: Information Technology Services | |
| MarketCap: 2370 Millions | |
| Recent Price: 2.25 Smart Investing & Trading Score: 20 | |
| Day Percent Change: -3.02% Day Change: -0.07 | |
| Week Change: -5.86% Year-to-date Change: -53.7% | |
| TWKS Links: Profile News Message Board | |
| Charts:- Daily , Weekly | |
| Add TWKS to Watchlist: View: Get Complete TWKS Trend Analysis ➞ | |
 | FLYW Flywire Corporation |
| Sector: Technology | |
| SubSector: Software - Infrastructure | |
| MarketCap: 3390 Millions | |
| Recent Price: 19.57 Smart Investing & Trading Score: 0 | |
| Day Percent Change: -3.02% Day Change: -0.61 | |
| Week Change: -5.87% Year-to-date Change: -16.5% | |
| FLYW Links: Profile News Message Board | |
| Charts:- Daily , Weekly | |
| Add FLYW to Watchlist: View: Get Complete FLYW Trend Analysis ➞ | |
 | UIS Unisys Corporation |
| Sector: Technology | |
| SubSector: Information Technology Services | |
| MarketCap: 803.868 Millions | |
| Recent Price: 5.08 Smart Investing & Trading Score: 0 | |
| Day Percent Change: -3.05% Day Change: -0.16 | |
| Week Change: -6.96% Year-to-date Change: -9.6% | |
| UIS Links: Profile News Message Board | |
| Charts:- Daily , Weekly | |
| Add UIS to Watchlist: View: Get Complete UIS Trend Analysis ➞ | |
 | BFS Saul Centers, Inc. |
| Sector: Financials | |
| SubSector: REIT - Retail | |
| MarketCap: 689.914 Millions | |
| Recent Price: 35.98 Smart Investing & Trading Score: 38 | |
| Day Percent Change: -3.07% Day Change: -1.14 | |
| Week Change: 1.27% Year-to-date Change: -8.4% | |
| BFS Links: Profile News Message Board | |
| Charts:- Daily , Weekly | |
| Add BFS to Watchlist: View: Get Complete BFS Trend Analysis ➞ | |
 | VVI Viad Corp |
| Sector: Services & Goods | |
| SubSector: Business Services | |
| MarketCap: 270.682 Millions | |
| Recent Price: 34.20 Smart Investing & Trading Score: 0 | |
| Day Percent Change: -3.09% Day Change: -1.09 | |
| Week Change: -2.65% Year-to-date Change: -5.5% | |
| VVI Links: Profile News Message Board | |
| Charts:- Daily , Weekly | |
| Add VVI to Watchlist: View: Get Complete VVI Trend Analysis ➞ | |
 | SIG Signet Jewelers Limited |
| Sector: Services & Goods | |
| SubSector: Jewelry Stores | |
| MarketCap: 518.1 Millions | |
| Recent Price: 94.35 Smart Investing & Trading Score: 0 | |
| Day Percent Change: -3.13% Day Change: -3.05 | |
| Week Change: -7.32% Year-to-date Change: -12.0% | |
| SIG Links: Profile News Message Board | |
| Charts:- Daily , Weekly | |
| Add SIG to Watchlist: View: Get Complete SIG Trend Analysis ➞ | |
 | RELY Remitly Global, Inc. |
| Sector: Technology | |
| SubSector: Software - Infrastructure | |
| MarketCap: 3320 Millions | |
| Recent Price: 14.91 Smart Investing & Trading Score: 71 | |
| Day Percent Change: -3.18% Day Change: -0.49 | |
| Week Change: -17.44% Year-to-date Change: -23.2% | |
| RELY Links: Profile News Message Board | |
| Charts:- Daily , Weekly | |
| Add RELY to Watchlist: View: Get Complete RELY Trend Analysis ➞ | |
 | ULH Universal Logistics Holdings, Inc. |
| Sector: Transports | |
| SubSector: Trucking | |
| MarketCap: 354.915 Millions | |
| Recent Price: 42.53 Smart Investing & Trading Score: 68 | |
| Day Percent Change: -3.21% Day Change: -1.41 | |
| Week Change: -7.22% Year-to-date Change: 51.8% | |
| ULH Links: Profile News Message Board | |
| Charts:- Daily , Weekly | |
| Add ULH to Watchlist: View: Get Complete ULH Trend Analysis ➞ | |
 | CCO Clear Channel Outdoor Holdings, Inc. |
| Sector: Services & Goods | |
| SubSector: Marketing Services | |
| MarketCap: 312.715 Millions | |
| Recent Price: 1.50 Smart Investing & Trading Score: 52 | |
| Day Percent Change: -3.23% Day Change: -0.05 | |
| Week Change: 4.17% Year-to-date Change: -17.6% | |
| CCO Links: Profile News Message Board | |
| Charts:- Daily , Weekly | |
| Add CCO to Watchlist: View: Get Complete CCO Trend Analysis ➞ | |
 | ELA Envela Corporation |
| Sector: Services & Goods | |
| SubSector: Specialty Retail, Other | |
| MarketCap: 73.5944 Millions | |
| Recent Price: 4.47 Smart Investing & Trading Score: 100 | |
| Day Percent Change: -3.25% Day Change: -0.15 | |
| Week Change: 2.05% Year-to-date Change: -8.0% | |
| ELA Links: Profile News Message Board | |
| Charts:- Daily , Weekly | |
| Add ELA to Watchlist: View: Get Complete ELA Trend Analysis ➞ | |
 | DFH Dream Finders Homes, Inc. |
| Sector: Services & Goods | |
| SubSector: Residential Construction | |
| MarketCap: 2270 Millions | |
| Recent Price: 31.16 Smart Investing & Trading Score: 7 | |
| Day Percent Change: -3.27% Day Change: -1.05 | |
| Week Change: -14.12% Year-to-date Change: -13.4% | |
| DFH Links: Profile News Message Board | |
| Charts:- Daily , Weekly | |
| Add DFH to Watchlist: View: Get Complete DFH Trend Analysis ➞ | |
 | WISH ContextLogic Inc. |
| Sector: Services & Goods | |
| SubSector: Internet Retail | |
| MarketCap: 165 Millions | |
| Recent Price: 5.31 Smart Investing & Trading Score: 20 | |
| Day Percent Change: -3.28% Day Change: -0.18 | |
| Week Change: -8.13% Year-to-date Change: -10.7% | |
| WISH Links: Profile News Message Board | |
| Charts:- Daily , Weekly | |
| Add WISH to Watchlist: View: Get Complete WISH Trend Analysis ➞ | |
 | USNA USANA Health Sciences, Inc. |
| Sector: Health Care | |
| SubSector: Drug Related Products | |
| MarketCap: 1185.13 Millions | |
| Recent Price: 45.55 Smart Investing & Trading Score: 67 | |
| Day Percent Change: -3.29% Day Change: -1.55 | |
| Week Change: 4.78% Year-to-date Change: -15.0% | |
| USNA Links: Profile News Message Board | |
| Charts:- Daily , Weekly | |
| Add USNA to Watchlist: View: Get Complete USNA Trend Analysis ➞ | |
 | ZVIA Zevia PBC |
| Sector: Consumer Staples | |
| SubSector: Beverages - Non-Alcoholic | |
| MarketCap: 303 Millions | |
| Recent Price: 0.87 Smart Investing & Trading Score: 25 | |
| Day Percent Change: -3.32% Day Change: -0.03 | |
| Week Change: 8.77% Year-to-date Change: -56.8% | |
| ZVIA Links: Profile News Message Board | |
| Charts:- Daily , Weekly | |
| Add ZVIA to Watchlist: View: Get Complete ZVIA Trend Analysis ➞ | |
 | JBSS John B. Sanfilippo & Son, Inc. |
| Sector: Consumer Staples | |
| SubSector: Processed & Packaged Goods | |
| MarketCap: 899.748 Millions | |
| Recent Price: 97.98 Smart Investing & Trading Score: 15 | |
| Day Percent Change: -3.34% Day Change: -3.39 | |
| Week Change: -1.29% Year-to-date Change: -4.9% | |
| JBSS Links: Profile News Message Board | |
| Charts:- Daily , Weekly | |
| Add JBSS to Watchlist: View: Get Complete JBSS Trend Analysis ➞ | |
 | PRLD Prelude Therapeutics Incorporated |
| Sector: Health Care | |
| SubSector: Biotechnology | |
| MarketCap: 26087 Millions | |
| Recent Price: 3.86 Smart Investing & Trading Score: 37 | |
| Day Percent Change: -3.38% Day Change: -0.14 | |
| Week Change: -5.28% Year-to-date Change: -11.4% | |
| PRLD Links: Profile News Message Board | |
| Charts:- Daily , Weekly | |
| Add PRLD to Watchlist: View: Get Complete PRLD Trend Analysis ➞ | |
 | LNTH Lantheus Holdings, Inc. |
| Sector: Health Care | |
| SubSector: Medical Appliances & Equipment | |
| MarketCap: 467.18 Millions | |
| Recent Price: 75.53 Smart Investing & Trading Score: 100 | |
| Day Percent Change: -3.39% Day Change: -2.65 | |
| Week Change: 15.21% Year-to-date Change: 21.8% | |
| LNTH Links: Profile News Message Board | |
| Charts:- Daily , Weekly | |
| Add LNTH to Watchlist: View: Get Complete LNTH Trend Analysis ➞ | |
 | NEOG Neogen Corporation |
| Sector: Health Care | |
| SubSector: Diagnostic Substances | |
| MarketCap: 3234.71 Millions | |
| Recent Price: 12.02 Smart Investing & Trading Score: 17 | |
| Day Percent Change: -3.45% Day Change: -0.43 | |
| Week Change: -0.99% Year-to-date Change: -40.2% | |
| NEOG Links: Profile News Message Board | |
| Charts:- Daily , Weekly | |
| Add NEOG to Watchlist: View: Get Complete NEOG Trend Analysis ➞ | |
 | FSLY Fastly, Inc. |
| Sector: Technology | |
| SubSector: Application Software | |
| MarketCap: 1973.72 Millions | |
| Recent Price: 8.48 Smart Investing & Trading Score: 7 | |
| Day Percent Change: -3.53% Day Change: -0.31 | |
| Week Change: -34.52% Year-to-date Change: -52.4% | |
| FSLY Links: Profile News Message Board | |
| Charts:- Daily , Weekly | |
| Add FSLY to Watchlist: View: Get Complete FSLY Trend Analysis ➞ | |
 | SENEA Seneca Foods Corporation |
| Sector: Consumer Staples | |
| SubSector: Processed & Packaged Goods | |
| MarketCap: 326.348 Millions | |
| Recent Price: 57.86 Smart Investing & Trading Score: 71 | |
| Day Percent Change: -3.57% Day Change: -2.14 | |
| Week Change: -0.05% Year-to-date Change: 10.3% | |
| SENEA Links: Profile News Message Board | |
| Charts:- Daily , Weekly | |
| Add SENEA to Watchlist: View: Get Complete SENEA Trend Analysis ➞ | |
 | KWR Quaker Chemical Corporation |
| Sector: Materials | |
| SubSector: Specialty Chemicals | |
| MarketCap: 2411.67 Millions | |
| Recent Price: 185.56 Smart Investing & Trading Score: 8 | |
| Day Percent Change: -3.71% Day Change: -7.14 | |
| Week Change: -2.45% Year-to-date Change: -13.1% | |
| KWR Links: Profile News Message Board | |
| Charts:- Daily , Weekly | |
| Add KWR to Watchlist: View: Get Complete KWR Trend Analysis ➞ | |
 | NN NextNav Inc. |
| Sector: Technology | |
| SubSector: Software - Infrastructure | |
| MarketCap: 314 Millions | |
| Recent Price: 8.93 Smart Investing & Trading Score: 56 | |
| Day Percent Change: -3.88% Day Change: -0.36 | |
| Week Change: -5.2% Year-to-date Change: 100.7% | |
| NN Links: Profile News Message Board | |
| Charts:- Daily , Weekly | |
| Add NN to Watchlist: View: Get Complete NN Trend Analysis ➞ | |
| Too many stocks? View smallcap stocks filtered by marketcap & sector |
| Marketcap: All SmallCap Stocks (default-no microcap), Large, Mid-Range, Small & MicroCap |
| Sector: Tech, Finance, Energy, Staples, Retail, Industrial, Materials, Utilities & Medical |
|
Best Stocks Today 12Stocks.com |
© 2024 12Stocks.com Terms & Conditions Privacy Contact Us
All Information Provided Only For Education And Not To Be Used For Investing or Trading. See Terms & Conditions


One More Thing ... Get Best Stocks Delivered Daily!
Never Ever Miss A Move With Our Top Ten Stocks Lists
Find Best Stocks In Any Market - Bull or Bear Market
Take A Peek At Our Top Ten Stocks Lists: Daily, Weekly, Year-to-Date & Top Trends
Find Best Stocks In Any Market - Bull or Bear Market
Take A Peek At Our Top Ten Stocks Lists: Daily, Weekly, Year-to-Date & Top Trends
Smallcap Stocks With Best Up Trends [0-bearish to 100-bullish]: Twist Bioscience[100], WideOpenWest [100], Joint [100], FTC Solar[100], Origin Materials[100], Alignment Healthcare[100], Clarus [100], IES [100], Emergent BioSolutions[100], Enovix [100], El Pollo[100]
Best Smallcap Stocks Year-to-Date:
Janux [482.74%], Viking [313.59%], Longboard [272.5%], Alpine Immune[239.29%], Bakkt [199.55%], Avidity Biosciences[192.48%], Vera [189.47%], Cullinan Oncology[176.9%], Super Micro[175.35%], Y-mAbs [151.47%], Sana [149.33%] Best Smallcap Stocks This Week:
Emergent BioSolutions[102.6%], Deciphera [73.24%], Origin Materials[66.52%], Eyenovia [60.78%], Cue Biopharma[56.04%], Aspen Aerogels[55.96%], Enovix [54.02%], Luna Innovations[53.77%], Codexis [47.37%], Carvana Co[44.31%], Office Properties[42.79%] Best Smallcap Stocks Daily:
Luna Innovations[36.00%], Twist Bioscience[28.74%], Ardelyx [28.42%], WideOpenWest [28.23%], 2U [26.63%], Joint [25.35%], FTC Solar[25.09%], Origin Materials[22.23%], Alignment Healthcare[21.97%], Clarus [18.67%], Aurora Innovation[18.09%]