
 Login Sign Up


| |||||
 |  | ||||

| 12Stocks.com Market Intelligence |
Best SmallCap Stocks
|
| In a hurry? Small Cap Stock Lists: Performance Trends Table, Stock Charts
Sort Small Cap stocks: Daily, Weekly, Year-to-Date, Market Cap & Trends. Filter Small Cap stocks list by sector: Show all, Tech, Finance, Energy, Staples, Retail, Industrial, Materials, Utilities and HealthCare Filter Small Cap stocks list by size: All Large Medium Small and MicroCap |
| 12Stocks.com Small Cap Stocks Performances & Trends Daily | |||||||||
|
|  The overall Smart Investing & Trading Score is 69 (0-bearish to 100-bullish) which puts Small Cap index in short term neutral to bullish trend. The Smart Investing & Trading Score from previous trading session is 49 and hence an improvement of trend.
| ||||||||
Here are the Smart Investing & Trading Scores of the most requested small cap stocks at 12Stocks.com (click stock name for detailed review):
|


| 12Stocks.com: Investing in Smallcap Index with Stocks | |
|
The following table helps investors and traders sort through current performance and trends (as measured by Smart Investing & Trading Score) of various
stocks in the Smallcap Index. Quick View: Move mouse or cursor over stock symbol (ticker) to view short-term technical chart and over stock name to view long term chart. Click on  to add stock symbol to your watchlist and to add stock symbol to your watchlist and  to view watchlist. Click on any ticker or stock name for detailed market intelligence report for that stock. to view watchlist. Click on any ticker or stock name for detailed market intelligence report for that stock. |
12Stocks.com Performance of Stocks in Smallcap Index
| Ticker | Stock Name | Watchlist | Category | Recent Price | Smart Investing & Trading Score | Change % | YTD Change% |
| SP | SP Plus |   | Services & Goods | 51.51 | 62 | 0.02 | 0.51% |
| NARI | Inari Medical | | Health Care | 42.00 | 74 | 0.02 | -35.32% |
| IOSP | Innospec | | Materials | 121.71 | 32 | 0.01 | -1.24% |
| AEL | American Equity | | Financials | 56.47 | 73 | 0.00 | 1.20% |
| ANIK | Anika | | Health Care | 27.59 | 100 | 0.00 | 21.76% |
| MLP | Maui Land | | Financials | 20.12 | 73 | 0.00 | 26.62% |
| SMMF | Summit Financial | | Financials | 25.70 | 15 | 0.00 | -16.26% |
| AVD | American Vanguard | | Materials | 11.77 | 90 | 0.00 | 7.29% |
| GTY | Getty Realty | | Financials | 27.65 | 100 | 0.00 | -5.37% |
| TAST | Carrols Restaurant | | Services & Goods | 9.52 | 45 | 0.00 | 20.81% |
| PRTS | U.S. Auto | | Consumer Staples | 1.28 | 52 | 0.00 | -59.49% |
| ATRI | Atrion | | Health Care | 414.95 | 65 | 0.00 | 9.55% |
| EPM | Evolution | | Energy | 5.53 | 42 | 0.00 | -4.82% |
| OPK | OPKO Health | | Health Care | 1.30 | 95 | 0.00 | -13.91% |
| DOOR | Masonite | | Industrials | 132.70 | 78 | 0.00 | 56.74% |
| COLL | Collegium Pharmaceutical | | Health Care | 37.51 | 80 | 0.00 | 21.86% |
| EVBG | Everbridge | | Technology | 34.80 | 56 | 0.00 | 43.15% |
| AKTS | Akoustis | | Technology | 0.60 | 37 | 0.00 | -28.06% |
| DCPH | Deciphera | | Health Care | 25.38 | 88 | 0.00 | 57.35% |
| SCPH | sc | | Health Care | 4.66 | 59 | 0.00 | -25.68% |
| ORGO | Organogenesis | | Health Care | 2.49 | 42 | 0.00 | -39.12% |
| AVO | Mission Produce | | Consumer Staples | 11.79 | 90 | 0.00 | 16.50% |
| USCB | USCB Financial | | Financials | 11.91 | 100 | 0.00 | -3.01% |
| DC | Dakota Gold | | Materials | 2.42 | 53 | 0.00 | -6.92% |
| BARK | BARK | | Services & Goods | 1.16 | 54 | 0.00 | 44.96% |


| Too many stocks? View smallcap stocks filtered by marketcap & sector |
| Marketcap: All SmallCap Stocks (default-no microcap), Large, Mid-Range, Small |
| Smallcap Sector: Tech, Finance, Energy, Staples, Retail, Industrial, Materials, & Medical |
|
Get the most comprehensive stock market coverage daily at 12Stocks.com ➞ Best Stocks Today ➞ Best Stocks Weekly ➞ Best Stocks Year-to-Date ➞ Best Stocks Trends ➞  Best Stocks Today 12Stocks.com Best Nasdaq Stocks ➞ Best S&P 500 Stocks ➞ Best Tech Stocks ➞ Best Biotech Stocks ➞ |
| Detailed Overview of SmallCap Stocks |
| SmallCap Technical Overview, Leaders & Laggards, Top SmallCap ETF Funds & Detailed SmallCap Stocks List, Charts, Trends & More |
| Smallcap: Technical Analysis, Trends & YTD Performance | |
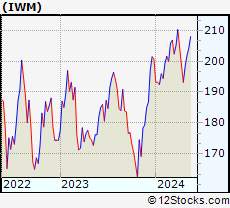
| SmallCap segment as represented by
IWM, an exchange-traded fund [ETF], holds basket of thousands of smallcap stocks from across all major sectors of the US stock market. The smallcap index (contains stocks like Riverbed & Sotheby's) is up by 0.59% and is currently underperforming the overall market by -6.29% year-to-date. Below is a quick view of technical charts and trends: | |
 IWM Weekly Chart |
|
| Long Term Trend: Not Good | |
| Medium Term Trend: Very Good | |
 IWM Daily Chart |
|
| Short Term Trend: Very Good | |
| Overall Trend Score: 69 | |
| YTD Performance: 0.59% | |
| **Trend Scores & Views Are Only For Educational Purposes And Not For Investing | |
| 12Stocks.com: Top Performing Small Cap Index Stocks | ||||||||||||||||||||||||||||||||||||||||||||||||
 The top performing Small Cap Index stocks year to date are
Now, more recently, over last week, the top performing Small Cap Index stocks on the move are


|
||||||||||||||||||||||||||||||||||||||||||||||||
| 12Stocks.com: Investing in Smallcap Index using Exchange Traded Funds | |
|
The following table shows list of key exchange traded funds (ETF) that
help investors track Smallcap index. The following list also includes leveraged ETF funds that track twice or thrice the daily returns of Smallcap indices. Short or inverse ETF funds move in the opposite direction to the index they track and are useful during market pullbacks or during bear markets. Quick View: Move mouse or cursor over ETF symbol (ticker) to view short-term technical chart and over ETF name to view long term chart. Click on ticker or stock name for detailed view. Click on to add stock symbol to your watchlist and to view watchlist. |
12Stocks.com List of ETFs that track Smallcap Index
| Ticker | ETF Name | Watchlist | Recent Price | Smart Investing & Trading Score | Change % | Week % | Year-to-date % |
| IWM | iShares Russell 2000 | | 201.90 | 69 | 0.99 | 1.77 | 0.59% |
| IJR | iShares Core S&P Small-Cap | | 107.13 | 82 | 0.75 | 1.4 | -1.03% |
| VTWO | Vanguard Russell 2000 ETF | | 81.61 | 69 | 0.94 | 1.73 | 0.63% |
| IWN | iShares Russell 2000 Value | | 154.21 | 100 | 0.87 | 2.03 | -0.72% |
| IJS | iShares S&P Small-Cap 600 Value | | 98.72 | 64 | 0.71 | 1.57 | -4.22% |
| IWO | iShares Russell 2000 Growth | | 256.87 | 57 | 0.99 | 1.49 | 1.84% |
| IJT | iShares S&P Small-Cap 600 Growth | | 127.76 | 95 | 0.82 | 1.32 | 2.09% |
| XSLV | PowerShares S&P SmallCap Low Volatil ETF | | 43.22 | 87 | 0.19 | 1.17 | -2.11% |
| SBB | ProShares Short SmallCap600 | | 16.16 | 13 | -1.28 | -1.37 | 1.44% |
| SDD | ProShares UltraShort SmallCap600 | | 18.84 | 23 | -2.41 | -2.61 | 2.27% |
| SAA | ProShares Ultra SmallCap600 | | 23.59 | 69 | 2.86 | 2.39 | -5.45% |
| SMLV | SPDR SSGA US Small Cap Low Volatil ETF | | 109.69 | 87 | 0.78 | 2.01 | -2.52% |
| 12Stocks.com: Charts, Trends, Fundamental Data and Performances of SmallCap Stocks | |
|
We now take in-depth look at all SmallCap stocks including charts, multi-period performances and overall trends (as measured by Smart Investing & Trading Score). One can sort SmallCap stocks (click link to choose) by Daily, Weekly and by Year-to-Date performances. Also, one can sort by size of the company or by market capitalization. |
| Select Your Default Chart Type: | |||||
| |||||
| Click on stock symbol or name for detailed view. Click on to add stock symbol to your watchlist and to view watchlist. Quick View: Move mouse or cursor over "Daily" to quickly view daily technical stock chart and over "Weekly" to view weekly technical stock chart. | |||||

 | SP SP Plus Corporation |
| Sector: Services & Goods | |
| SubSector: Management Services | |
| MarketCap: 494.545 Millions | |
| Recent Price: 51.51 Smart Investing & Trading Score: 62 | |
| Day Percent Change: 0.02% Day Change: 0.01 | |
| Week Change: 0.7% Year-to-date Change: 0.5% | |
| SP Links: Profile News Message Board | |
| Charts:- Daily , Weekly | |
| Add SP to Watchlist: View: Get Complete SP Trend Analysis ➞ | |
 | NARI Inari Medical, Inc. |
| Sector: Health Care | |
| SubSector: Medical Devices | |
| MarketCap: 33287 Millions | |
| Recent Price: 42.00 Smart Investing & Trading Score: 74 | |
| Day Percent Change: 0.02% Day Change: 0.01 | |
| Week Change: 9.32% Year-to-date Change: -35.3% | |
| NARI Links: Profile News Message Board | |
| Charts:- Daily , Weekly | |
| Add NARI to Watchlist: View: Get Complete NARI Trend Analysis ➞ | |
 | IOSP Innospec Inc. |
| Sector: Materials | |
| SubSector: Specialty Chemicals | |
| MarketCap: 1665.57 Millions | |
| Recent Price: 121.71 Smart Investing & Trading Score: 32 | |
| Day Percent Change: 0.01% Day Change: 0.01 | |
| Week Change: 0.49% Year-to-date Change: -1.2% | |
| IOSP Links: Profile News Message Board | |
| Charts:- Daily , Weekly | |
| Add IOSP to Watchlist: View: Get Complete IOSP Trend Analysis ➞ | |
 | AEL American Equity Investment Life Holding Company |
| Sector: Financials | |
| SubSector: Life Insurance | |
| MarketCap: 1304.46 Millions | |
| Recent Price: 56.47 Smart Investing & Trading Score: 73 | |
| Day Percent Change: 0.00% Day Change: 0.00 | |
| Week Change: 0.28% Year-to-date Change: 1.2% | |
| AEL Links: Profile News Message Board | |
| Charts:- Daily , Weekly | |
| Add AEL to Watchlist: View: Get Complete AEL Trend Analysis ➞ | |
 | ANIK Anika Therapeutics, Inc. |
| Sector: Health Care | |
| SubSector: Biotechnology | |
| MarketCap: 438.385 Millions | |
| Recent Price: 27.59 Smart Investing & Trading Score: 100 | |
| Day Percent Change: 0.00% Day Change: 0.00 | |
| Week Change: 7.9% Year-to-date Change: 21.8% | |
| ANIK Links: Profile News Message Board | |
| Charts:- Daily , Weekly | |
| Add ANIK to Watchlist: View: Get Complete ANIK Trend Analysis ➞ | |
 | MLP Maui Land & Pineapple Company, Inc. |
| Sector: Financials | |
| SubSector: Real Estate Development | |
| MarketCap: 186.619 Millions | |
| Recent Price: 20.12 Smart Investing & Trading Score: 73 | |
| Day Percent Change: 0.00% Day Change: 0.00 | |
| Week Change: 1.56% Year-to-date Change: 26.6% | |
| MLP Links: Profile News Message Board | |
| Charts:- Daily , Weekly | |
| Add MLP to Watchlist: View: Get Complete MLP Trend Analysis ➞ | |
 | SMMF Summit Financial Group, Inc. |
| Sector: Financials | |
| SubSector: Regional - Mid-Atlantic Banks | |
| MarketCap: 228.959 Millions | |
| Recent Price: 25.70 Smart Investing & Trading Score: 15 | |
| Day Percent Change: 0.00% Day Change: 0.00 | |
| Week Change: -6.38% Year-to-date Change: -16.3% | |
| SMMF Links: Profile News Message Board | |
| Charts:- Daily , Weekly | |
| Add SMMF to Watchlist: View: Get Complete SMMF Trend Analysis ➞ | |
 | AVD American Vanguard Corporation |
| Sector: Materials | |
| SubSector: Agricultural Chemicals | |
| MarketCap: 419.329 Millions | |
| Recent Price: 11.77 Smart Investing & Trading Score: 90 | |
| Day Percent Change: 0.00% Day Change: 0.00 | |
| Week Change: 2.62% Year-to-date Change: 7.3% | |
| AVD Links: Profile News Message Board | |
| Charts:- Daily , Weekly | |
| Add AVD to Watchlist: View: Get Complete AVD Trend Analysis ➞ | |
 | GTY Getty Realty Corp. |
| Sector: Financials | |
| SubSector: REIT - Retail | |
| MarketCap: 926.114 Millions | |
| Recent Price: 27.65 Smart Investing & Trading Score: 100 | |
| Day Percent Change: 0.00% Day Change: 0.00 | |
| Week Change: 2.71% Year-to-date Change: -5.4% | |
| GTY Links: Profile News Message Board | |
| Charts:- Daily , Weekly | |
| Add GTY to Watchlist: View: Get Complete GTY Trend Analysis ➞ | |
 | TAST Carrols Restaurant Group, Inc. |
| Sector: Services & Goods | |
| SubSector: Restaurants | |
| MarketCap: 75.657 Millions | |
| Recent Price: 9.52 Smart Investing & Trading Score: 45 | |
| Day Percent Change: 0.00% Day Change: 0.00 | |
| Week Change: 0.11% Year-to-date Change: 20.8% | |
| TAST Links: Profile News Message Board | |
| Charts:- Daily , Weekly | |
| Add TAST to Watchlist: View: Get Complete TAST Trend Analysis ➞ | |
 | PRTS U.S. Auto Parts Network, Inc. |
| Sector: Consumer Staples | |
| SubSector: Auto Parts | |
| MarketCap: 65.0939 Millions | |
| Recent Price: 1.28 Smart Investing & Trading Score: 52 | |
| Day Percent Change: 0.00% Day Change: 0.00 | |
| Week Change: 5.79% Year-to-date Change: -59.5% | |
| PRTS Links: Profile News Message Board | |
| Charts:- Daily , Weekly | |
| Add PRTS to Watchlist: View: Get Complete PRTS Trend Analysis ➞ | |
 | ATRI Atrion Corporation |
| Sector: Health Care | |
| SubSector: Medical Instruments & Supplies | |
| MarketCap: 1234.6 Millions | |
| Recent Price: 414.95 Smart Investing & Trading Score: 65 | |
| Day Percent Change: 0.00% Day Change: 0.00 | |
| Week Change: 5.05% Year-to-date Change: 9.6% | |
| ATRI Links: Profile News Message Board | |
| Charts:- Daily , Weekly | |
| Add ATRI to Watchlist: View: Get Complete ATRI Trend Analysis ➞ | |
 | EPM Evolution Petroleum Corporation |
| Sector: Energy | |
| SubSector: Independent Oil & Gas | |
| MarketCap: 98.0593 Millions | |
| Recent Price: 5.53 Smart Investing & Trading Score: 42 | |
| Day Percent Change: 0.00% Day Change: 0.00 | |
| Week Change: -4.49% Year-to-date Change: -4.8% | |
| EPM Links: Profile News Message Board | |
| Charts:- Daily , Weekly | |
| Add EPM to Watchlist: View: Get Complete EPM Trend Analysis ➞ | |
 | OPK OPKO Health, Inc. |
| Sector: Health Care | |
| SubSector: Biotechnology | |
| MarketCap: 1116.05 Millions | |
| Recent Price: 1.30 Smart Investing & Trading Score: 95 | |
| Day Percent Change: 0.00% Day Change: 0.00 | |
| Week Change: 3.17% Year-to-date Change: -13.9% | |
| OPK Links: Profile News Message Board | |
| Charts:- Daily , Weekly | |
| Add OPK to Watchlist: View: Get Complete OPK Trend Analysis ➞ | |
 | DOOR Masonite International Corporation |
| Sector: Industrials | |
| SubSector: General Building Materials | |
| MarketCap: 1220.53 Millions | |
| Recent Price: 132.70 Smart Investing & Trading Score: 78 | |
| Day Percent Change: 0.00% Day Change: 0.00 | |
| Week Change: 0.83% Year-to-date Change: 56.7% | |
| DOOR Links: Profile News Message Board | |
| Charts:- Daily , Weekly | |
| Add DOOR to Watchlist: View: Get Complete DOOR Trend Analysis ➞ | |
 | COLL Collegium Pharmaceutical, Inc. |
| Sector: Health Care | |
| SubSector: Drugs - Generic | |
| MarketCap: 569.185 Millions | |
| Recent Price: 37.51 Smart Investing & Trading Score: 80 | |
| Day Percent Change: 0.00% Day Change: 0.00 | |
| Week Change: 2.99% Year-to-date Change: 21.9% | |
| COLL Links: Profile News Message Board | |
| Charts:- Daily , Weekly | |
| Add COLL to Watchlist: View: Get Complete COLL Trend Analysis ➞ | |
 | EVBG Everbridge, Inc. |
| Sector: Technology | |
| SubSector: Application Software | |
| MarketCap: 3697.92 Millions | |
| Recent Price: 34.80 Smart Investing & Trading Score: 56 | |
| Day Percent Change: 0.00% Day Change: 0.00 | |
| Week Change: -0.23% Year-to-date Change: 43.2% | |
| EVBG Links: Profile News Message Board | |
| Charts:- Daily , Weekly | |
| Add EVBG to Watchlist: View: Get Complete EVBG Trend Analysis ➞ | |
 | AKTS Akoustis Technologies, Inc. |
| Sector: Technology | |
| SubSector: Communication Equipment | |
| MarketCap: 197.039 Millions | |
| Recent Price: 0.60 Smart Investing & Trading Score: 37 | |
| Day Percent Change: 0.00% Day Change: 0.00 | |
| Week Change: 9.85% Year-to-date Change: -28.1% | |
| AKTS Links: Profile News Message Board | |
| Charts:- Daily , Weekly | |
| Add AKTS to Watchlist: View: Get Complete AKTS Trend Analysis ➞ | |
 | DCPH Deciphera Pharmaceuticals, Inc. |
| Sector: Health Care | |
| SubSector: Biotechnology | |
| MarketCap: 2329.95 Millions | |
| Recent Price: 25.38 Smart Investing & Trading Score: 88 | |
| Day Percent Change: 0.00% Day Change: 0.00 | |
| Week Change: 73.24% Year-to-date Change: 57.4% | |
| DCPH Links: Profile News Message Board | |
| Charts:- Daily , Weekly | |
| Add DCPH to Watchlist: View: Get Complete DCPH Trend Analysis ➞ | |
 | SCPH scPharmaceuticals Inc. |
| Sector: Health Care | |
| SubSector: Biotechnology | |
| MarketCap: 136.185 Millions | |
| Recent Price: 4.66 Smart Investing & Trading Score: 59 | |
| Day Percent Change: 0.00% Day Change: 0.00 | |
| Week Change: 3.79% Year-to-date Change: -25.7% | |
| SCPH Links: Profile News Message Board | |
| Charts:- Daily , Weekly | |
| Add SCPH to Watchlist: View: Get Complete SCPH Trend Analysis ➞ | |
 | ORGO Organogenesis Holdings Inc. |
| Sector: Health Care | |
| SubSector: Drugs - Generic | |
| MarketCap: 239.685 Millions | |
| Recent Price: 2.49 Smart Investing & Trading Score: 42 | |
| Day Percent Change: 0.00% Day Change: 0.00 | |
| Week Change: 5.96% Year-to-date Change: -39.1% | |
| ORGO Links: Profile News Message Board | |
| Charts:- Daily , Weekly | |
| Add ORGO to Watchlist: View: Get Complete ORGO Trend Analysis ➞ | |
 | AVO Mission Produce, Inc. |
| Sector: Consumer Staples | |
| SubSector: Farm Products | |
| MarketCap: 91347 Millions | |
| Recent Price: 11.79 Smart Investing & Trading Score: 90 | |
| Day Percent Change: 0.00% Day Change: 0.00 | |
| Week Change: 3.97% Year-to-date Change: 16.5% | |
| AVO Links: Profile News Message Board | |
| Charts:- Daily , Weekly | |
| Add AVO to Watchlist: View: Get Complete AVO Trend Analysis ➞ | |
 | USCB USCB Financial Holdings, Inc. |
| Sector: Financials | |
| SubSector: Banks - Regional | |
| MarketCap: 198 Millions | |
| Recent Price: 11.91 Smart Investing & Trading Score: 100 | |
| Day Percent Change: 0.00% Day Change: 0.00 | |
| Week Change: 11% Year-to-date Change: -3.0% | |
| USCB Links: Profile News Message Board | |
| Charts:- Daily , Weekly | |
| Add USCB to Watchlist: View: Get Complete USCB Trend Analysis ➞ | |
 | DC Dakota Gold Corp. |
| Sector: Materials | |
| SubSector: Gold | |
| MarketCap: 218 Millions | |
| Recent Price: 2.42 Smart Investing & Trading Score: 53 | |
| Day Percent Change: 0.00% Day Change: 0.00 | |
| Week Change: -5.84% Year-to-date Change: -6.9% | |
| DC Links: Profile News Message Board | |
| Charts:- Daily , Weekly | |
| Add DC to Watchlist: View: Get Complete DC Trend Analysis ➞ | |
 | BARK BARK, Inc. |
| Sector: Services & Goods | |
| SubSector: Specialty Retail | |
| MarketCap: 234 Millions | |
| Recent Price: 1.16 Smart Investing & Trading Score: 54 | |
| Day Percent Change: 0.00% Day Change: 0.00 | |
| Week Change: 5.45% Year-to-date Change: 45.0% | |
| BARK Links: Profile News Message Board | |
| Charts:- Daily , Weekly | |
| Add BARK to Watchlist: View: Get Complete BARK Trend Analysis ➞ | |
| Too many stocks? View smallcap stocks filtered by marketcap & sector |
| Marketcap: All SmallCap Stocks (default-no microcap), Large, Mid-Range, Small & MicroCap |
| Sector: Tech, Finance, Energy, Staples, Retail, Industrial, Materials, Utilities & Medical |
|
Best Stocks Today 12Stocks.com |
© 2024 12Stocks.com Terms & Conditions Privacy Contact Us
All Information Provided Only For Education And Not To Be Used For Investing or Trading. See Terms & Conditions


One More Thing ... Get Best Stocks Delivered Daily!
Never Ever Miss A Move With Our Top Ten Stocks Lists
Find Best Stocks In Any Market - Bull or Bear Market
Take A Peek At Our Top Ten Stocks Lists: Daily, Weekly, Year-to-Date & Top Trends
Find Best Stocks In Any Market - Bull or Bear Market
Take A Peek At Our Top Ten Stocks Lists: Daily, Weekly, Year-to-Date & Top Trends
Smallcap Stocks With Best Up Trends [0-bearish to 100-bullish]: Twist Bioscience[100], WideOpenWest [100], Joint [100], FTC Solar[100], Origin Materials[100], Alignment Healthcare[100], Clarus [100], IES [100], Emergent BioSolutions[100], Enovix [100], El Pollo[100]
Best Smallcap Stocks Year-to-Date:
Janux [482.74%], Viking [313.59%], Longboard [272.5%], Alpine Immune[239.29%], Bakkt [199.55%], Avidity Biosciences[192.48%], Vera [189.47%], Cullinan Oncology[176.9%], Super Micro[175.35%], Y-mAbs [151.47%], Sana [149.33%] Best Smallcap Stocks This Week:
Emergent BioSolutions[102.6%], Deciphera [73.24%], Origin Materials[66.52%], Eyenovia [60.78%], Cue Biopharma[56.04%], Aspen Aerogels[55.96%], Enovix [54.02%], Luna Innovations[53.77%], Codexis [47.37%], Carvana Co[44.31%], Office Properties[42.79%] Best Smallcap Stocks Daily:
Luna Innovations[36.00%], Twist Bioscience[28.74%], Ardelyx [28.42%], WideOpenWest [28.23%], 2U [26.63%], Joint [25.35%], FTC Solar[25.09%], Origin Materials[22.23%], Alignment Healthcare[21.97%], Clarus [18.67%], Aurora Innovation[18.09%]