
 Login Sign Up


| |||||
 |  | ||||

| 12Stocks.com Market Intelligence |
Best SmallCap Stocks
|
| In a hurry? Small Cap Stock Lists: Performance Trends Table, Stock Charts
Sort Small Cap stocks: Daily, Weekly, Year-to-Date, Market Cap & Trends. Filter Small Cap stocks list by sector: Show all, Tech, Finance, Energy, Staples, Retail, Industrial, Materials, Utilities and HealthCare Filter Small Cap stocks list by size: All Large Medium Small and MicroCap |
| 12Stocks.com Small Cap Stocks Performances & Trends Daily | |||||||||
|
|  The overall Smart Investing & Trading Score is 69 (0-bearish to 100-bullish) which puts Small Cap index in short term neutral to bullish trend. The Smart Investing & Trading Score from previous trading session is 49 and hence an improvement of trend.
| ||||||||
Here are the Smart Investing & Trading Scores of the most requested small cap stocks at 12Stocks.com (click stock name for detailed review):
|


| 12Stocks.com: Investing in Smallcap Index with Stocks | |
|
The following table helps investors and traders sort through current performance and trends (as measured by Smart Investing & Trading Score) of various
stocks in the Smallcap Index. Quick View: Move mouse or cursor over stock symbol (ticker) to view short-term technical chart and over stock name to view long term chart. Click on  to add stock symbol to your watchlist and to add stock symbol to your watchlist and  to view watchlist. Click on any ticker or stock name for detailed market intelligence report for that stock. to view watchlist. Click on any ticker or stock name for detailed market intelligence report for that stock. |
12Stocks.com Performance of Stocks in Smallcap Index
| Ticker | Stock Name | Watchlist | Category | Recent Price | Smart Investing & Trading Score | Change % | YTD Change% |
| METCB | Ramaco Resources |   | Materials | 11.09 | 8 | -3.98 | -16.30% |
| MQ | Marqeta | | Technology | 5.38 | 17 | -4.02 | -23.60% |
| TWI | Titan | | Industrials | 10.02 | 0 | -4.11 | -32.66% |
| UMH | UMH Properties | | Financials | 15.36 | 31 | -4.30 | 0.26% |
| FRSH | Freshworks | | Technology | 14.03 | 48 | -4.36 | -40.27% |
| AGYS | Agilysys | | Technology | 79.21 | 26 | -4.49 | -6.61% |
| ZYXI | Zynex | | Health Care | 11.00 | 15 | -4.68 | 1.01% |
| SHCR | Sharecare | | Health Care | 0.71 | 18 | -4.69 | -34.10% |
| SOUN | SoundHound AI | | Technology | 4.35 | 35 | -4.71 | 103.27% |
| AGS | PlayAGS | | Services & Goods | 8.36 | 0 | -4.89 | -0.83% |
| HBI | Hanesbrands | | Consumer Staples | 4.44 | 5 | -4.93 | -0.45% |
| VREX | Varex Imaging | | Health Care | 15.59 | 0 | -5.11 | -23.95% |
| PIII | P3 Health | | Health Care | 0.58 | 60 | -5.19 | -60.60% |
| MYRG | MYR Group | | Industrials | 143.92 | 0 | -5.31 | -0.49% |
| COMM | CommScope Holding | | Technology | 0.99 | 59 | -5.52 | -64.82% |
| FLR | Fluor | | Industrials | 38.90 | 26 | -5.67 | -0.69% |
| VIAV | Viavi Solutions | | Technology | 7.56 | 0 | -5.74 | -24.93% |
| ATMU | Atmus Filtration | | Industrials | 28.75 | 31 | -5.78 | 23.04% |
| FDP | Fresh Del | | Consumer Staples | 24.52 | 26 | -5.80 | -6.59% |
| OUT | Outfront Media | | Services & Goods | 15.09 | 36 | -5.92 | 8.09% |
| SRDX | Surmodics | | Health Care | 32.49 | 93 | -5.96 | -10.62% |
| ATRC | AtriCure | | Health Care | 20.89 | 0 | -5.99 | -41.47% |
| SSTK | Shutterstock | | Services & Goods | 39.24 | 0 | -6.01 | -18.72% |
| OBIO | Orchestra BioMed | | Health Care | 4.95 | 67 | -6.60 | -45.66% |
| ALTI | AlTi Global | | Financials | 4.57 | 10 | -6.84 | -49.67% |


| Too many stocks? View smallcap stocks filtered by marketcap & sector |
| Marketcap: All SmallCap Stocks (default-no microcap), Large, Mid-Range, Small |
| Smallcap Sector: Tech, Finance, Energy, Staples, Retail, Industrial, Materials, & Medical |
|
Get the most comprehensive stock market coverage daily at 12Stocks.com ➞ Best Stocks Today ➞ Best Stocks Weekly ➞ Best Stocks Year-to-Date ➞ Best Stocks Trends ➞  Best Stocks Today 12Stocks.com Best Nasdaq Stocks ➞ Best S&P 500 Stocks ➞ Best Tech Stocks ➞ Best Biotech Stocks ➞ |
| Detailed Overview of SmallCap Stocks |
| SmallCap Technical Overview, Leaders & Laggards, Top SmallCap ETF Funds & Detailed SmallCap Stocks List, Charts, Trends & More |
| Smallcap: Technical Analysis, Trends & YTD Performance | |
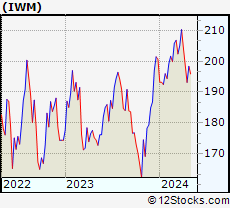
| SmallCap segment as represented by
IWM, an exchange-traded fund [ETF], holds basket of thousands of smallcap stocks from across all major sectors of the US stock market. The smallcap index (contains stocks like Riverbed & Sotheby's) is up by 0.59% and is currently underperforming the overall market by -6.29% year-to-date. Below is a quick view of technical charts and trends: | |
 IWM Weekly Chart |
|
| Long Term Trend: Not Good | |
| Medium Term Trend: Very Good | |
 IWM Daily Chart |
|
| Short Term Trend: Very Good | |
| Overall Trend Score: 69 | |
| YTD Performance: 0.59% | |
| **Trend Scores & Views Are Only For Educational Purposes And Not For Investing | |
| 12Stocks.com: Top Performing Small Cap Index Stocks | ||||||||||||||||||||||||||||||||||||||||||||||||
 The top performing Small Cap Index stocks year to date are
Now, more recently, over last week, the top performing Small Cap Index stocks on the move are


|
||||||||||||||||||||||||||||||||||||||||||||||||
| 12Stocks.com: Investing in Smallcap Index using Exchange Traded Funds | |
|
The following table shows list of key exchange traded funds (ETF) that
help investors track Smallcap index. The following list also includes leveraged ETF funds that track twice or thrice the daily returns of Smallcap indices. Short or inverse ETF funds move in the opposite direction to the index they track and are useful during market pullbacks or during bear markets. Quick View: Move mouse or cursor over ETF symbol (ticker) to view short-term technical chart and over ETF name to view long term chart. Click on ticker or stock name for detailed view. Click on to add stock symbol to your watchlist and to view watchlist. |
12Stocks.com List of ETFs that track Smallcap Index
| Ticker | ETF Name | Watchlist | Recent Price | Smart Investing & Trading Score | Change % | Week % | Year-to-date % |
| IWM | iShares Russell 2000 | | 201.90 | 69 | 0.99 | 1.77 | 0.59% |
| IJR | iShares Core S&P Small-Cap | | 107.13 | 82 | 0.75 | 1.4 | -1.03% |
| VTWO | Vanguard Russell 2000 ETF | | 81.61 | 69 | 0.94 | 1.73 | 0.63% |
| IWN | iShares Russell 2000 Value | | 154.21 | 100 | 0.87 | 2.03 | -0.72% |
| IJS | iShares S&P Small-Cap 600 Value | | 98.72 | 64 | 0.71 | 1.57 | -4.22% |
| IWO | iShares Russell 2000 Growth | | 256.87 | 57 | 0.99 | 1.49 | 1.84% |
| IJT | iShares S&P Small-Cap 600 Growth | | 127.76 | 95 | 0.82 | 1.32 | 2.09% |
| XSLV | PowerShares S&P SmallCap Low Volatil ETF | | 43.22 | 87 | 0.19 | 1.17 | -2.11% |
| SBB | ProShares Short SmallCap600 | | 16.16 | 13 | -1.28 | -1.37 | 1.44% |
| SDD | ProShares UltraShort SmallCap600 | | 18.84 | 23 | -2.41 | -2.61 | 2.27% |
| SAA | ProShares Ultra SmallCap600 | | 23.59 | 69 | 2.86 | 2.39 | -5.45% |
| SMLV | SPDR SSGA US Small Cap Low Volatil ETF | | 109.69 | 87 | 0.78 | 2.01 | -2.52% |
| 12Stocks.com: Charts, Trends, Fundamental Data and Performances of SmallCap Stocks | |
|
We now take in-depth look at all SmallCap stocks including charts, multi-period performances and overall trends (as measured by Smart Investing & Trading Score). One can sort SmallCap stocks (click link to choose) by Daily, Weekly and by Year-to-Date performances. Also, one can sort by size of the company or by market capitalization. |
| Select Your Default Chart Type: | |||||
| |||||
| Click on stock symbol or name for detailed view. Click on to add stock symbol to your watchlist and to view watchlist. Quick View: Move mouse or cursor over "Daily" to quickly view daily technical stock chart and over "Weekly" to view weekly technical stock chart. | |||||

 | METCB Ramaco Resources, Inc. |
| Sector: Materials | |
| SubSector: Coking Coal | |
| MarketCap: 469 Millions | |
| Recent Price: 11.09 Smart Investing & Trading Score: 8 | |
| Day Percent Change: -3.98% Day Change: -0.46 | |
| Week Change: -3.82% Year-to-date Change: -16.3% | |
| METCB Links: Profile News Message Board | |
| Charts:- Daily , Weekly | |
| Add METCB to Watchlist: View: Get Complete METCB Trend Analysis ➞ | |
 | MQ Marqeta, Inc. |
| Sector: Technology | |
| SubSector: Software - Infrastructure | |
| MarketCap: 2650 Millions | |
| Recent Price: 5.38 Smart Investing & Trading Score: 17 | |
| Day Percent Change: -4.02% Day Change: -0.22 | |
| Week Change: -0.74% Year-to-date Change: -23.6% | |
| MQ Links: Profile News Message Board | |
| Charts:- Daily , Weekly | |
| Add MQ to Watchlist: View: Get Complete MQ Trend Analysis ➞ | |
 | TWI Titan International, Inc. |
| Sector: Industrials | |
| SubSector: Farm & Construction Machinery | |
| MarketCap: 104.607 Millions | |
| Recent Price: 10.02 Smart Investing & Trading Score: 0 | |
| Day Percent Change: -4.11% Day Change: -0.43 | |
| Week Change: -13.25% Year-to-date Change: -32.7% | |
| TWI Links: Profile News Message Board | |
| Charts:- Daily , Weekly | |
| Add TWI to Watchlist: View: Get Complete TWI Trend Analysis ➞ | |
 | UMH UMH Properties, Inc. |
| Sector: Financials | |
| SubSector: REIT - Diversified | |
| MarketCap: 433.353 Millions | |
| Recent Price: 15.36 Smart Investing & Trading Score: 31 | |
| Day Percent Change: -4.30% Day Change: -0.69 | |
| Week Change: -1.92% Year-to-date Change: 0.3% | |
| UMH Links: Profile News Message Board | |
| Charts:- Daily , Weekly | |
| Add UMH to Watchlist: View: Get Complete UMH Trend Analysis ➞ | |
 | FRSH Freshworks Inc. |
| Sector: Technology | |
| SubSector: Software - Application | |
| MarketCap: 5000 Millions | |
| Recent Price: 14.03 Smart Investing & Trading Score: 48 | |
| Day Percent Change: -4.36% Day Change: -0.64 | |
| Week Change: -23.92% Year-to-date Change: -40.3% | |
| FRSH Links: Profile News Message Board | |
| Charts:- Daily , Weekly | |
| Add FRSH to Watchlist: View: Get Complete FRSH Trend Analysis ➞ | |
 | AGYS Agilysys, Inc. |
| Sector: Technology | |
| SubSector: Application Software | |
| MarketCap: 391.862 Millions | |
| Recent Price: 79.21 Smart Investing & Trading Score: 26 | |
| Day Percent Change: -4.49% Day Change: -3.72 | |
| Week Change: -4.57% Year-to-date Change: -6.6% | |
| AGYS Links: Profile News Message Board | |
| Charts:- Daily , Weekly | |
| Add AGYS to Watchlist: View: Get Complete AGYS Trend Analysis ➞ | |
 | ZYXI Zynex, Inc. |
| Sector: Health Care | |
| SubSector: Medical Appliances & Equipment | |
| MarketCap: 388.58 Millions | |
| Recent Price: 11.00 Smart Investing & Trading Score: 15 | |
| Day Percent Change: -4.68% Day Change: -0.54 | |
| Week Change: -1.87% Year-to-date Change: 1.0% | |
| ZYXI Links: Profile News Message Board | |
| Charts:- Daily , Weekly | |
| Add ZYXI to Watchlist: View: Get Complete ZYXI Trend Analysis ➞ | |
 | SHCR Sharecare, Inc. |
| Sector: Health Care | |
| SubSector: Health Information Services | |
| MarketCap: 640 Millions | |
| Recent Price: 0.71 Smart Investing & Trading Score: 18 | |
| Day Percent Change: -4.69% Day Change: -0.04 | |
| Week Change: -11.72% Year-to-date Change: -34.1% | |
| SHCR Links: Profile News Message Board | |
| Charts:- Daily , Weekly | |
| Add SHCR to Watchlist: View: Get Complete SHCR Trend Analysis ➞ | |
 | SOUN SoundHound AI, Inc. |
| Sector: Technology | |
| SubSector: Software - Application | |
| MarketCap: 1040 Millions | |
| Recent Price: 4.35 Smart Investing & Trading Score: 35 | |
| Day Percent Change: -4.71% Day Change: -0.22 | |
| Week Change: -1.25% Year-to-date Change: 103.3% | |
| SOUN Links: Profile News Message Board | |
| Charts:- Daily , Weekly | |
| Add SOUN to Watchlist: View: Get Complete SOUN Trend Analysis ➞ | |
 | AGS PlayAGS, Inc. |
| Sector: Services & Goods | |
| SubSector: Gaming Activities | |
| MarketCap: 77.1289 Millions | |
| Recent Price: 8.36 Smart Investing & Trading Score: 0 | |
| Day Percent Change: -4.89% Day Change: -0.43 | |
| Week Change: -6.17% Year-to-date Change: -0.8% | |
| AGS Links: Profile News Message Board | |
| Charts:- Daily , Weekly | |
| Add AGS to Watchlist: View: Get Complete AGS Trend Analysis ➞ | |
 | HBI Hanesbrands Inc. |
| Sector: Consumer Staples | |
| SubSector: Textile - Apparel Clothing | |
| MarketCap: 3559.75 Millions | |
| Recent Price: 4.44 Smart Investing & Trading Score: 5 | |
| Day Percent Change: -4.93% Day Change: -0.23 | |
| Week Change: -0.89% Year-to-date Change: -0.5% | |
| HBI Links: Profile News Message Board | |
| Charts:- Daily , Weekly | |
| Add HBI to Watchlist: View: Get Complete HBI Trend Analysis ➞ | |
 | VREX Varex Imaging Corporation |
| Sector: Health Care | |
| SubSector: Medical Appliances & Equipment | |
| MarketCap: 718.78 Millions | |
| Recent Price: 15.59 Smart Investing & Trading Score: 0 | |
| Day Percent Change: -5.11% Day Change: -0.84 | |
| Week Change: -7.15% Year-to-date Change: -24.0% | |
| VREX Links: Profile News Message Board | |
| Charts:- Daily , Weekly | |
| Add VREX to Watchlist: View: Get Complete VREX Trend Analysis ➞ | |
 | PIII P3 Health Partners Inc. |
| Sector: Health Care | |
| SubSector: Medical Care Facilities | |
| MarketCap: 944 Millions | |
| Recent Price: 0.58 Smart Investing & Trading Score: 60 | |
| Day Percent Change: -5.19% Day Change: -0.03 | |
| Week Change: 31.33% Year-to-date Change: -60.6% | |
| PIII Links: Profile News Message Board | |
| Charts:- Daily , Weekly | |
| Add PIII to Watchlist: View: Get Complete PIII Trend Analysis ➞ | |
 | MYRG MYR Group Inc. |
| Sector: Industrials | |
| SubSector: General Contractors | |
| MarketCap: 405.363 Millions | |
| Recent Price: 143.92 Smart Investing & Trading Score: 0 | |
| Day Percent Change: -5.31% Day Change: -8.07 | |
| Week Change: -14.41% Year-to-date Change: -0.5% | |
| MYRG Links: Profile News Message Board | |
| Charts:- Daily , Weekly | |
| Add MYRG to Watchlist: View: Get Complete MYRG Trend Analysis ➞ | |
 | COMM CommScope Holding Company, Inc. |
| Sector: Technology | |
| SubSector: Communication Equipment | |
| MarketCap: 1614.29 Millions | |
| Recent Price: 0.99 Smart Investing & Trading Score: 59 | |
| Day Percent Change: -5.52% Day Change: -0.06 | |
| Week Change: 5.99% Year-to-date Change: -64.8% | |
| COMM Links: Profile News Message Board | |
| Charts:- Daily , Weekly | |
| Add COMM to Watchlist: View: Get Complete COMM Trend Analysis ➞ | |
 | FLR Fluor Corporation |
| Sector: Industrials | |
| SubSector: Heavy Construction | |
| MarketCap: 891.495 Millions | |
| Recent Price: 38.90 Smart Investing & Trading Score: 26 | |
| Day Percent Change: -5.67% Day Change: -2.34 | |
| Week Change: -5.01% Year-to-date Change: -0.7% | |
| FLR Links: Profile News Message Board | |
| Charts:- Daily , Weekly | |
| Add FLR to Watchlist: View: Get Complete FLR Trend Analysis ➞ | |
 | VIAV Viavi Solutions Inc. |
| Sector: Technology | |
| SubSector: Communication Equipment | |
| MarketCap: 2653.29 Millions | |
| Recent Price: 7.56 Smart Investing & Trading Score: 0 | |
| Day Percent Change: -5.74% Day Change: -0.46 | |
| Week Change: -5.62% Year-to-date Change: -24.9% | |
| VIAV Links: Profile News Message Board | |
| Charts:- Daily , Weekly | |
| Add VIAV to Watchlist: View: Get Complete VIAV Trend Analysis ➞ | |
 | ATMU Atmus Filtration Technologies Inc. |
| Sector: Industrials | |
| SubSector: Pollution & Treatment Controls | |
| MarketCap: 1830 Millions | |
| Recent Price: 28.75 Smart Investing & Trading Score: 31 | |
| Day Percent Change: -5.78% Day Change: -1.77 | |
| Week Change: -8.13% Year-to-date Change: 23.0% | |
| ATMU Links: Profile News Message Board | |
| Charts:- Daily , Weekly | |
| Add ATMU to Watchlist: View: Get Complete ATMU Trend Analysis ➞ | |
 | FDP Fresh Del Monte Produce Inc. |
| Sector: Consumer Staples | |
| SubSector: Farm Products | |
| MarketCap: 1862.37 Millions | |
| Recent Price: 24.52 Smart Investing & Trading Score: 26 | |
| Day Percent Change: -5.80% Day Change: -1.51 | |
| Week Change: -4.29% Year-to-date Change: -6.6% | |
| FDP Links: Profile News Message Board | |
| Charts:- Daily , Weekly | |
| Add FDP to Watchlist: View: Get Complete FDP Trend Analysis ➞ | |
 | OUT Outfront Media Inc. |
| Sector: Services & Goods | |
| SubSector: Marketing Services | |
| MarketCap: 1388.15 Millions | |
| Recent Price: 15.09 Smart Investing & Trading Score: 36 | |
| Day Percent Change: -5.92% Day Change: -0.95 | |
| Week Change: -4.07% Year-to-date Change: 8.1% | |
| OUT Links: Profile News Message Board | |
| Charts:- Daily , Weekly | |
| Add OUT to Watchlist: View: Get Complete OUT Trend Analysis ➞ | |
 | SRDX Surmodics, Inc. |
| Sector: Health Care | |
| SubSector: Diagnostic Substances | |
| MarketCap: 388.171 Millions | |
| Recent Price: 32.49 Smart Investing & Trading Score: 93 | |
| Day Percent Change: -5.96% Day Change: -2.06 | |
| Week Change: 24.15% Year-to-date Change: -10.6% | |
| SRDX Links: Profile News Message Board | |
| Charts:- Daily , Weekly | |
| Add SRDX to Watchlist: View: Get Complete SRDX Trend Analysis ➞ | |
 | ATRC AtriCure, Inc. |
| Sector: Health Care | |
| SubSector: Medical Instruments & Supplies | |
| MarketCap: 1158.7 Millions | |
| Recent Price: 20.89 Smart Investing & Trading Score: 0 | |
| Day Percent Change: -5.99% Day Change: -1.33 | |
| Week Change: -9.84% Year-to-date Change: -41.5% | |
| ATRC Links: Profile News Message Board | |
| Charts:- Daily , Weekly | |
| Add ATRC to Watchlist: View: Get Complete ATRC Trend Analysis ➞ | |
 | SSTK Shutterstock, Inc. |
| Sector: Services & Goods | |
| SubSector: Business Services | |
| MarketCap: 1409.62 Millions | |
| Recent Price: 39.24 Smart Investing & Trading Score: 0 | |
| Day Percent Change: -6.01% Day Change: -2.51 | |
| Week Change: -7.37% Year-to-date Change: -18.7% | |
| SSTK Links: Profile News Message Board | |
| Charts:- Daily , Weekly | |
| Add SSTK to Watchlist: View: Get Complete SSTK Trend Analysis ➞ | |
 | OBIO Orchestra BioMed Holdings, Inc. |
| Sector: Health Care | |
| SubSector: Biotechnology | |
| MarketCap: 271 Millions | |
| Recent Price: 4.95 Smart Investing & Trading Score: 67 | |
| Day Percent Change: -6.60% Day Change: -0.35 | |
| Week Change: 12.76% Year-to-date Change: -45.7% | |
| OBIO Links: Profile News Message Board | |
| Charts:- Daily , Weekly | |
| Add OBIO to Watchlist: View: Get Complete OBIO Trend Analysis ➞ | |
 | ALTI AlTi Global, Inc. |
| Sector: Financials | |
| SubSector: Asset Management | |
| MarketCap: 917 Millions | |
| Recent Price: 4.57 Smart Investing & Trading Score: 10 | |
| Day Percent Change: -6.84% Day Change: -0.33 | |
| Week Change: -3.69% Year-to-date Change: -49.7% | |
| ALTI Links: Profile News Message Board | |
| Charts:- Daily , Weekly | |
| Add ALTI to Watchlist: View: Get Complete ALTI Trend Analysis ➞ | |
| Too many stocks? View smallcap stocks filtered by marketcap & sector |
| Marketcap: All SmallCap Stocks (default-no microcap), Large, Mid-Range, Small & MicroCap |
| Sector: Tech, Finance, Energy, Staples, Retail, Industrial, Materials, Utilities & Medical |
|
Best Stocks Today 12Stocks.com |
© 2024 12Stocks.com Terms & Conditions Privacy Contact Us
All Information Provided Only For Education And Not To Be Used For Investing or Trading. See Terms & Conditions


One More Thing ... Get Best Stocks Delivered Daily!
Never Ever Miss A Move With Our Top Ten Stocks Lists
Find Best Stocks In Any Market - Bull or Bear Market
Take A Peek At Our Top Ten Stocks Lists: Daily, Weekly, Year-to-Date & Top Trends
Find Best Stocks In Any Market - Bull or Bear Market
Take A Peek At Our Top Ten Stocks Lists: Daily, Weekly, Year-to-Date & Top Trends
Smallcap Stocks With Best Up Trends [0-bearish to 100-bullish]: Twist Bioscience[100], WideOpenWest [100], Joint [100], FTC Solar[100], Origin Materials[100], Alignment Healthcare[100], Clarus [100], IES [100], Emergent BioSolutions[100], Enovix [100], El Pollo[100]
Best Smallcap Stocks Year-to-Date:
Janux [482.74%], Viking [313.59%], Longboard [272.5%], Alpine Immune[239.29%], Bakkt [199.55%], Avidity Biosciences[192.48%], Vera [189.47%], Cullinan Oncology[176.9%], Super Micro[175.35%], Y-mAbs [151.47%], Sana [149.33%] Best Smallcap Stocks This Week:
Emergent BioSolutions[102.6%], Deciphera [73.24%], Origin Materials[66.52%], Eyenovia [60.78%], Cue Biopharma[56.04%], Aspen Aerogels[55.96%], Enovix [54.02%], Luna Innovations[53.77%], Codexis [47.37%], Carvana Co[44.31%], Office Properties[42.79%] Best Smallcap Stocks Daily:
Luna Innovations[36.00%], Twist Bioscience[28.74%], Ardelyx [28.42%], WideOpenWest [28.23%], 2U [26.63%], Joint [25.35%], FTC Solar[25.09%], Origin Materials[22.23%], Alignment Healthcare[21.97%], Clarus [18.67%], Aurora Innovation[18.09%]