
 Login Sign Up


| |||||
 |  | ||||

| 12Stocks.com Market Intelligence |
Best SmallCap Stocks
|
| In a hurry? Small Cap Stock Lists: Performance Trends Table, Stock Charts
Sort Small Cap stocks: Daily, Weekly, Year-to-Date, Market Cap & Trends. Filter Small Cap stocks list by sector: Show all, Tech, Finance, Energy, Staples, Retail, Industrial, Materials, Utilities and HealthCare Filter Small Cap stocks list by size: All Large Medium Small and MicroCap |
| 12Stocks.com Small Cap Stocks Performances & Trends Daily | |||||||||
|
|  The overall Smart Investing & Trading Score is 14 (0-bearish to 100-bullish) which puts Small Cap index in short term bearish trend. The Smart Investing & Trading Score from previous trading session is 41 and hence a deterioration of trend.
| ||||||||
Here are the Smart Investing & Trading Scores of the most requested small cap stocks at 12Stocks.com (click stock name for detailed review):
|


| 12Stocks.com: Investing in Smallcap Index with Stocks | |
|
The following table helps investors and traders sort through current performance and trends (as measured by Smart Investing & Trading Score) of various
stocks in the Smallcap Index. Quick View: Move mouse or cursor over stock symbol (ticker) to view short-term technical chart and over stock name to view long term chart. Click on  to add stock symbol to your watchlist and to add stock symbol to your watchlist and  to view watchlist. Click on any ticker or stock name for detailed market intelligence report for that stock. to view watchlist. Click on any ticker or stock name for detailed market intelligence report for that stock. |
12Stocks.com Performance of Stocks in Smallcap Index
| Ticker | Stock Name | Watchlist | Category | Recent Price | Smart Investing & Trading Score | Change % | YTD Change% |
| CBT | Cabot |   | Materials | 91.96 | 53 | 0.80 | 10.13% |
| OLP | One Liberty | | Financials | 23.09 | 100 | 0.79 | 5.39% |
| VRNT | Verint Systems | | Technology | 30.52 | 30 | 0.79 | 12.91% |
| TWO | Two Harbors | | Financials | 12.73 | 77 | 0.79 | -8.61% |
| FSBC | Five Star | | Financials | 21.79 | 50 | 0.79 | -16.77% |
| ANIP | ANI | | Health Care | 66.52 | 47 | 0.79 | 20.64% |
| INVA | Innoviva | | Health Care | 15.23 | 53 | 0.79 | -5.05% |
| BTAI | BioXcel | | Health Care | 2.54 | 10 | 0.79 | -13.90% |
| SHEN | Shenandoah Tele | | Technology | 12.92 | 20 | 0.78 | -40.24% |
| THR | Thermon Group | | Industrials | 32.18 | 83 | 0.78 | -1.20% |
| PKE | Park Aerospace | | Technology | 14.38 | 10 | 0.77 | -2.18% |
| BBSI | Barrett Business | | Services & Goods | 122.43 | 46 | 0.77 | 5.73% |
| SLVM | Sylvamo | | Materials | 62.98 | 83 | 0.77 | 28.24% |
| KFY | Korn Ferry | | Services & Goods | 61.18 | 32 | 0.76 | 3.08% |
| OSUR | OraSure | | Health Care | 5.33 | 20 | 0.76 | -35.00% |
| GMS | GMS | | Industrials | 93.22 | 58 | 0.76 | 13.09% |
| INBX | Inhibrx | | Health Care | 34.30 | 42 | 0.76 | -9.76% |
| FARO | FARO | | Technology | 18.89 | 47 | 0.75 | -16.16% |
| CRVL | CorVel | | Financials | 240.63 | 57 | 0.75 | -2.66% |
| WTS | Watts Water | | Industrials | 199.95 | 15 | 0.75 | -4.03% |
| ENS | EnerSys | | Industrials | 91.12 | 49 | 0.74 | -9.75% |
| SENEA | Seneca Foods | | Consumer Staples | 58.52 | 95 | 0.74 | 11.59% |
| ACIW | ACI Worldwide | | Technology | 34.35 | 95 | 0.73 | 12.25% |
| ROIC | Retail Opportunity | | Financials | 12.36 | 49 | 0.73 | -11.90% |
| HLNE | Hamilton Lane | | Financials | 112.54 | 32 | 0.73 | -0.79% |


| Too many stocks? View smallcap stocks filtered by marketcap & sector |
| Marketcap: All SmallCap Stocks (default-no microcap), Large, Mid-Range, Small |
| Smallcap Sector: Tech, Finance, Energy, Staples, Retail, Industrial, Materials, & Medical |
|
Get the most comprehensive stock market coverage daily at 12Stocks.com ➞ Best Stocks Today ➞ Best Stocks Weekly ➞ Best Stocks Year-to-Date ➞ Best Stocks Trends ➞  Best Stocks Today 12Stocks.com Best Nasdaq Stocks ➞ Best S&P 500 Stocks ➞ Best Tech Stocks ➞ Best Biotech Stocks ➞ |
| Detailed Overview of SmallCap Stocks |
| SmallCap Technical Overview, Leaders & Laggards, Top SmallCap ETF Funds & Detailed SmallCap Stocks List, Charts, Trends & More |
| Smallcap: Technical Analysis, Trends & YTD Performance | |
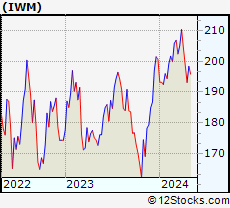
| SmallCap segment as represented by
IWM, an exchange-traded fund [ETF], holds basket of thousands of smallcap stocks from across all major sectors of the US stock market. The smallcap index (contains stocks like Riverbed & Sotheby's) is down by -2.19% and is currently underperforming the overall market by -6.73% year-to-date. Below is a quick view of technical charts and trends: | |
 IWM Weekly Chart |
|
| Long Term Trend: Not Good | |
| Medium Term Trend: Not Good | |
 IWM Daily Chart |
|
| Short Term Trend: Not Good | |
| Overall Trend Score: 14 | |
| YTD Performance: -2.19% | |
| **Trend Scores & Views Are Only For Educational Purposes And Not For Investing | |
| 12Stocks.com: Top Performing Small Cap Index Stocks | ||||||||||||||||||||||||||||||||||||||||||||||||
 The top performing Small Cap Index stocks year to date are
Now, more recently, over last week, the top performing Small Cap Index stocks on the move are


|
||||||||||||||||||||||||||||||||||||||||||||||||
| 12Stocks.com: Investing in Smallcap Index using Exchange Traded Funds | |
|
The following table shows list of key exchange traded funds (ETF) that
help investors track Smallcap index. The following list also includes leveraged ETF funds that track twice or thrice the daily returns of Smallcap indices. Short or inverse ETF funds move in the opposite direction to the index they track and are useful during market pullbacks or during bear markets. Quick View: Move mouse or cursor over ETF symbol (ticker) to view short-term technical chart and over ETF name to view long term chart. Click on ticker or stock name for detailed view. Click on to add stock symbol to your watchlist and to view watchlist. |
12Stocks.com List of ETFs that track Smallcap Index
| Ticker | ETF Name | Watchlist | Recent Price | Smart Investing & Trading Score | Change % | Week % | Year-to-date % |
| IWM | iShares Russell 2000 | | 196.31 | 14 | 0.21 | -1.05 | -2.19% |
| IJR | iShares Core S&P Small-Cap | | 104.74 | 22 | 0.34 | -0.86 | -3.24% |
| VTWO | Vanguard Russell 2000 ETF | | 79.36 | 14 | 0.25 | -1.07 | -2.15% |
| IWN | iShares Russell 2000 Value | | 149.82 | 22 | 0.52 | -0.87 | -3.55% |
| IJS | iShares S&P Small-Cap 600 Value | | 96.40 | 15 | 0.33 | -0.81 | -6.47% |
| IWO | iShares Russell 2000 Growth | | 249.58 | 7 | -0.30 | -1.39 | -1.05% |
| IJT | iShares S&P Small-Cap 600 Growth | | 124.94 | 15 | 0.27 | -0.91 | -0.16% |
| XSLV | PowerShares S&P SmallCap Low Volatil ETF | | 42.83 | 52 | 0.68 | 0.26 | -2.99% |
| SDD | ProShares UltraShort SmallCap600 | | 19.71 | 78 | 0.70 | 1.85 | 6.95% |
| SMLV | SPDR SSGA US Small Cap Low Volatil ETF | | 107.44 | 40 | 1.11 | -0.07 | -4.51% |
| SBB | ProShares Short SmallCap600 | | 16.56 | 71 | 0.05 | 1.06 | 3.94% |
| SAA | ProShares Ultra SmallCap600 | | 22.58 | 8 | -0.08 | -1.99 | -9.49% |
| 12Stocks.com: Charts, Trends, Fundamental Data and Performances of SmallCap Stocks | |
|
We now take in-depth look at all SmallCap stocks including charts, multi-period performances and overall trends (as measured by Smart Investing & Trading Score). One can sort SmallCap stocks (click link to choose) by Daily, Weekly and by Year-to-Date performances. Also, one can sort by size of the company or by market capitalization. |
| Select Your Default Chart Type: | |||||
| |||||
| Click on stock symbol or name for detailed view. Click on to add stock symbol to your watchlist and to view watchlist. Quick View: Move mouse or cursor over "Daily" to quickly view daily technical stock chart and over "Weekly" to view weekly technical stock chart. | |||||

 | CBT Cabot Corporation |
| Sector: Materials | |
| SubSector: Specialty Chemicals | |
| MarketCap: 1261.47 Millions | |
| Recent Price: 91.96 Smart Investing & Trading Score: 53 | |
| Day Percent Change: 0.80% Day Change: 0.73 | |
| Week Change: -1.74% Year-to-date Change: 10.1% | |
| CBT Links: Profile News Message Board | |
| Charts:- Daily , Weekly | |
| Add CBT to Watchlist: View: Get Complete CBT Trend Analysis ➞ | |
 | OLP One Liberty Properties, Inc. |
| Sector: Financials | |
| SubSector: REIT - Diversified | |
| MarketCap: 378.353 Millions | |
| Recent Price: 23.09 Smart Investing & Trading Score: 100 | |
| Day Percent Change: 0.79% Day Change: 0.18 | |
| Week Change: 1.58% Year-to-date Change: 5.4% | |
| OLP Links: Profile News Message Board | |
| Charts:- Daily , Weekly | |
| Add OLP to Watchlist: View: Get Complete OLP Trend Analysis ➞ | |
 | VRNT Verint Systems Inc. |
| Sector: Technology | |
| SubSector: Business Software & Services | |
| MarketCap: 2902.18 Millions | |
| Recent Price: 30.52 Smart Investing & Trading Score: 30 | |
| Day Percent Change: 0.79% Day Change: 0.24 | |
| Week Change: -1.33% Year-to-date Change: 12.9% | |
| VRNT Links: Profile News Message Board | |
| Charts:- Daily , Weekly | |
| Add VRNT to Watchlist: View: Get Complete VRNT Trend Analysis ➞ | |
 | TWO Two Harbors Investment Corp. |
| Sector: Financials | |
| SubSector: Mortgage Investment | |
| MarketCap: 1979.59 Millions | |
| Recent Price: 12.73 Smart Investing & Trading Score: 77 | |
| Day Percent Change: 0.79% Day Change: 0.10 | |
| Week Change: 1.6% Year-to-date Change: -8.6% | |
| TWO Links: Profile News Message Board | |
| Charts:- Daily , Weekly | |
| Add TWO to Watchlist: View: Get Complete TWO Trend Analysis ➞ | |
 | FSBC Five Star Bancorp |
| Sector: Financials | |
| SubSector: Banks - Regional | |
| MarketCap: 377 Millions | |
| Recent Price: 21.79 Smart Investing & Trading Score: 50 | |
| Day Percent Change: 0.79% Day Change: 0.17 | |
| Week Change: 0.18% Year-to-date Change: -16.8% | |
| FSBC Links: Profile News Message Board | |
| Charts:- Daily , Weekly | |
| Add FSBC to Watchlist: View: Get Complete FSBC Trend Analysis ➞ | |
 | ANIP ANI Pharmaceuticals, Inc. |
| Sector: Health Care | |
| SubSector: Biotechnology | |
| MarketCap: 489.285 Millions | |
| Recent Price: 66.52 Smart Investing & Trading Score: 47 | |
| Day Percent Change: 0.79% Day Change: 0.52 | |
| Week Change: 1.77% Year-to-date Change: 20.6% | |
| ANIP Links: Profile News Message Board | |
| Charts:- Daily , Weekly | |
| Add ANIP to Watchlist: View: Get Complete ANIP Trend Analysis ➞ | |
 | INVA Innoviva, Inc. |
| Sector: Health Care | |
| SubSector: Biotechnology | |
| MarketCap: 1023.15 Millions | |
| Recent Price: 15.23 Smart Investing & Trading Score: 53 | |
| Day Percent Change: 0.79% Day Change: 0.12 | |
| Week Change: -0.2% Year-to-date Change: -5.1% | |
| INVA Links: Profile News Message Board | |
| Charts:- Daily , Weekly | |
| Add INVA to Watchlist: View: Get Complete INVA Trend Analysis ➞ | |
 | BTAI BioXcel Therapeutics, Inc. |
| Sector: Health Care | |
| SubSector: Biotechnology | |
| MarketCap: 487.485 Millions | |
| Recent Price: 2.54 Smart Investing & Trading Score: 10 | |
| Day Percent Change: 0.79% Day Change: 0.02 | |
| Week Change: -3.42% Year-to-date Change: -13.9% | |
| BTAI Links: Profile News Message Board | |
| Charts:- Daily , Weekly | |
| Add BTAI to Watchlist: View: Get Complete BTAI Trend Analysis ➞ | |
 | SHEN Shenandoah Telecommunications Company |
| Sector: Technology | |
| SubSector: Telecom Services - Domestic | |
| MarketCap: 2329.67 Millions | |
| Recent Price: 12.92 Smart Investing & Trading Score: 20 | |
| Day Percent Change: 0.78% Day Change: 0.10 | |
| Week Change: -3.51% Year-to-date Change: -40.2% | |
| SHEN Links: Profile News Message Board | |
| Charts:- Daily , Weekly | |
| Add SHEN to Watchlist: View: Get Complete SHEN Trend Analysis ➞ | |
 | THR Thermon Group Holdings, Inc. |
| Sector: Industrials | |
| SubSector: Diversified Machinery | |
| MarketCap: 492.816 Millions | |
| Recent Price: 32.18 Smart Investing & Trading Score: 83 | |
| Day Percent Change: 0.78% Day Change: 0.25 | |
| Week Change: 1.1% Year-to-date Change: -1.2% | |
| THR Links: Profile News Message Board | |
| Charts:- Daily , Weekly | |
| Add THR to Watchlist: View: Get Complete THR Trend Analysis ➞ | |
 | PKE Park Aerospace Corp. |
| Sector: Technology | |
| SubSector: Semiconductor Equipment & Materials | |
| MarketCap: 229.018 Millions | |
| Recent Price: 14.38 Smart Investing & Trading Score: 10 | |
| Day Percent Change: 0.77% Day Change: 0.11 | |
| Week Change: -2.57% Year-to-date Change: -2.2% | |
| PKE Links: Profile News Message Board | |
| Charts:- Daily , Weekly | |
| Add PKE to Watchlist: View: Get Complete PKE Trend Analysis ➞ | |
 | BBSI Barrett Business Services, Inc. |
| Sector: Services & Goods | |
| SubSector: Staffing & Outsourcing Services | |
| MarketCap: 262.028 Millions | |
| Recent Price: 122.43 Smart Investing & Trading Score: 46 | |
| Day Percent Change: 0.77% Day Change: 0.93 | |
| Week Change: 0.54% Year-to-date Change: 5.7% | |
| BBSI Links: Profile News Message Board | |
| Charts:- Daily , Weekly | |
| Add BBSI to Watchlist: View: Get Complete BBSI Trend Analysis ➞ | |
 | SLVM Sylvamo Corporation |
| Sector: Materials | |
| SubSector: Paper & Paper Products | |
| MarketCap: 1710 Millions | |
| Recent Price: 62.98 Smart Investing & Trading Score: 83 | |
| Day Percent Change: 0.77% Day Change: 0.48 | |
| Week Change: -0.13% Year-to-date Change: 28.2% | |
| SLVM Links: Profile News Message Board | |
| Charts:- Daily , Weekly | |
| Add SLVM to Watchlist: View: Get Complete SLVM Trend Analysis ➞ | |
 | KFY Korn Ferry |
| Sector: Services & Goods | |
| SubSector: Staffing & Outsourcing Services | |
| MarketCap: 1534.28 Millions | |
| Recent Price: 61.18 Smart Investing & Trading Score: 32 | |
| Day Percent Change: 0.76% Day Change: 0.46 | |
| Week Change: 0.28% Year-to-date Change: 3.1% | |
| KFY Links: Profile News Message Board | |
| Charts:- Daily , Weekly | |
| Add KFY to Watchlist: View: Get Complete KFY Trend Analysis ➞ | |
 | OSUR OraSure Technologies, Inc. |
| Sector: Health Care | |
| SubSector: Medical Instruments & Supplies | |
| MarketCap: 468.26 Millions | |
| Recent Price: 5.33 Smart Investing & Trading Score: 20 | |
| Day Percent Change: 0.76% Day Change: 0.04 | |
| Week Change: 0.19% Year-to-date Change: -35.0% | |
| OSUR Links: Profile News Message Board | |
| Charts:- Daily , Weekly | |
| Add OSUR to Watchlist: View: Get Complete OSUR Trend Analysis ➞ | |
 | GMS GMS Inc. |
| Sector: Industrials | |
| SubSector: General Building Materials | |
| MarketCap: 587.753 Millions | |
| Recent Price: 93.22 Smart Investing & Trading Score: 58 | |
| Day Percent Change: 0.76% Day Change: 0.70 | |
| Week Change: 0.36% Year-to-date Change: 13.1% | |
| GMS Links: Profile News Message Board | |
| Charts:- Daily , Weekly | |
| Add GMS to Watchlist: View: Get Complete GMS Trend Analysis ➞ | |
 | INBX Inhibrx, Inc. |
| Sector: Health Care | |
| SubSector: Biotechnology | |
| MarketCap: 14187 Millions | |
| Recent Price: 34.30 Smart Investing & Trading Score: 42 | |
| Day Percent Change: 0.76% Day Change: 0.26 | |
| Week Change: 0.7% Year-to-date Change: -9.8% | |
| INBX Links: Profile News Message Board | |
| Charts:- Daily , Weekly | |
| Add INBX to Watchlist: View: Get Complete INBX Trend Analysis ➞ | |
 | FARO FARO Technologies, Inc. |
| Sector: Technology | |
| SubSector: Scientific & Technical Instruments | |
| MarketCap: 721.953 Millions | |
| Recent Price: 18.89 Smart Investing & Trading Score: 47 | |
| Day Percent Change: 0.75% Day Change: 0.14 | |
| Week Change: -0.16% Year-to-date Change: -16.2% | |
| FARO Links: Profile News Message Board | |
| Charts:- Daily , Weekly | |
| Add FARO to Watchlist: View: Get Complete FARO Trend Analysis ➞ | |
 | CRVL CorVel Corporation |
| Sector: Financials | |
| SubSector: Insurance Brokers | |
| MarketCap: 1090.67 Millions | |
| Recent Price: 240.63 Smart Investing & Trading Score: 57 | |
| Day Percent Change: 0.75% Day Change: 1.78 | |
| Week Change: 0.83% Year-to-date Change: -2.7% | |
| CRVL Links: Profile News Message Board | |
| Charts:- Daily , Weekly | |
| Add CRVL to Watchlist: View: Get Complete CRVL Trend Analysis ➞ | |
 | WTS Watts Water Technologies, Inc. |
| Sector: Industrials | |
| SubSector: Industrial Equipment & Components | |
| MarketCap: 2903.29 Millions | |
| Recent Price: 199.95 Smart Investing & Trading Score: 15 | |
| Day Percent Change: 0.75% Day Change: 1.49 | |
| Week Change: -0.77% Year-to-date Change: -4.0% | |
| WTS Links: Profile News Message Board | |
| Charts:- Daily , Weekly | |
| Add WTS to Watchlist: View: Get Complete WTS Trend Analysis ➞ | |
 | ENS EnerSys |
| Sector: Industrials | |
| SubSector: Industrial Electrical Equipment | |
| MarketCap: 2068.79 Millions | |
| Recent Price: 91.12 Smart Investing & Trading Score: 49 | |
| Day Percent Change: 0.74% Day Change: 0.67 | |
| Week Change: -0.18% Year-to-date Change: -9.8% | |
| ENS Links: Profile News Message Board | |
| Charts:- Daily , Weekly | |
| Add ENS to Watchlist: View: Get Complete ENS Trend Analysis ➞ | |
 | SENEA Seneca Foods Corporation |
| Sector: Consumer Staples | |
| SubSector: Processed & Packaged Goods | |
| MarketCap: 326.348 Millions | |
| Recent Price: 58.52 Smart Investing & Trading Score: 95 | |
| Day Percent Change: 0.74% Day Change: 0.43 | |
| Week Change: 1.09% Year-to-date Change: 11.6% | |
| SENEA Links: Profile News Message Board | |
| Charts:- Daily , Weekly | |
| Add SENEA to Watchlist: View: Get Complete SENEA Trend Analysis ➞ | |
 | ACIW ACI Worldwide, Inc. |
| Sector: Technology | |
| SubSector: Technical & System Software | |
| MarketCap: 2645.7 Millions | |
| Recent Price: 34.35 Smart Investing & Trading Score: 95 | |
| Day Percent Change: 0.73% Day Change: 0.25 | |
| Week Change: 3.15% Year-to-date Change: 12.3% | |
| ACIW Links: Profile News Message Board | |
| Charts:- Daily , Weekly | |
| Add ACIW to Watchlist: View: Get Complete ACIW Trend Analysis ➞ | |
 | ROIC Retail Opportunity Investments Corp. |
| Sector: Financials | |
| SubSector: REIT - Retail | |
| MarketCap: 943.414 Millions | |
| Recent Price: 12.36 Smart Investing & Trading Score: 49 | |
| Day Percent Change: 0.73% Day Change: 0.09 | |
| Week Change: 0.9% Year-to-date Change: -11.9% | |
| ROIC Links: Profile News Message Board | |
| Charts:- Daily , Weekly | |
| Add ROIC to Watchlist: View: Get Complete ROIC Trend Analysis ➞ | |
 | HLNE Hamilton Lane Incorporated |
| Sector: Financials | |
| SubSector: Asset Management | |
| MarketCap: 2484.13 Millions | |
| Recent Price: 112.54 Smart Investing & Trading Score: 32 | |
| Day Percent Change: 0.73% Day Change: 0.82 | |
| Week Change: -1.74% Year-to-date Change: -0.8% | |
| HLNE Links: Profile News Message Board | |
| Charts:- Daily , Weekly | |
| Add HLNE to Watchlist: View: Get Complete HLNE Trend Analysis ➞ | |
| Too many stocks? View smallcap stocks filtered by marketcap & sector |
| Marketcap: All SmallCap Stocks (default-no microcap), Large, Mid-Range, Small & MicroCap |
| Sector: Tech, Finance, Energy, Staples, Retail, Industrial, Materials, Utilities & Medical |
|
Best Stocks Today 12Stocks.com |
© 2024 12Stocks.com Terms & Conditions Privacy Contact Us
All Information Provided Only For Education And Not To Be Used For Investing or Trading. See Terms & Conditions


One More Thing ... Get Best Stocks Delivered Daily!
Never Ever Miss A Move With Our Top Ten Stocks Lists
Find Best Stocks In Any Market - Bull or Bear Market
Take A Peek At Our Top Ten Stocks Lists: Daily, Weekly, Year-to-Date & Top Trends
Find Best Stocks In Any Market - Bull or Bear Market
Take A Peek At Our Top Ten Stocks Lists: Daily, Weekly, Year-to-Date & Top Trends
Smallcap Stocks With Best Up Trends [0-bearish to 100-bullish]: Surmodics [100], Rocky Brands[100], TransMedics Group[100], LendingClub [100], Summit [100], A10 s[100], Carpenter [100], UFP [100], PROCEPT BioRobotics[100], Xencor [100], Trinity Industries[100]
Best Smallcap Stocks Year-to-Date:
Janux [441.55%], Viking [310.69%], Longboard [259.25%], Alpine Immune[239.29%], Avidity Biosciences[185.4%], Bakkt [182.96%], Cullinan Oncology[175.33%], Arcutis Bio[173.68%], Vera [173.32%], Super Micro[159.73%], Y-mAbs [141.79%] Best Smallcap Stocks This Week:
Deciphera [73.11%], Eyenovia [45.65%], Cue Biopharma[39.56%], Seres [30.91%], Poseida [30.05%], P3 Health[29.62%], Phibro Animal[28.44%], TransMedics Group[27.72%], Surmodics [27.36%], LendingTree [26.36%], Rocky Brands[24.92%] Best Smallcap Stocks Daily:
Surmodics [29.74%], Rocky Brands[28.41%], TransMedics Group[24.93%], Ventyx Biosciences[24.63%], Eyenovia [21.84%], LendingClub [19.68%], Summit [19.59%], Powell Industries[18.89%], MiMedx Group[18.67%], CareDx [18.30%], A10 s[17.69%]