
 Login Sign Up


| |||||
 |  | ||||

| 12Stocks.com Market Intelligence |
Best SmallCap Stocks
|
| In a hurry? Small Cap Stock Lists: Performance Trends Table, Stock Charts
Sort Small Cap stocks: Daily, Weekly, Year-to-Date, Market Cap & Trends. Filter Small Cap stocks list by sector: Show all, Tech, Finance, Energy, Staples, Retail, Industrial, Materials, Utilities and HealthCare Filter Small Cap stocks list by size: All Large Medium Small and MicroCap |
| 12Stocks.com Small Cap Stocks Performances & Trends Daily | |||||||||
|
|  The overall Smart Investing & Trading Score is 56 (0-bearish to 100-bullish) which puts Small Cap index in short term neutral trend. The Smart Investing & Trading Score from previous trading session is 44 and hence an improvement of trend.
| ||||||||
Here are the Smart Investing & Trading Scores of the most requested small cap stocks at 12Stocks.com (click stock name for detailed review):
|


| 12Stocks.com: Investing in Smallcap Index with Stocks | |
|
The following table helps investors and traders sort through current performance and trends (as measured by Smart Investing & Trading Score) of various
stocks in the Smallcap Index. Quick View: Move mouse or cursor over stock symbol (ticker) to view short-term technical chart and over stock name to view long term chart. Click on  to add stock symbol to your watchlist and to add stock symbol to your watchlist and  to view watchlist. Click on any ticker or stock name for detailed market intelligence report for that stock. to view watchlist. Click on any ticker or stock name for detailed market intelligence report for that stock. |
12Stocks.com Performance of Stocks in Smallcap Index
| Ticker | Stock Name | Watchlist | Category | Recent Price | Smart Investing & Trading Score | Change % | YTD Change% |
| NODK | NI |   | Financials | 14.97 | 83 | -0.99 | 15.24% |
| BRKL | Brookline Bancorp | | Financials | 8.34 | 45 | -1.01 | -23.60% |
| MC | Moelis & | | Financials | 49.75 | 0 | -1.01 | -11.37% |
| CHMG | Chemung Financial | | Financials | 43.06 | 55 | -1.01 | -13.53% |
| YMAB | Y-mAbs | | Health Care | 14.71 | 58 | -1.01 | 115.69% |
| MNRO | Monro | | Consumer Staples | 27.79 | 35 | -1.03 | -5.28% |
| COKE | Coca-Cola Consolidated | | Consumer Staples | 822.44 | 57 | -1.03 | -11.41% |
| SITC | SITE Centers | | Financials | 13.48 | 46 | -1.03 | -1.10% |
| POR | Portland General | | Utilities | 42.80 | 93 | -1.04 | -1.25% |
| KELYA | Kelly Services | | Services & Goods | 23.46 | 63 | -1.05 | 8.51% |
| ORA | Ormat | | Utilities | 63.11 | 80 | -1.05 | -16.73% |
| CHCO | City Holding | | Financials | 104.11 | 93 | -1.05 | -5.58% |
| MWA | Mueller Water | | Industrials | 15.98 | 93 | -1.05 | 10.97% |
| MRNS | Marinus | | Health Care | 1.41 | 39 | -1.06 | -87.07% |
| HRI | Herc | | Transports | 152.27 | 58 | -1.07 | 2.27% |
| OFLX | Omega Flex | | Industrials | 66.85 | 42 | -1.09 | -5.19% |
| BBSI | Barrett Business | | Services & Goods | 121.77 | 71 | -1.09 | 5.16% |
| UTL | Unitil | | Utilities | 49.94 | 78 | -1.09 | -5.00% |
| BEAM | Beam | | Health Care | 21.38 | 10 | -1.09 | -21.45% |
| SBCF | Seacoast Banking | | Financials | 23.38 | 52 | -1.10 | -17.85% |
| DIN | Dine Brands | | Services & Goods | 45.17 | 74 | -1.12 | -9.02% |
| VSEC | VSE | | Services & Goods | 76.01 | 69 | -1.13 | 17.64% |
| VBTX | Veritex | | Financials | 20.17 | 69 | -1.13 | -13.32% |
| TCBK | TriCo Bancshares | | Financials | 33.85 | 60 | -1.14 | -21.22% |
| NL | NL Industries | | Services & Goods | 7.81 | 53 | -1.14 | 39.22% |


| Too many stocks? View smallcap stocks filtered by marketcap & sector |
| Marketcap: All SmallCap Stocks (default-no microcap), Large, Mid-Range, Small |
| Smallcap Sector: Tech, Finance, Energy, Staples, Retail, Industrial, Materials, & Medical |
|
Get the most comprehensive stock market coverage daily at 12Stocks.com ➞ Best Stocks Today ➞ Best Stocks Weekly ➞ Best Stocks Year-to-Date ➞ Best Stocks Trends ➞  Best Stocks Today 12Stocks.com Best Nasdaq Stocks ➞ Best S&P 500 Stocks ➞ Best Tech Stocks ➞ Best Biotech Stocks ➞ |
| Detailed Overview of SmallCap Stocks |
| SmallCap Technical Overview, Leaders & Laggards, Top SmallCap ETF Funds & Detailed SmallCap Stocks List, Charts, Trends & More |
| Smallcap: Technical Analysis, Trends & YTD Performance | |
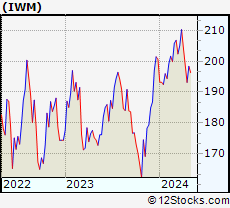
| SmallCap segment as represented by
IWM, an exchange-traded fund [ETF], holds basket of thousands of smallcap stocks from across all major sectors of the US stock market. The smallcap index (contains stocks like Riverbed & Sotheby's) is down by -1.16% and is currently underperforming the overall market by -7.3% year-to-date. Below is a quick view of technical charts and trends: | |
 IWM Weekly Chart |
|
| Long Term Trend: Good | |
| Medium Term Trend: Not Good | |
 IWM Daily Chart |
|
| Short Term Trend: Very Good | |
| Overall Trend Score: 56 | |
| YTD Performance: -1.16% | |
| **Trend Scores & Views Are Only For Educational Purposes And Not For Investing | |
| 12Stocks.com: Top Performing Small Cap Index Stocks | ||||||||||||||||||||||||||||||||||||||||||||||||
 The top performing Small Cap Index stocks year to date are
Now, more recently, over last week, the top performing Small Cap Index stocks on the move are


|
||||||||||||||||||||||||||||||||||||||||||||||||
| 12Stocks.com: Investing in Smallcap Index using Exchange Traded Funds | |
|
The following table shows list of key exchange traded funds (ETF) that
help investors track Smallcap index. The following list also includes leveraged ETF funds that track twice or thrice the daily returns of Smallcap indices. Short or inverse ETF funds move in the opposite direction to the index they track and are useful during market pullbacks or during bear markets. Quick View: Move mouse or cursor over ETF symbol (ticker) to view short-term technical chart and over ETF name to view long term chart. Click on ticker or stock name for detailed view. Click on to add stock symbol to your watchlist and to view watchlist. |
12Stocks.com List of ETFs that track Smallcap Index
| Ticker | ETF Name | Watchlist | Recent Price | Smart Investing & Trading Score | Change % | Week % | Year-to-date % |
| IWM | iShares Russell 2000 | | 198.39 | 56 | 0.97 | 2.72 | -1.16% |
| IJR | iShares Core S&P Small-Cap | | 105.65 | 85 | 0.75 | 2.35 | -2.4% |
| VTWO | Vanguard Russell 2000 ETF | | 80.22 | 70 | 0.97 | 2.74 | -1.09% |
| IWN | iShares Russell 2000 Value | | 151.14 | 75 | 0.64 | 2.27 | -2.7% |
| IWO | iShares Russell 2000 Growth | | 253.09 | 58 | 1.29 | 3.18 | 0.34% |
| IJS | iShares S&P Small-Cap 600 Value | | 97.19 | 67 | 0.52 | 1.65 | -5.7% |
| IJT | iShares S&P Small-Cap 600 Growth | | 126.09 | 70 | 0.82 | 3.17 | 0.76% |
| XSLV | PowerShares S&P SmallCap Low Volatil ETF | | 42.72 | 80 | 0.42 | 1.28 | -3.24% |
| SAA | ProShares Ultra SmallCap600 | | 23.04 | 65 | 1.68 | 5.69 | -7.66% |
| SBB | ProShares Short SmallCap600 | | 16.39 | 33 | -0.70 | -2.7 | 2.86% |
| SDD | ProShares UltraShort SmallCap600 | | 19.35 | 35 | -1.17 | -4.87 | 5.01% |
| SMLV | SPDR SSGA US Small Cap Low Volatil ETF | | 107.52 | 80 | 0.18 | 1.35 | -4.44% |
| 12Stocks.com: Charts, Trends, Fundamental Data and Performances of SmallCap Stocks | |
|
We now take in-depth look at all SmallCap stocks including charts, multi-period performances and overall trends (as measured by Smart Investing & Trading Score). One can sort SmallCap stocks (click link to choose) by Daily, Weekly and by Year-to-Date performances. Also, one can sort by size of the company or by market capitalization. |
| Select Your Default Chart Type: | |||||
| |||||
| Click on stock symbol or name for detailed view. Click on to add stock symbol to your watchlist and to view watchlist. Quick View: Move mouse or cursor over "Daily" to quickly view daily technical stock chart and over "Weekly" to view weekly technical stock chart. | |||||

 | NODK NI Holdings, Inc. |
| Sector: Financials | |
| SubSector: Property & Casualty Insurance | |
| MarketCap: 238.112 Millions | |
| Recent Price: 14.97 Smart Investing & Trading Score: 83 | |
| Day Percent Change: -0.99% Day Change: -0.15 | |
| Week Change: -0.73% Year-to-date Change: 15.2% | |
| NODK Links: Profile News Message Board | |
| Charts:- Daily , Weekly | |
| Add NODK to Watchlist: View: Get Complete NODK Trend Analysis ➞ | |
 | BRKL Brookline Bancorp, Inc. |
| Sector: Financials | |
| SubSector: Savings & Loans | |
| MarketCap: 894.43 Millions | |
| Recent Price: 8.34 Smart Investing & Trading Score: 45 | |
| Day Percent Change: -1.01% Day Change: -0.08 | |
| Week Change: -11.14% Year-to-date Change: -23.6% | |
| BRKL Links: Profile News Message Board | |
| Charts:- Daily , Weekly | |
| Add BRKL to Watchlist: View: Get Complete BRKL Trend Analysis ➞ | |
 | MC Moelis & Company |
| Sector: Financials | |
| SubSector: Asset Management | |
| MarketCap: 1675.93 Millions | |
| Recent Price: 49.75 Smart Investing & Trading Score: 0 | |
| Day Percent Change: -1.01% Day Change: -0.51 | |
| Week Change: -3.68% Year-to-date Change: -11.4% | |
| MC Links: Profile News Message Board | |
| Charts:- Daily , Weekly | |
| Add MC to Watchlist: View: Get Complete MC Trend Analysis ➞ | |
 | CHMG Chemung Financial Corporation |
| Sector: Financials | |
| SubSector: Regional - Pacific Banks | |
| MarketCap: 142.229 Millions | |
| Recent Price: 43.06 Smart Investing & Trading Score: 55 | |
| Day Percent Change: -1.01% Day Change: -0.44 | |
| Week Change: -1.01% Year-to-date Change: -13.5% | |
| CHMG Links: Profile News Message Board | |
| Charts:- Daily , Weekly | |
| Add CHMG to Watchlist: View: Get Complete CHMG Trend Analysis ➞ | |
 | YMAB Y-mAbs Therapeutics, Inc. |
| Sector: Health Care | |
| SubSector: Biotechnology | |
| MarketCap: 899.585 Millions | |
| Recent Price: 14.71 Smart Investing & Trading Score: 58 | |
| Day Percent Change: -1.01% Day Change: -0.15 | |
| Week Change: -2.9% Year-to-date Change: 115.7% | |
| YMAB Links: Profile News Message Board | |
| Charts:- Daily , Weekly | |
| Add YMAB to Watchlist: View: Get Complete YMAB Trend Analysis ➞ | |
 | MNRO Monro, Inc. |
| Sector: Consumer Staples | |
| SubSector: Auto Parts | |
| MarketCap: 1514.89 Millions | |
| Recent Price: 27.79 Smart Investing & Trading Score: 35 | |
| Day Percent Change: -1.03% Day Change: -0.29 | |
| Week Change: -6.05% Year-to-date Change: -5.3% | |
| MNRO Links: Profile News Message Board | |
| Charts:- Daily , Weekly | |
| Add MNRO to Watchlist: View: Get Complete MNRO Trend Analysis ➞ | |
 | COKE Coca-Cola Consolidated, Inc. |
| Sector: Consumer Staples | |
| SubSector: Beverages - Soft Drinks | |
| MarketCap: 1392.2 Millions | |
| Recent Price: 822.44 Smart Investing & Trading Score: 57 | |
| Day Percent Change: -1.03% Day Change: -8.54 | |
| Week Change: 0.64% Year-to-date Change: -11.4% | |
| COKE Links: Profile News Message Board | |
| Charts:- Daily , Weekly | |
| Add COKE to Watchlist: View: Get Complete COKE Trend Analysis ➞ | |
 | SITC SITE Centers Corp. |
| Sector: Financials | |
| SubSector: REIT - Retail | |
| MarketCap: 1449.54 Millions | |
| Recent Price: 13.48 Smart Investing & Trading Score: 46 | |
| Day Percent Change: -1.03% Day Change: -0.14 | |
| Week Change: -1.25% Year-to-date Change: -1.1% | |
| SITC Links: Profile News Message Board | |
| Charts:- Daily , Weekly | |
| Add SITC to Watchlist: View: Get Complete SITC Trend Analysis ➞ | |
 | POR Portland General Electric Company |
| Sector: Utilities | |
| SubSector: Electric Utilities | |
| MarketCap: 4291.84 Millions | |
| Recent Price: 42.80 Smart Investing & Trading Score: 93 | |
| Day Percent Change: -1.04% Day Change: -0.45 | |
| Week Change: 0% Year-to-date Change: -1.3% | |
| POR Links: Profile News Message Board | |
| Charts:- Daily , Weekly | |
| Add POR to Watchlist: View: Get Complete POR Trend Analysis ➞ | |
 | KELYA Kelly Services, Inc. |
| Sector: Services & Goods | |
| SubSector: Staffing & Outsourcing Services | |
| MarketCap: 587.228 Millions | |
| Recent Price: 23.46 Smart Investing & Trading Score: 63 | |
| Day Percent Change: -1.05% Day Change: -0.25 | |
| Week Change: -1.05% Year-to-date Change: 8.5% | |
| KELYA Links: Profile News Message Board | |
| Charts:- Daily , Weekly | |
| Add KELYA to Watchlist: View: Get Complete KELYA Trend Analysis ➞ | |
 | ORA Ormat Technologies, Inc. |
| Sector: Utilities | |
| SubSector: Electric Utilities | |
| MarketCap: 3610.74 Millions | |
| Recent Price: 63.11 Smart Investing & Trading Score: 80 | |
| Day Percent Change: -1.05% Day Change: -0.67 | |
| Week Change: -1% Year-to-date Change: -16.7% | |
| ORA Links: Profile News Message Board | |
| Charts:- Daily , Weekly | |
| Add ORA to Watchlist: View: Get Complete ORA Trend Analysis ➞ | |
 | CHCO City Holding Company |
| Sector: Financials | |
| SubSector: Regional - Mid-Atlantic Banks | |
| MarketCap: 1059.59 Millions | |
| Recent Price: 104.11 Smart Investing & Trading Score: 93 | |
| Day Percent Change: -1.05% Day Change: -1.10 | |
| Week Change: 1.07% Year-to-date Change: -5.6% | |
| CHCO Links: Profile News Message Board | |
| Charts:- Daily , Weekly | |
| Add CHCO to Watchlist: View: Get Complete CHCO Trend Analysis ➞ | |
 | MWA Mueller Water Products, Inc. |
| Sector: Industrials | |
| SubSector: Industrial Equipment & Components | |
| MarketCap: 1321.09 Millions | |
| Recent Price: 15.98 Smart Investing & Trading Score: 93 | |
| Day Percent Change: -1.05% Day Change: -0.17 | |
| Week Change: 0.06% Year-to-date Change: 11.0% | |
| MWA Links: Profile News Message Board | |
| Charts:- Daily , Weekly | |
| Add MWA to Watchlist: View: Get Complete MWA Trend Analysis ➞ | |
 | MRNS Marinus Pharmaceuticals, Inc. |
| Sector: Health Care | |
| SubSector: Biotechnology | |
| MarketCap: 222.885 Millions | |
| Recent Price: 1.41 Smart Investing & Trading Score: 39 | |
| Day Percent Change: -1.06% Day Change: -0.01 | |
| Week Change: 1.81% Year-to-date Change: -87.1% | |
| MRNS Links: Profile News Message Board | |
| Charts:- Daily , Weekly | |
| Add MRNS to Watchlist: View: Get Complete MRNS Trend Analysis ➞ | |
 | HRI Herc Holdings Inc. |
| Sector: Transports | |
| SubSector: Rental & Leasing Services | |
| MarketCap: 469.344 Millions | |
| Recent Price: 152.27 Smart Investing & Trading Score: 58 | |
| Day Percent Change: -1.07% Day Change: -1.65 | |
| Week Change: 1.45% Year-to-date Change: 2.3% | |
| HRI Links: Profile News Message Board | |
| Charts:- Daily , Weekly | |
| Add HRI to Watchlist: View: Get Complete HRI Trend Analysis ➞ | |
 | OFLX Omega Flex, Inc. |
| Sector: Industrials | |
| SubSector: Industrial Equipment & Components | |
| MarketCap: 590.609 Millions | |
| Recent Price: 66.85 Smart Investing & Trading Score: 42 | |
| Day Percent Change: -1.09% Day Change: -0.74 | |
| Week Change: -0.22% Year-to-date Change: -5.2% | |
| OFLX Links: Profile News Message Board | |
| Charts:- Daily , Weekly | |
| Add OFLX to Watchlist: View: Get Complete OFLX Trend Analysis ➞ | |
 | BBSI Barrett Business Services, Inc. |
| Sector: Services & Goods | |
| SubSector: Staffing & Outsourcing Services | |
| MarketCap: 262.028 Millions | |
| Recent Price: 121.77 Smart Investing & Trading Score: 71 | |
| Day Percent Change: -1.09% Day Change: -1.34 | |
| Week Change: -0.47% Year-to-date Change: 5.2% | |
| BBSI Links: Profile News Message Board | |
| Charts:- Daily , Weekly | |
| Add BBSI to Watchlist: View: Get Complete BBSI Trend Analysis ➞ | |
 | UTL Unitil Corporation |
| Sector: Utilities | |
| SubSector: Diversified Utilities | |
| MarketCap: 756.98 Millions | |
| Recent Price: 49.94 Smart Investing & Trading Score: 78 | |
| Day Percent Change: -1.09% Day Change: -0.55 | |
| Week Change: -0.5% Year-to-date Change: -5.0% | |
| UTL Links: Profile News Message Board | |
| Charts:- Daily , Weekly | |
| Add UTL to Watchlist: View: Get Complete UTL Trend Analysis ➞ | |
 | BEAM Beam Therapeutics Inc. |
| Sector: Health Care | |
| SubSector: Biotechnology | |
| MarketCap: 44987 Millions | |
| Recent Price: 21.38 Smart Investing & Trading Score: 10 | |
| Day Percent Change: -1.09% Day Change: -0.23 | |
| Week Change: -10.54% Year-to-date Change: -21.5% | |
| BEAM Links: Profile News Message Board | |
| Charts:- Daily , Weekly | |
| Add BEAM to Watchlist: View: Get Complete BEAM Trend Analysis ➞ | |
 | SBCF Seacoast Banking Corporation of Florida |
| Sector: Financials | |
| SubSector: Regional - Mid-Atlantic Banks | |
| MarketCap: 881.559 Millions | |
| Recent Price: 23.38 Smart Investing & Trading Score: 52 | |
| Day Percent Change: -1.10% Day Change: -0.26 | |
| Week Change: 2.59% Year-to-date Change: -17.9% | |
| SBCF Links: Profile News Message Board | |
| Charts:- Daily , Weekly | |
| Add SBCF to Watchlist: View: Get Complete SBCF Trend Analysis ➞ | |
 | DIN Dine Brands Global, Inc. |
| Sector: Services & Goods | |
| SubSector: Restaurants | |
| MarketCap: 421.17 Millions | |
| Recent Price: 45.17 Smart Investing & Trading Score: 74 | |
| Day Percent Change: -1.12% Day Change: -0.51 | |
| Week Change: 4.2% Year-to-date Change: -9.0% | |
| DIN Links: Profile News Message Board | |
| Charts:- Daily , Weekly | |
| Add DIN to Watchlist: View: Get Complete DIN Trend Analysis ➞ | |
 | VSEC VSE Corporation |
| Sector: Services & Goods | |
| SubSector: Technical Services | |
| MarketCap: 183.61 Millions | |
| Recent Price: 76.01 Smart Investing & Trading Score: 69 | |
| Day Percent Change: -1.13% Day Change: -0.87 | |
| Week Change: 0.44% Year-to-date Change: 17.6% | |
| VSEC Links: Profile News Message Board | |
| Charts:- Daily , Weekly | |
| Add VSEC to Watchlist: View: Get Complete VSEC Trend Analysis ➞ | |
 | VBTX Veritex Holdings, Inc. |
| Sector: Financials | |
| SubSector: Regional - Southwest Banks | |
| MarketCap: 625.165 Millions | |
| Recent Price: 20.17 Smart Investing & Trading Score: 69 | |
| Day Percent Change: -1.13% Day Change: -0.23 | |
| Week Change: 0.75% Year-to-date Change: -13.3% | |
| VBTX Links: Profile News Message Board | |
| Charts:- Daily , Weekly | |
| Add VBTX to Watchlist: View: Get Complete VBTX Trend Analysis ➞ | |
 | TCBK TriCo Bancshares |
| Sector: Financials | |
| SubSector: Regional - Pacific Banks | |
| MarketCap: 875.129 Millions | |
| Recent Price: 33.85 Smart Investing & Trading Score: 60 | |
| Day Percent Change: -1.14% Day Change: -0.39 | |
| Week Change: 0.8% Year-to-date Change: -21.2% | |
| TCBK Links: Profile News Message Board | |
| Charts:- Daily , Weekly | |
| Add TCBK to Watchlist: View: Get Complete TCBK Trend Analysis ➞ | |
 | NL NL Industries, Inc. |
| Sector: Services & Goods | |
| SubSector: Industrial Equipment Wholesale | |
| MarketCap: 126.258 Millions | |
| Recent Price: 7.81 Smart Investing & Trading Score: 53 | |
| Day Percent Change: -1.14% Day Change: -0.09 | |
| Week Change: 0% Year-to-date Change: 39.2% | |
| NL Links: Profile News Message Board | |
| Charts:- Daily , Weekly | |
| Add NL to Watchlist: View: Get Complete NL Trend Analysis ➞ | |
| Too many stocks? View smallcap stocks filtered by marketcap & sector |
| Marketcap: All SmallCap Stocks (default-no microcap), Large, Mid-Range, Small & MicroCap |
| Sector: Tech, Finance, Energy, Staples, Retail, Industrial, Materials, Utilities & Medical |
|
Best Stocks Today 12Stocks.com |
© 2024 12Stocks.com Terms & Conditions Privacy Contact Us
All Information Provided Only For Education And Not To Be Used For Investing or Trading. See Terms & Conditions


One More Thing ... Get Best Stocks Delivered Daily!
Never Ever Miss A Move With Our Top Ten Stocks Lists
Find Best Stocks In Any Market - Bull or Bear Market
Take A Peek At Our Top Ten Stocks Lists: Daily, Weekly, Year-to-Date & Top Trends
Find Best Stocks In Any Market - Bull or Bear Market
Take A Peek At Our Top Ten Stocks Lists: Daily, Weekly, Year-to-Date & Top Trends
Smallcap Stocks With Best Up Trends [0-bearish to 100-bullish]: Cullinan Oncology[100], NextNav [100], MBIA [100], Reservoir Media[100], B. Riley[100], Braemar Hotels[100], Pactiv Evergreen[100], Wolverine World[100], Haemonetics [100], Benchmark Electronics[100], Uniti Group[100]
Best Smallcap Stocks Year-to-Date:
CareMax [568.04%], Janux [341.65%], Viking [299.3%], Alpine Immune[239.21%], Longboard [222.09%], Super Micro[201.64%], Avidity Biosciences[166.81%], Arcutis Bio[162.23%], Vera [156.27%], Cullinan Oncology[147.08%], Hippo [141.6%] Best Smallcap Stocks This Week:
Matterport [170.98%], B. Riley[84.19%], Cullinan Oncology[60.86%], Seres [47.35%], Zura Bio[38.67%], Universal Logistics[36.84%], Tutor Perini[33.89%], Riot Blockchain[30.67%], IGM Biosciences[30.56%], Impinj [29.74%], Sonic Automotive[28.14%] Best Smallcap Stocks Daily:
Universal Logistics[39.37%], Zura Bio[31.90%], Cullinan Oncology[30.86%], Tutor Perini[28.01%], IGM Biosciences[23.36%], U.S. Silica[21.67%], Maxeon Solar[20.17%], Exponent [19.49%], TPI Composites[16.32%], OptimizeRx [14.84%], Solaris Oilfield[13.95%]