
 Login Sign Up


| |||||
 |  | ||||

| 12Stocks.com Market Intelligence |
Best SmallCap Stocks
|
| In a hurry? Small Cap Stock Lists: Performance Trends Table, Stock Charts
Sort Small Cap stocks: Daily, Weekly, Year-to-Date, Market Cap & Trends. Filter Small Cap stocks list by sector: Show all, Tech, Finance, Energy, Staples, Retail, Industrial, Materials, Utilities and HealthCare Filter Small Cap stocks list by size: All Large Medium Small and MicroCap |
| 12Stocks.com Small Cap Stocks Performances & Trends Daily | |||||||||
|
|  The overall Smart Investing & Trading Score is 23 (0-bearish to 100-bullish) which puts Small Cap index in short term bearish to neutral trend. The Smart Investing & Trading Score from previous trading session is 13 and hence an improvement of trend.
| ||||||||
Here are the Smart Investing & Trading Scores of the most requested small cap stocks at 12Stocks.com (click stock name for detailed review):
|


| 12Stocks.com: Investing in Smallcap Index with Stocks | |
|
The following table helps investors and traders sort through current performance and trends (as measured by Smart Investing & Trading Score) of various
stocks in the Smallcap Index. Quick View: Move mouse or cursor over stock symbol (ticker) to view short-term technical chart and over stock name to view long term chart. Click on  to add stock symbol to your watchlist and to add stock symbol to your watchlist and  to view watchlist. Click on any ticker or stock name for detailed market intelligence report for that stock. to view watchlist. Click on any ticker or stock name for detailed market intelligence report for that stock. |
12Stocks.com Performance of Stocks in Smallcap Index
| Ticker | Stock Name | Watchlist | Category | Recent Price | Smart Investing & Trading Score | Change % | YTD Change% |
| HBI | Hanesbrands |   | Consumer Staples | 4.73 | 68 | 0.42 | 6.05% |
| SB | Safe Bulkers | | Transports | 4.77 | 54 | 0.42 | 21.37% |
| SHLS | Shoals | | Technology | 8.31 | 17 | 0.42 | -46.35% |
| HOV | Hovnanian Enterprises | | Industrials | 129.03 | 7 | 0.41 | -17.09% |
| HSII | Heidrick & Struggles | | Services & Goods | 29.54 | 10 | 0.41 | 0.03% |
| ACTG | Acacia Research | | Services & Goods | 4.84 | 46 | 0.41 | 23.47% |
| TMP | Tompkins Financial | | Financials | 43.69 | 20 | 0.41 | -27.46% |
| ACCO | ACCO Brands | | Consumer Staples | 4.86 | 10 | 0.41 | -20.07% |
| ASB | Associated Banc-Corp | | Financials | 20.04 | 20 | 0.40 | -6.31% |
| FCPT | Four Corners | | Financials | 22.66 | 17 | 0.40 | -10.43% |
| STER | Sterling Check | | Technology | 15.13 | 48 | 0.40 | 8.61% |
| ATEN | A10 s | | Technology | 12.85 | 28 | 0.39 | -2.43% |
| RMR | RMR Group | | Financials | 23.34 | 17 | 0.39 | -17.32% |
| ALEC | Alector | | Health Care | 5.09 | 0 | 0.39 | -36.22% |
| OMI | Owens & Minor | | Services & Goods | 24.06 | 46 | 0.38 | 24.86% |
| BKE | Buckle | | Services & Goods | 36.68 | 25 | 0.38 | -22.81% |
| ARLO | Arlo | | Technology | 10.57 | 36 | 0.38 | 11.03% |
| ABM | ABM Industries | | Services & Goods | 43.80 | 53 | 0.37 | -2.30% |
| NGVC | Natural Grocers | | Services & Goods | 16.24 | 43 | 0.37 | 1.50% |
| GMRE | Global Medical | | Industrials | 8.12 | 35 | 0.37 | -26.85% |
| ASTE | Astec Industries | | Industrials | 41.88 | 53 | 0.36 | 12.58% |
| IMKTA | Ingles Markets | | Services & Goods | 73.36 | 37 | 0.36 | -15.06% |
| STRS | Stratus Properties | | Financials | 22.48 | 42 | 0.36 | -22.11% |
| EPM | Evolution | | Energy | 5.63 | 23 | 0.36 | -3.10% |
| CHUY | Chuy s | | Services & Goods | 30.43 | 10 | 0.36 | -20.40% |


| Too many stocks? View smallcap stocks filtered by marketcap & sector |
| Marketcap: All SmallCap Stocks (default-no microcap), Large, Mid-Range, Small |
| Smallcap Sector: Tech, Finance, Energy, Staples, Retail, Industrial, Materials, & Medical |
|
Get the most comprehensive stock market coverage daily at 12Stocks.com ➞ Best Stocks Today ➞ Best Stocks Weekly ➞ Best Stocks Year-to-Date ➞ Best Stocks Trends ➞  Best Stocks Today 12Stocks.com Best Nasdaq Stocks ➞ Best S&P 500 Stocks ➞ Best Tech Stocks ➞ Best Biotech Stocks ➞ |
| Detailed Overview of SmallCap Stocks |
| SmallCap Technical Overview, Leaders & Laggards, Top SmallCap ETF Funds & Detailed SmallCap Stocks List, Charts, Trends & More |
| Smallcap: Technical Analysis, Trends & YTD Performance | |
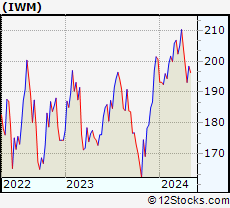
| SmallCap segment as represented by
IWM, an exchange-traded fund [ETF], holds basket of thousands of smallcap stocks from across all major sectors of the US stock market. The smallcap index (contains stocks like Riverbed & Sotheby's) is down by -3.92% and is currently underperforming the overall market by -8.11% year-to-date. Below is a quick view of technical charts and trends: | |
 IWM Weekly Chart |
|
| Long Term Trend: Not Good | |
| Medium Term Trend: Not Good | |
 IWM Daily Chart |
|
| Short Term Trend: Not Good | |
| Overall Trend Score: 23 | |
| YTD Performance: -3.92% | |
| **Trend Scores & Views Are Only For Educational Purposes And Not For Investing | |
| 12Stocks.com: Top Performing Small Cap Index Stocks | ||||||||||||||||||||||||||||||||||||||||||||||||
 The top performing Small Cap Index stocks year to date are
Now, more recently, over last week, the top performing Small Cap Index stocks on the move are


|
||||||||||||||||||||||||||||||||||||||||||||||||
| 12Stocks.com: Investing in Smallcap Index using Exchange Traded Funds | |
|
The following table shows list of key exchange traded funds (ETF) that
help investors track Smallcap index. The following list also includes leveraged ETF funds that track twice or thrice the daily returns of Smallcap indices. Short or inverse ETF funds move in the opposite direction to the index they track and are useful during market pullbacks or during bear markets. Quick View: Move mouse or cursor over ETF symbol (ticker) to view short-term technical chart and over ETF name to view long term chart. Click on ticker or stock name for detailed view. Click on to add stock symbol to your watchlist and to view watchlist. |
12Stocks.com List of ETFs that track Smallcap Index
| Ticker | ETF Name | Watchlist | Recent Price | Smart Investing & Trading Score | Change % | Week % | Year-to-date % |
| IWM | iShares Russell 2000 | | 192.84 | 23 | -0.08 | -2.94 | -3.92% |
| IJR | iShares Core S&P Small-Cap | | 102.34 | 10 | 0.21 | -2.08 | -5.46% |
| VTWO | Vanguard Russell 2000 ETF | | 77.95 | 23 | -0.13 | -2.95 | -3.88% |
| IWN | iShares Russell 2000 Value | | 146.33 | 10 | 0.21 | -2.69 | -5.79% |
| IJS | iShares S&P Small-Cap 600 Value | | 94.51 | 18 | 0.41 | -1.73 | -8.31% |
| IWO | iShares Russell 2000 Growth | | 246.94 | 36 | -0.44 | -3.3 | -2.09% |
| IJT | iShares S&P Small-Cap 600 Growth | | 121.57 | 13 | -0.22 | -2.57 | -2.85% |
| XSLV | PowerShares S&P SmallCap Low Volatil ETF | | 41.65 | 25 | 0.56 | -1.05 | -5.66% |
| SAA | ProShares Ultra SmallCap600 | | 21.62 | 10 | -0.18 | -4.17 | -13.35% |
| SMLV | SPDR SSGA US Small Cap Low Volatil ETF | | 103.83 | 10 | 0.16 | -1.13 | -7.72% |
| SBB | ProShares Short SmallCap600 | | 16.98 | 100 | 0.77 | 2.62 | 6.59% |
| SDD | ProShares UltraShort SmallCap600 | | 20.69 | 95 | 0.44 | 4.33 | 12.28% |
| 12Stocks.com: Charts, Trends, Fundamental Data and Performances of SmallCap Stocks | |
|
We now take in-depth look at all SmallCap stocks including charts, multi-period performances and overall trends (as measured by Smart Investing & Trading Score). One can sort SmallCap stocks (click link to choose) by Daily, Weekly and by Year-to-Date performances. Also, one can sort by size of the company or by market capitalization. |
| Select Your Default Chart Type: | |||||
| |||||
| Click on stock symbol or name for detailed view. Click on to add stock symbol to your watchlist and to view watchlist. Quick View: Move mouse or cursor over "Daily" to quickly view daily technical stock chart and over "Weekly" to view weekly technical stock chart. | |||||

 | HBI Hanesbrands Inc. |
| Sector: Consumer Staples | |
| SubSector: Textile - Apparel Clothing | |
| MarketCap: 3559.75 Millions | |
| Recent Price: 4.73 Smart Investing & Trading Score: 68 | |
| Day Percent Change: 0.42% Day Change: 0.02 | |
| Week Change: -2.47% Year-to-date Change: 6.1% | |
| HBI Links: Profile News Message Board | |
| Charts:- Daily , Weekly | |
| Add HBI to Watchlist: View: Get Complete HBI Trend Analysis ➞ | |
 | SB Safe Bulkers, Inc. |
| Sector: Transports | |
| SubSector: Shipping | |
| MarketCap: 108.114 Millions | |
| Recent Price: 4.77 Smart Investing & Trading Score: 54 | |
| Day Percent Change: 0.42% Day Change: 0.02 | |
| Week Change: 1.27% Year-to-date Change: 21.4% | |
| SB Links: Profile News Message Board | |
| Charts:- Daily , Weekly | |
| Add SB to Watchlist: View: Get Complete SB Trend Analysis ➞ | |
 | SHLS Shoals Technologies Group, Inc. |
| Sector: Technology | |
| SubSector: Solar | |
| MarketCap: 4360 Millions | |
| Recent Price: 8.31 Smart Investing & Trading Score: 17 | |
| Day Percent Change: 0.42% Day Change: 0.04 | |
| Week Change: -9.32% Year-to-date Change: -46.4% | |
| SHLS Links: Profile News Message Board | |
| Charts:- Daily , Weekly | |
| Add SHLS to Watchlist: View: Get Complete SHLS Trend Analysis ➞ | |
 | HOV Hovnanian Enterprises, Inc. |
| Sector: Industrials | |
| SubSector: Residential Construction | |
| MarketCap: 59.9106 Millions | |
| Recent Price: 129.03 Smart Investing & Trading Score: 7 | |
| Day Percent Change: 0.41% Day Change: 0.53 | |
| Week Change: -8.9% Year-to-date Change: -17.1% | |
| HOV Links: Profile News Message Board | |
| Charts:- Daily , Weekly | |
| Add HOV to Watchlist: View: Get Complete HOV Trend Analysis ➞ | |
 | HSII Heidrick & Struggles International, Inc. |
| Sector: Services & Goods | |
| SubSector: Staffing & Outsourcing Services | |
| MarketCap: 431.428 Millions | |
| Recent Price: 29.54 Smart Investing & Trading Score: 10 | |
| Day Percent Change: 0.41% Day Change: 0.12 | |
| Week Change: -3.53% Year-to-date Change: 0.0% | |
| HSII Links: Profile News Message Board | |
| Charts:- Daily , Weekly | |
| Add HSII to Watchlist: View: Get Complete HSII Trend Analysis ➞ | |
 | ACTG Acacia Research Corporation |
| Sector: Services & Goods | |
| SubSector: Business Services | |
| MarketCap: 112.782 Millions | |
| Recent Price: 4.84 Smart Investing & Trading Score: 46 | |
| Day Percent Change: 0.41% Day Change: 0.02 | |
| Week Change: -3.59% Year-to-date Change: 23.5% | |
| ACTG Links: Profile News Message Board | |
| Charts:- Daily , Weekly | |
| Add ACTG to Watchlist: View: Get Complete ACTG Trend Analysis ➞ | |
 | TMP Tompkins Financial Corporation |
| Sector: Financials | |
| SubSector: Regional - Northeast Banks | |
| MarketCap: 1144.79 Millions | |
| Recent Price: 43.69 Smart Investing & Trading Score: 20 | |
| Day Percent Change: 0.41% Day Change: 0.18 | |
| Week Change: -1.44% Year-to-date Change: -27.5% | |
| TMP Links: Profile News Message Board | |
| Charts:- Daily , Weekly | |
| Add TMP to Watchlist: View: Get Complete TMP Trend Analysis ➞ | |
 | ACCO ACCO Brands Corporation |
| Sector: Consumer Staples | |
| SubSector: Office Supplies | |
| MarketCap: 448.2 Millions | |
| Recent Price: 4.86 Smart Investing & Trading Score: 10 | |
| Day Percent Change: 0.41% Day Change: 0.02 | |
| Week Change: -3.38% Year-to-date Change: -20.1% | |
| ACCO Links: Profile News Message Board | |
| Charts:- Daily , Weekly | |
| Add ACCO to Watchlist: View: Get Complete ACCO Trend Analysis ➞ | |
 | ASB Associated Banc-Corp |
| Sector: Financials | |
| SubSector: Regional - Midwest Banks | |
| MarketCap: 1904.8 Millions | |
| Recent Price: 20.04 Smart Investing & Trading Score: 20 | |
| Day Percent Change: 0.40% Day Change: 0.08 | |
| Week Change: -1.38% Year-to-date Change: -6.3% | |
| ASB Links: Profile News Message Board | |
| Charts:- Daily , Weekly | |
| Add ASB to Watchlist: View: Get Complete ASB Trend Analysis ➞ | |
 | FCPT Four Corners Property Trust, Inc. |
| Sector: Financials | |
| SubSector: REIT - Hotel/Motel | |
| MarketCap: 1218.94 Millions | |
| Recent Price: 22.66 Smart Investing & Trading Score: 17 | |
| Day Percent Change: 0.40% Day Change: 0.09 | |
| Week Change: -2.91% Year-to-date Change: -10.4% | |
| FCPT Links: Profile News Message Board | |
| Charts:- Daily , Weekly | |
| Add FCPT to Watchlist: View: Get Complete FCPT Trend Analysis ➞ | |
 | STER Sterling Check Corp. |
| Sector: Technology | |
| SubSector: Software - Infrastructure | |
| MarketCap: 1180 Millions | |
| Recent Price: 15.13 Smart Investing & Trading Score: 48 | |
| Day Percent Change: 0.40% Day Change: 0.06 | |
| Week Change: -2.32% Year-to-date Change: 8.6% | |
| STER Links: Profile News Message Board | |
| Charts:- Daily , Weekly | |
| Add STER to Watchlist: View: Get Complete STER Trend Analysis ➞ | |
 | ATEN A10 Networks, Inc. |
| Sector: Technology | |
| SubSector: Communication Equipment | |
| MarketCap: 363.739 Millions | |
| Recent Price: 12.85 Smart Investing & Trading Score: 28 | |
| Day Percent Change: 0.39% Day Change: 0.05 | |
| Week Change: -1.91% Year-to-date Change: -2.4% | |
| ATEN Links: Profile News Message Board | |
| Charts:- Daily , Weekly | |
| Add ATEN to Watchlist: View: Get Complete ATEN Trend Analysis ➞ | |
 | RMR The RMR Group Inc. |
| Sector: Financials | |
| SubSector: Real Estate Development | |
| MarketCap: 797.419 Millions | |
| Recent Price: 23.34 Smart Investing & Trading Score: 17 | |
| Day Percent Change: 0.39% Day Change: 0.09 | |
| Week Change: -2.91% Year-to-date Change: -17.3% | |
| RMR Links: Profile News Message Board | |
| Charts:- Daily , Weekly | |
| Add RMR to Watchlist: View: Get Complete RMR Trend Analysis ➞ | |
 | ALEC Alector, Inc. |
| Sector: Health Care | |
| SubSector: Biotechnology | |
| MarketCap: 2719.35 Millions | |
| Recent Price: 5.09 Smart Investing & Trading Score: 0 | |
| Day Percent Change: 0.39% Day Change: 0.02 | |
| Week Change: -15.45% Year-to-date Change: -36.2% | |
| ALEC Links: Profile News Message Board | |
| Charts:- Daily , Weekly | |
| Add ALEC to Watchlist: View: Get Complete ALEC Trend Analysis ➞ | |
 | OMI Owens & Minor, Inc. |
| Sector: Services & Goods | |
| SubSector: Medical Equipment Wholesale | |
| MarketCap: 403.92 Millions | |
| Recent Price: 24.06 Smart Investing & Trading Score: 46 | |
| Day Percent Change: 0.38% Day Change: 0.09 | |
| Week Change: -5.94% Year-to-date Change: 24.9% | |
| OMI Links: Profile News Message Board | |
| Charts:- Daily , Weekly | |
| Add OMI to Watchlist: View: Get Complete OMI Trend Analysis ➞ | |
 | BKE The Buckle, Inc. |
| Sector: Services & Goods | |
| SubSector: Apparel Stores | |
| MarketCap: 913.808 Millions | |
| Recent Price: 36.68 Smart Investing & Trading Score: 25 | |
| Day Percent Change: 0.38% Day Change: 0.14 | |
| Week Change: -0.41% Year-to-date Change: -22.8% | |
| BKE Links: Profile News Message Board | |
| Charts:- Daily , Weekly | |
| Add BKE to Watchlist: View: Get Complete BKE Trend Analysis ➞ | |
 | ARLO Arlo Technologies, Inc. |
| Sector: Technology | |
| SubSector: Security Software & Services | |
| MarketCap: 163.317 Millions | |
| Recent Price: 10.57 Smart Investing & Trading Score: 36 | |
| Day Percent Change: 0.38% Day Change: 0.04 | |
| Week Change: -6.54% Year-to-date Change: 11.0% | |
| ARLO Links: Profile News Message Board | |
| Charts:- Daily , Weekly | |
| Add ARLO to Watchlist: View: Get Complete ARLO Trend Analysis ➞ | |
 | ABM ABM Industries Incorporated |
| Sector: Services & Goods | |
| SubSector: Business Services | |
| MarketCap: 1706.72 Millions | |
| Recent Price: 43.80 Smart Investing & Trading Score: 53 | |
| Day Percent Change: 0.37% Day Change: 0.16 | |
| Week Change: 0.53% Year-to-date Change: -2.3% | |
| ABM Links: Profile News Message Board | |
| Charts:- Daily , Weekly | |
| Add ABM to Watchlist: View: Get Complete ABM Trend Analysis ➞ | |
 | NGVC Natural Grocers by Vitamin Cottage, Inc. |
| Sector: Services & Goods | |
| SubSector: Grocery Stores | |
| MarketCap: 185.475 Millions | |
| Recent Price: 16.24 Smart Investing & Trading Score: 43 | |
| Day Percent Change: 0.37% Day Change: 0.06 | |
| Week Change: -0.25% Year-to-date Change: 1.5% | |
| NGVC Links: Profile News Message Board | |
| Charts:- Daily , Weekly | |
| Add NGVC to Watchlist: View: Get Complete NGVC Trend Analysis ➞ | |
 | GMRE Global Medical REIT Inc. |
| Sector: Industrials | |
| SubSector: Conglomerates | |
| MarketCap: 529.748 Millions | |
| Recent Price: 8.12 Smart Investing & Trading Score: 35 | |
| Day Percent Change: 0.37% Day Change: 0.03 | |
| Week Change: -2.29% Year-to-date Change: -26.9% | |
| GMRE Links: Profile News Message Board | |
| Charts:- Daily , Weekly | |
| Add GMRE to Watchlist: View: Get Complete GMRE Trend Analysis ➞ | |
 | ASTE Astec Industries, Inc. |
| Sector: Industrials | |
| SubSector: Farm & Construction Machinery | |
| MarketCap: 731.607 Millions | |
| Recent Price: 41.88 Smart Investing & Trading Score: 53 | |
| Day Percent Change: 0.36% Day Change: 0.15 | |
| Week Change: -1.44% Year-to-date Change: 12.6% | |
| ASTE Links: Profile News Message Board | |
| Charts:- Daily , Weekly | |
| Add ASTE to Watchlist: View: Get Complete ASTE Trend Analysis ➞ | |
 | IMKTA Ingles Markets, Incorporated |
| Sector: Services & Goods | |
| SubSector: Grocery Stores | |
| MarketCap: 827.075 Millions | |
| Recent Price: 73.36 Smart Investing & Trading Score: 37 | |
| Day Percent Change: 0.36% Day Change: 0.26 | |
| Week Change: 0.48% Year-to-date Change: -15.1% | |
| IMKTA Links: Profile News Message Board | |
| Charts:- Daily , Weekly | |
| Add IMKTA to Watchlist: View: Get Complete IMKTA Trend Analysis ➞ | |
 | STRS Stratus Properties Inc. |
| Sector: Financials | |
| SubSector: Real Estate Development | |
| MarketCap: 167.819 Millions | |
| Recent Price: 22.48 Smart Investing & Trading Score: 42 | |
| Day Percent Change: 0.36% Day Change: 0.08 | |
| Week Change: 0.9% Year-to-date Change: -22.1% | |
| STRS Links: Profile News Message Board | |
| Charts:- Daily , Weekly | |
| Add STRS to Watchlist: View: Get Complete STRS Trend Analysis ➞ | |
 | EPM Evolution Petroleum Corporation |
| Sector: Energy | |
| SubSector: Independent Oil & Gas | |
| MarketCap: 98.0593 Millions | |
| Recent Price: 5.63 Smart Investing & Trading Score: 23 | |
| Day Percent Change: 0.36% Day Change: 0.02 | |
| Week Change: -2.26% Year-to-date Change: -3.1% | |
| EPM Links: Profile News Message Board | |
| Charts:- Daily , Weekly | |
| Add EPM to Watchlist: View: Get Complete EPM Trend Analysis ➞ | |
 | CHUY Chuy s Holdings, Inc. |
| Sector: Services & Goods | |
| SubSector: Restaurants | |
| MarketCap: 159.17 Millions | |
| Recent Price: 30.43 Smart Investing & Trading Score: 10 | |
| Day Percent Change: 0.36% Day Change: 0.11 | |
| Week Change: -3.55% Year-to-date Change: -20.4% | |
| CHUY Links: Profile News Message Board | |
| Charts:- Daily , Weekly | |
| Add CHUY to Watchlist: View: Get Complete CHUY Trend Analysis ➞ | |
| Too many stocks? View smallcap stocks filtered by marketcap & sector |
| Marketcap: All SmallCap Stocks (default-no microcap), Large, Mid-Range, Small & MicroCap |
| Sector: Tech, Finance, Energy, Staples, Retail, Industrial, Materials, Utilities & Medical |
|
Best Stocks Today 12Stocks.com |
© 2024 12Stocks.com Terms & Conditions Privacy Contact Us
All Information Provided Only For Education And Not To Be Used For Investing or Trading. See Terms & Conditions


One More Thing ... Get Best Stocks Delivered Daily!
Never Ever Miss A Move With Our Top Ten Stocks Lists
Find Best Stocks In Any Market - Bull or Bear Market
Take A Peek At Our Top Ten Stocks Lists: Daily, Weekly, Year-to-Date & Top Trends
Find Best Stocks In Any Market - Bull or Bear Market
Take A Peek At Our Top Ten Stocks Lists: Daily, Weekly, Year-to-Date & Top Trends
Smallcap Stocks With Best Up Trends [0-bearish to 100-bullish]: Badger Meter[100], Cullinan Oncology[100], Oscar Health[100], NextNav [100], EchoStar [100], Victory Capital[100], Macatawa Bank[100], IMAX [100], Envestnet [100], ALX Oncology[100], Argan [95]
Best Smallcap Stocks Year-to-Date:
Agenus [500.31%], CareMax [417.53%], Janux [348.12%], Viking [247.5%], Alpine Immune[238.5%], Super Micro[226.63%], Longboard [194.76%], Arcutis Bio[192.57%], Vera [161.3%], Avidity Biosciences[154.87%], Hippo [128.32%] Best Smallcap Stocks This Week:
Macatawa Bank[44.42%], 23andMe Holding[33.3%], ProKidney [32%], Snap One[29.73%], Vertex Energy[25.96%], ALX Oncology[20.64%], Vanda [20.63%], Expensify [18.37%], Badger Meter[16.72%], ContextLogic [15%], Cullinan Oncology[13.89%] Best Smallcap Stocks Daily:
23andMe Holding[65.91%], Vertex Energy[33.78%], Zura Bio[17.20%], Badger Meter[16.65%], ContextLogic [15.81%], Expensify [15.23%], Montrose Environmental[12.84%], Vaxxinity [10.05%], Cipher Mining[8.65%], FiscalNote [8.61%], Vuzix [8.15%]