
 Login Sign Up


| |||||
 |  | ||||

| 12Stocks.com Market Intelligence |
Best SmallCap Stocks
|
| In a hurry? Small Cap Stock Lists: Performance Trends Table, Stock Charts
Sort Small Cap stocks: Daily, Weekly, Year-to-Date, Market Cap & Trends. Filter Small Cap stocks list by sector: Show all, Tech, Finance, Energy, Staples, Retail, Industrial, Materials, Utilities and HealthCare Filter Small Cap stocks list by size: All Large Medium Small and MicroCap |
| 12Stocks.com Small Cap Stocks Performances & Trends Daily | |||||||||
|
|  The overall Smart Investing & Trading Score is 23 (0-bearish to 100-bullish) which puts Small Cap index in short term bearish to neutral trend. The Smart Investing & Trading Score from previous trading session is 13 and hence an improvement of trend.
| ||||||||
Here are the Smart Investing & Trading Scores of the most requested small cap stocks at 12Stocks.com (click stock name for detailed review):
|


| 12Stocks.com: Investing in Smallcap Index with Stocks | |
|
The following table helps investors and traders sort through current performance and trends (as measured by Smart Investing & Trading Score) of various
stocks in the Smallcap Index. Quick View: Move mouse or cursor over stock symbol (ticker) to view short-term technical chart and over stock name to view long term chart. Click on  to add stock symbol to your watchlist and to add stock symbol to your watchlist and  to view watchlist. Click on any ticker or stock name for detailed market intelligence report for that stock. to view watchlist. Click on any ticker or stock name for detailed market intelligence report for that stock. |
12Stocks.com Performance of Stocks in Smallcap Index
| Ticker | Stock Name | Watchlist | Category | Recent Price | Smart Investing & Trading Score | Change % | YTD Change% |
| DAWN | Day One |   | Health Care | 14.98 | 62 | 0.74 | 1.97% |
| ATI | Allegheny | | Industrials | 51.10 | 58 | 0.73 | 12.38% |
| DCO | Ducommun | | Industrials | 51.85 | 51 | 0.72 | -0.40% |
| CBZ | CBIZ | | Services & Goods | 74.22 | 49 | 0.72 | 18.58% |
| CNOB | ConnectOne Bancorp | | Financials | 18.13 | 35 | 0.72 | -20.86% |
| AX | Axos Financial | | Financials | 49.21 | 10 | 0.72 | -9.87% |
| DOCN | DigitalOcean | | Technology | 33.47 | 23 | 0.72 | -9.49% |
| RBOT | Vicarious Surgical | | Health Care | 0.28 | 25 | 0.72 | -23.94% |
| PAYO | Payoneer Global | | Technology | 4.89 | 86 | 0.72 | -7.56% |
| SASR | Sandy Spring | | Financials | 19.95 | 42 | 0.71 | -26.76% |
| RYAM | Rayonier Advanced | | Materials | 4.26 | 33 | 0.71 | 5.19% |
| CCBG | Capital City | | Financials | 26.01 | 25 | 0.70 | -11.62% |
| CCO | Clear Channel | | Services & Goods | 1.44 | 0 | 0.70 | -20.88% |
| UMBF | UMB Financial | | Financials | 80.23 | 28 | 0.70 | -3.97% |
| LE | Lands | | Services & Goods | 12.93 | 90 | 0.70 | 35.25% |
| GPMT | Granite Point | | Financials | 4.31 | 17 | 0.70 | -27.44% |
| HAFC | Hanmi Financial | | Financials | 14.60 | 37 | 0.69 | -24.74% |
| OXM | Oxford Industries | | Consumer Staples | 103.12 | 61 | 0.68 | 3.12% |
| SNBR | Sleep Number | | Consumer Staples | 13.27 | 46 | 0.68 | -10.52% |
| MLI | Mueller Industries | | Industrials | 52.32 | 68 | 0.67 | 10.97% |
| IBOC | Bancshares | | Financials | 52.53 | 48 | 0.67 | -3.30% |
| IIIN | Insteel Industries | | Materials | 32.97 | 17 | 0.67 | -13.89% |
| NECB | Northeast Community | | Financials | 15.02 | 36 | 0.67 | -15.33% |
| LOCO | El Pollo | | Services & Goods | 8.32 | 10 | 0.67 | -5.61% |
| LCII | LCI Industries | | Consumer Staples | 104.19 | 10 | 0.67 | -17.12% |


| Too many stocks? View smallcap stocks filtered by marketcap & sector |
| Marketcap: All SmallCap Stocks (default-no microcap), Large, Mid-Range, Small |
| Smallcap Sector: Tech, Finance, Energy, Staples, Retail, Industrial, Materials, & Medical |
|
Get the most comprehensive stock market coverage daily at 12Stocks.com ➞ Best Stocks Today ➞ Best Stocks Weekly ➞ Best Stocks Year-to-Date ➞ Best Stocks Trends ➞  Best Stocks Today 12Stocks.com Best Nasdaq Stocks ➞ Best S&P 500 Stocks ➞ Best Tech Stocks ➞ Best Biotech Stocks ➞ |
| Detailed Overview of SmallCap Stocks |
| SmallCap Technical Overview, Leaders & Laggards, Top SmallCap ETF Funds & Detailed SmallCap Stocks List, Charts, Trends & More |
| Smallcap: Technical Analysis, Trends & YTD Performance | |
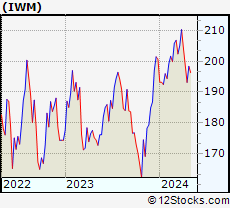
| SmallCap segment as represented by
IWM, an exchange-traded fund [ETF], holds basket of thousands of smallcap stocks from across all major sectors of the US stock market. The smallcap index (contains stocks like Riverbed & Sotheby's) is down by -3.92% and is currently underperforming the overall market by -8.11% year-to-date. Below is a quick view of technical charts and trends: | |
 IWM Weekly Chart |
|
| Long Term Trend: Not Good | |
| Medium Term Trend: Not Good | |
 IWM Daily Chart |
|
| Short Term Trend: Not Good | |
| Overall Trend Score: 23 | |
| YTD Performance: -3.92% | |
| **Trend Scores & Views Are Only For Educational Purposes And Not For Investing | |
| 12Stocks.com: Top Performing Small Cap Index Stocks | ||||||||||||||||||||||||||||||||||||||||||||||||
 The top performing Small Cap Index stocks year to date are
Now, more recently, over last week, the top performing Small Cap Index stocks on the move are


|
||||||||||||||||||||||||||||||||||||||||||||||||
| 12Stocks.com: Investing in Smallcap Index using Exchange Traded Funds | |
|
The following table shows list of key exchange traded funds (ETF) that
help investors track Smallcap index. The following list also includes leveraged ETF funds that track twice or thrice the daily returns of Smallcap indices. Short or inverse ETF funds move in the opposite direction to the index they track and are useful during market pullbacks or during bear markets. Quick View: Move mouse or cursor over ETF symbol (ticker) to view short-term technical chart and over ETF name to view long term chart. Click on ticker or stock name for detailed view. Click on to add stock symbol to your watchlist and to view watchlist. |
12Stocks.com List of ETFs that track Smallcap Index
| Ticker | ETF Name | Watchlist | Recent Price | Smart Investing & Trading Score | Change % | Week % | Year-to-date % |
| IWM | iShares Russell 2000 | | 192.84 | 23 | -0.08 | -2.94 | -3.92% |
| IJR | iShares Core S&P Small-Cap | | 102.34 | 31 | 0.21 | -2.08 | -5.46% |
| VTWO | Vanguard Russell 2000 ETF | | 77.94 | 23 | -0.14 | -2.96 | -3.9% |
| IWN | iShares Russell 2000 Value | | 146.33 | 10 | 0.21 | -2.69 | -5.79% |
| IJS | iShares S&P Small-Cap 600 Value | | 94.51 | 10 | 0.41 | -1.73 | -8.31% |
| IWO | iShares Russell 2000 Growth | | 246.94 | 36 | -0.44 | -3.3 | -2.09% |
| IJT | iShares S&P Small-Cap 600 Growth | | 121.59 | 23 | -0.21 | -2.56 | -2.84% |
| XSLV | PowerShares S&P SmallCap Low Volatil ETF | | 41.65 | 25 | 0.56 | -1.05 | -5.66% |
| SAA | ProShares Ultra SmallCap600 | | 21.62 | 10 | -0.18 | -4.17 | -13.35% |
| SMLV | SPDR SSGA US Small Cap Low Volatil ETF | | 103.83 | 18 | 0.16 | -1.13 | -7.72% |
| SBB | ProShares Short SmallCap600 | | 16.77 | 80 | -0.50 | 1.32 | 5.24% |
| SDD | ProShares UltraShort SmallCap600 | | 20.16 | 80 | -2.14 | 1.66 | 9.41% |
| 12Stocks.com: Charts, Trends, Fundamental Data and Performances of SmallCap Stocks | |
|
We now take in-depth look at all SmallCap stocks including charts, multi-period performances and overall trends (as measured by Smart Investing & Trading Score). One can sort SmallCap stocks (click link to choose) by Daily, Weekly and by Year-to-Date performances. Also, one can sort by size of the company or by market capitalization. |
| Select Your Default Chart Type: | |||||
| |||||
| Click on stock symbol or name for detailed view. Click on to add stock symbol to your watchlist and to view watchlist. Quick View: Move mouse or cursor over "Daily" to quickly view daily technical stock chart and over "Weekly" to view weekly technical stock chart. | |||||

 | DAWN Day One Biopharmaceuticals, Inc. |
| Sector: Health Care | |
| SubSector: Biotechnology | |
| MarketCap: 1040 Millions | |
| Recent Price: 14.98 Smart Investing & Trading Score: 62 | |
| Day Percent Change: 0.74% Day Change: 0.11 | |
| Week Change: 8.79% Year-to-date Change: 2.0% | |
| DAWN Links: Profile News Message Board | |
| Charts:- Daily , Weekly | |
| Add DAWN to Watchlist: View: Get Complete DAWN Trend Analysis ➞ | |
 | ATI Allegheny Technologies Incorporated |
| Sector: Industrials | |
| SubSector: Metal Fabrication | |
| MarketCap: 913.35 Millions | |
| Recent Price: 51.10 Smart Investing & Trading Score: 58 | |
| Day Percent Change: 0.73% Day Change: 0.37 | |
| Week Change: -1.05% Year-to-date Change: 12.4% | |
| ATI Links: Profile News Message Board | |
| Charts:- Daily , Weekly | |
| Add ATI to Watchlist: View: Get Complete ATI Trend Analysis ➞ | |
 | DCO Ducommun Incorporated |
| Sector: Industrials | |
| SubSector: Aerospace/Defense Products & Services | |
| MarketCap: 261.101 Millions | |
| Recent Price: 51.85 Smart Investing & Trading Score: 51 | |
| Day Percent Change: 0.72% Day Change: 0.37 | |
| Week Change: -5.45% Year-to-date Change: -0.4% | |
| DCO Links: Profile News Message Board | |
| Charts:- Daily , Weekly | |
| Add DCO to Watchlist: View: Get Complete DCO Trend Analysis ➞ | |
 | CBZ CBIZ, Inc. |
| Sector: Services & Goods | |
| SubSector: Business Services | |
| MarketCap: 1121.32 Millions | |
| Recent Price: 74.22 Smart Investing & Trading Score: 49 | |
| Day Percent Change: 0.72% Day Change: 0.53 | |
| Week Change: 0.28% Year-to-date Change: 18.6% | |
| CBZ Links: Profile News Message Board | |
| Charts:- Daily , Weekly | |
| Add CBZ to Watchlist: View: Get Complete CBZ Trend Analysis ➞ | |
 | CNOB ConnectOne Bancorp, Inc. |
| Sector: Financials | |
| SubSector: Regional - Northeast Banks | |
| MarketCap: 491.899 Millions | |
| Recent Price: 18.13 Smart Investing & Trading Score: 35 | |
| Day Percent Change: 0.72% Day Change: 0.13 | |
| Week Change: 1.51% Year-to-date Change: -20.9% | |
| CNOB Links: Profile News Message Board | |
| Charts:- Daily , Weekly | |
| Add CNOB to Watchlist: View: Get Complete CNOB Trend Analysis ➞ | |
 | AX Axos Financial, Inc. |
| Sector: Financials | |
| SubSector: Savings & Loans | |
| MarketCap: 1037.3 Millions | |
| Recent Price: 49.21 Smart Investing & Trading Score: 10 | |
| Day Percent Change: 0.72% Day Change: 0.35 | |
| Week Change: -0.85% Year-to-date Change: -9.9% | |
| AX Links: Profile News Message Board | |
| Charts:- Daily , Weekly | |
| Add AX to Watchlist: View: Get Complete AX Trend Analysis ➞ | |
 | DOCN DigitalOcean Holdings, Inc. |
| Sector: Technology | |
| SubSector: Software - Infrastructure | |
| MarketCap: 3620 Millions | |
| Recent Price: 33.47 Smart Investing & Trading Score: 23 | |
| Day Percent Change: 0.72% Day Change: 0.24 | |
| Week Change: -4.67% Year-to-date Change: -9.5% | |
| DOCN Links: Profile News Message Board | |
| Charts:- Daily , Weekly | |
| Add DOCN to Watchlist: View: Get Complete DOCN Trend Analysis ➞ | |
 | RBOT Vicarious Surgical Inc. |
| Sector: Health Care | |
| SubSector: Medical Devices | |
| MarketCap: 241 Millions | |
| Recent Price: 0.28 Smart Investing & Trading Score: 25 | |
| Day Percent Change: 0.72% Day Change: 0.00 | |
| Week Change: -10.92% Year-to-date Change: -23.9% | |
| RBOT Links: Profile News Message Board | |
| Charts:- Daily , Weekly | |
| Add RBOT to Watchlist: View: Get Complete RBOT Trend Analysis ➞ | |
 | PAYO Payoneer Global Inc. |
| Sector: Technology | |
| SubSector: Software - Infrastructure | |
| MarketCap: 1710 Millions | |
| Recent Price: 4.89 Smart Investing & Trading Score: 86 | |
| Day Percent Change: 0.72% Day Change: 0.03 | |
| Week Change: 1.24% Year-to-date Change: -7.6% | |
| PAYO Links: Profile News Message Board | |
| Charts:- Daily , Weekly | |
| Add PAYO to Watchlist: View: Get Complete PAYO Trend Analysis ➞ | |
 | SASR Sandy Spring Bancorp, Inc. |
| Sector: Financials | |
| SubSector: Regional - Mid-Atlantic Banks | |
| MarketCap: 764.659 Millions | |
| Recent Price: 19.95 Smart Investing & Trading Score: 42 | |
| Day Percent Change: 0.71% Day Change: 0.14 | |
| Week Change: -1.72% Year-to-date Change: -26.8% | |
| SASR Links: Profile News Message Board | |
| Charts:- Daily , Weekly | |
| Add SASR to Watchlist: View: Get Complete SASR Trend Analysis ➞ | |
 | RYAM Rayonier Advanced Materials Inc. |
| Sector: Materials | |
| SubSector: Chemicals - Major Diversified | |
| MarketCap: 116.736 Millions | |
| Recent Price: 4.26 Smart Investing & Trading Score: 33 | |
| Day Percent Change: 0.71% Day Change: 0.03 | |
| Week Change: -5.96% Year-to-date Change: 5.2% | |
| RYAM Links: Profile News Message Board | |
| Charts:- Daily , Weekly | |
| Add RYAM to Watchlist: View: Get Complete RYAM Trend Analysis ➞ | |
 | CCBG Capital City Bank Group, Inc. |
| Sector: Financials | |
| SubSector: Regional - Mid-Atlantic Banks | |
| MarketCap: 314.459 Millions | |
| Recent Price: 26.01 Smart Investing & Trading Score: 25 | |
| Day Percent Change: 0.70% Day Change: 0.18 | |
| Week Change: -0.15% Year-to-date Change: -11.6% | |
| CCBG Links: Profile News Message Board | |
| Charts:- Daily , Weekly | |
| Add CCBG to Watchlist: View: Get Complete CCBG Trend Analysis ➞ | |
 | CCO Clear Channel Outdoor Holdings, Inc. |
| Sector: Services & Goods | |
| SubSector: Marketing Services | |
| MarketCap: 312.715 Millions | |
| Recent Price: 1.44 Smart Investing & Trading Score: 0 | |
| Day Percent Change: 0.70% Day Change: 0.01 | |
| Week Change: -5.26% Year-to-date Change: -20.9% | |
| CCO Links: Profile News Message Board | |
| Charts:- Daily , Weekly | |
| Add CCO to Watchlist: View: Get Complete CCO Trend Analysis ➞ | |
 | UMBF UMB Financial Corporation |
| Sector: Financials | |
| SubSector: Regional - Southwest Banks | |
| MarketCap: 2207.35 Millions | |
| Recent Price: 80.23 Smart Investing & Trading Score: 28 | |
| Day Percent Change: 0.70% Day Change: 0.56 | |
| Week Change: 0.2% Year-to-date Change: -4.0% | |
| UMBF Links: Profile News Message Board | |
| Charts:- Daily , Weekly | |
| Add UMBF to Watchlist: View: Get Complete UMBF Trend Analysis ➞ | |
 | LE Lands End, Inc. |
| Sector: Services & Goods | |
| SubSector: Catalog & Mail Order Houses | |
| MarketCap: 268.692 Millions | |
| Recent Price: 12.93 Smart Investing & Trading Score: 90 | |
| Day Percent Change: 0.70% Day Change: 0.09 | |
| Week Change: 0.47% Year-to-date Change: 35.3% | |
| LE Links: Profile News Message Board | |
| Charts:- Daily , Weekly | |
| Add LE to Watchlist: View: Get Complete LE Trend Analysis ➞ | |
 | GPMT Granite Point Mortgage Trust Inc. |
| Sector: Financials | |
| SubSector: Mortgage Investment | |
| MarketCap: 289.739 Millions | |
| Recent Price: 4.31 Smart Investing & Trading Score: 17 | |
| Day Percent Change: 0.70% Day Change: 0.03 | |
| Week Change: -2.49% Year-to-date Change: -27.4% | |
| GPMT Links: Profile News Message Board | |
| Charts:- Daily , Weekly | |
| Add GPMT to Watchlist: View: Get Complete GPMT Trend Analysis ➞ | |
 | HAFC Hanmi Financial Corporation |
| Sector: Financials | |
| SubSector: Regional - Pacific Banks | |
| MarketCap: 319.929 Millions | |
| Recent Price: 14.60 Smart Investing & Trading Score: 37 | |
| Day Percent Change: 0.69% Day Change: 0.10 | |
| Week Change: -1.55% Year-to-date Change: -24.7% | |
| HAFC Links: Profile News Message Board | |
| Charts:- Daily , Weekly | |
| Add HAFC to Watchlist: View: Get Complete HAFC Trend Analysis ➞ | |
 | OXM Oxford Industries, Inc. |
| Sector: Consumer Staples | |
| SubSector: Textile - Apparel Clothing | |
| MarketCap: 647.665 Millions | |
| Recent Price: 103.12 Smart Investing & Trading Score: 61 | |
| Day Percent Change: 0.68% Day Change: 0.70 | |
| Week Change: -1.84% Year-to-date Change: 3.1% | |
| OXM Links: Profile News Message Board | |
| Charts:- Daily , Weekly | |
| Add OXM to Watchlist: View: Get Complete OXM Trend Analysis ➞ | |
 | SNBR Sleep Number Corporation |
| Sector: Consumer Staples | |
| SubSector: Home Furnishings & Fixtures | |
| MarketCap: 692.735 Millions | |
| Recent Price: 13.27 Smart Investing & Trading Score: 46 | |
| Day Percent Change: 0.68% Day Change: 0.09 | |
| Week Change: 2.39% Year-to-date Change: -10.5% | |
| SNBR Links: Profile News Message Board | |
| Charts:- Daily , Weekly | |
| Add SNBR to Watchlist: View: Get Complete SNBR Trend Analysis ➞ | |
 | MLI Mueller Industries, Inc. |
| Sector: Industrials | |
| SubSector: Metal Fabrication | |
| MarketCap: 1259.5 Millions | |
| Recent Price: 52.32 Smart Investing & Trading Score: 68 | |
| Day Percent Change: 0.67% Day Change: 0.35 | |
| Week Change: 1.16% Year-to-date Change: 11.0% | |
| MLI Links: Profile News Message Board | |
| Charts:- Daily , Weekly | |
| Add MLI to Watchlist: View: Get Complete MLI Trend Analysis ➞ | |
 | IBOC International Bancshares Corporation |
| Sector: Financials | |
| SubSector: Regional - Southwest Banks | |
| MarketCap: 1159.45 Millions | |
| Recent Price: 52.53 Smart Investing & Trading Score: 48 | |
| Day Percent Change: 0.67% Day Change: 0.35 | |
| Week Change: 0.1% Year-to-date Change: -3.3% | |
| IBOC Links: Profile News Message Board | |
| Charts:- Daily , Weekly | |
| Add IBOC to Watchlist: View: Get Complete IBOC Trend Analysis ➞ | |
 | IIIN Insteel Industries, Inc. |
| Sector: Materials | |
| SubSector: Steel & Iron | |
| MarketCap: 269.488 Millions | |
| Recent Price: 32.97 Smart Investing & Trading Score: 17 | |
| Day Percent Change: 0.67% Day Change: 0.22 | |
| Week Change: -4.21% Year-to-date Change: -13.9% | |
| IIIN Links: Profile News Message Board | |
| Charts:- Daily , Weekly | |
| Add IIIN to Watchlist: View: Get Complete IIIN Trend Analysis ➞ | |
 | NECB Northeast Community Bancorp, Inc. |
| Sector: Financials | |
| SubSector: Savings & Loans | |
| MarketCap: 99.31 Millions | |
| Recent Price: 15.02 Smart Investing & Trading Score: 36 | |
| Day Percent Change: 0.67% Day Change: 0.10 | |
| Week Change: -0.2% Year-to-date Change: -15.3% | |
| NECB Links: Profile News Message Board | |
| Charts:- Daily , Weekly | |
| Add NECB to Watchlist: View: Get Complete NECB Trend Analysis ➞ | |
 | LOCO El Pollo Loco Holdings, Inc. |
| Sector: Services & Goods | |
| SubSector: Restaurants | |
| MarketCap: 296.97 Millions | |
| Recent Price: 8.32 Smart Investing & Trading Score: 10 | |
| Day Percent Change: 0.67% Day Change: 0.05 | |
| Week Change: -5.18% Year-to-date Change: -5.6% | |
| LOCO Links: Profile News Message Board | |
| Charts:- Daily , Weekly | |
| Add LOCO to Watchlist: View: Get Complete LOCO Trend Analysis ➞ | |
 | LCII LCI Industries |
| Sector: Consumer Staples | |
| SubSector: Recreational Vehicles | |
| MarketCap: 1663.59 Millions | |
| Recent Price: 104.19 Smart Investing & Trading Score: 10 | |
| Day Percent Change: 0.67% Day Change: 0.69 | |
| Week Change: -4.33% Year-to-date Change: -17.1% | |
| LCII Links: Profile News Message Board | |
| Charts:- Daily , Weekly | |
| Add LCII to Watchlist: View: Get Complete LCII Trend Analysis ➞ | |
| Too many stocks? View smallcap stocks filtered by marketcap & sector |
| Marketcap: All SmallCap Stocks (default-no microcap), Large, Mid-Range, Small & MicroCap |
| Sector: Tech, Finance, Energy, Staples, Retail, Industrial, Materials, Utilities & Medical |
|
Best Stocks Today 12Stocks.com |
© 2024 12Stocks.com Terms & Conditions Privacy Contact Us
All Information Provided Only For Education And Not To Be Used For Investing or Trading. See Terms & Conditions


One More Thing ... Get Best Stocks Delivered Daily!
Never Ever Miss A Move With Our Top Ten Stocks Lists
Find Best Stocks In Any Market - Bull or Bear Market
Take A Peek At Our Top Ten Stocks Lists: Daily, Weekly, Year-to-Date & Top Trends
Find Best Stocks In Any Market - Bull or Bear Market
Take A Peek At Our Top Ten Stocks Lists: Daily, Weekly, Year-to-Date & Top Trends
Smallcap Stocks With Best Up Trends [0-bearish to 100-bullish]: Badger Meter[100], Cullinan Oncology[100], Oscar Health[100], NextNav [100], Richardson Electronics[100], Seneca Foods[100], Lantheus [100], Macatawa Bank[100], Geron [100], IMAX [100], Regional Management[100]
Best Smallcap Stocks Year-to-Date:
Agenus [500.31%], CareMax [417.53%], Janux [348.12%], Viking [248.9%], Alpine Immune[238.5%], Super Micro[226.74%], Longboard [194.76%], Arcutis Bio[192.57%], Vera [161.3%], Avidity Biosciences[154.87%], Hippo [128.32%] Best Smallcap Stocks This Week:
Macatawa Bank[44.53%], 23andMe Holding[33.3%], ProKidney [32%], Snap One[29.73%], Vertex Energy[23.08%], ALX Oncology[20.64%], Vanda [20.63%], Expensify [18.37%], Badger Meter[16.72%], ContextLogic [15%], Cullinan Oncology[13.89%] Best Smallcap Stocks Daily:
23andMe Holding[65.91%], Vertex Energy[30.72%], Zura Bio[17.20%], Badger Meter[16.65%], ContextLogic [15.81%], Expensify [15.23%], Montrose Environmental[12.84%], Vaxxinity [10.05%], Vuzix [9.87%], Cipher Mining[8.65%], FiscalNote [8.61%]