
 Login Sign Up


| |||||
 |  | ||||

| 12Stocks.com Market Intelligence |
Best SmallCap Stocks
|
| In a hurry? Small Cap Stock Lists: Performance Trends Table, Stock Charts
Sort Small Cap stocks: Daily, Weekly, Year-to-Date, Market Cap & Trends. Filter Small Cap stocks list by sector: Show all, Tech, Finance, Energy, Staples, Retail, Industrial, Materials, Utilities and HealthCare Filter Small Cap stocks list by size: All Large Medium Small and MicroCap |
| 12Stocks.com Small Cap Stocks Performances & Trends Daily | |||||||||
|
|  The overall Smart Investing & Trading Score is 44 (0-bearish to 100-bullish) which puts Small Cap index in short term neutral trend. The Smart Investing & Trading Score from previous trading session is 13 and hence an improvement of trend.
| ||||||||
Here are the Smart Investing & Trading Scores of the most requested small cap stocks at 12Stocks.com (click stock name for detailed review):
|


| 12Stocks.com: Investing in Smallcap Index with Stocks | |
|
The following table helps investors and traders sort through current performance and trends (as measured by Smart Investing & Trading Score) of various
stocks in the Smallcap Index. Quick View: Move mouse or cursor over stock symbol (ticker) to view short-term technical chart and over stock name to view long term chart. Click on  to add stock symbol to your watchlist and to add stock symbol to your watchlist and  to view watchlist. Click on any ticker or stock name for detailed market intelligence report for that stock. to view watchlist. Click on any ticker or stock name for detailed market intelligence report for that stock. |
12Stocks.com Performance of Stocks in Smallcap Index
| Ticker | Stock Name | Watchlist | Category | Recent Price | Smart Investing & Trading Score | Change % | YTD Change% |
| ME | 23andMe Holding |   | Health Care | 0.59 | 69 | 65.91 | -33.72% |
| BMI | Badger Meter | | Technology | 176.91 | 100 | 15.63 | 14.60% |
| EXFY | Expensify | | Technology | 1.74 | 85 | 15.23 | -30.95% |
| ZURA | Zura Bio | | Health Care | 3.48 | 93 | 10.99 | -25.61% |
| VAXX | Vaxxinity | | Health Care | 0.46 | 25 | 10.05 | -45.24% |
| MEG | Montrose Environmental | | Industrials | 40.46 | 58 | 8.91 | 25.81% |
| CIFR | Cipher Mining | | Financials | 3.71 | 58 | 8.65 | -9.85% |
| NOTE | FiscalNote | | Technology | 1.33 | 68 | 8.61 | 13.25% |
| B | Barnes Group | | Industrials | 36.22 | 68 | 8.48 | 11.00% |
| DUOL | Duolingo | | Technology | 210.24 | 58 | 8.01 | -7.74% |
| BHIL | Benson Hill | | Materials | 0.18 | 25 | 6.91 | 4.78% |
| BIG | Big Lots | | Services & Goods | 3.66 | 52 | 6.71 | -53.02% |
| CGEM | Cullinan Oncology | | Health Care | 18.98 | 100 | 6.42 | 86.22% |
| OSCR | Oscar Health | | Health Care | 16.53 | 100 | 6.37 | 81.55% |
| AMPX | Amprius | | Industrials | 1.84 | 52 | 6.07 | -63.37% |
| APOG | Apogee Enterprises | | Industrials | 59.23 | 100 | 5.92 | 10.90% |
| LIND | Lindblad Expeditions | | Consumer Staples | 7.36 | 17 | 5.90 | -34.69% |
| JRVR | James River | | Financials | 9.23 | 59 | 5.85 | -0.11% |
| EHTH | eHealth | | Financials | 4.59 | 42 | 5.76 | -47.36% |
| SLQT | SelectQuote | | Financials | 1.76 | 63 | 5.69 | 28.83% |
| BLFS | BioLife Solutions | | Health Care | 15.98 | 15 | 5.58 | -1.63% |
| ACCD | Accolade | | Health Care | 9.19 | 42 | 5.57 | -23.59% |
| RDW | Redwire | | Industrials | 3.60 | 63 | 5.57 | 26.32% |
| CURV | Torrid | | Services & Goods | 4.61 | 47 | 5.49 | -21.20% |
| PIII | P3 Health | | Health Care | 0.53 | 42 | 5.46 | -64.36% |


| Too many stocks? View smallcap stocks filtered by marketcap & sector |
| Marketcap: All SmallCap Stocks (default-no microcap), Large, Mid-Range, Small |
| Smallcap Sector: Tech, Finance, Energy, Staples, Retail, Industrial, Materials, & Medical |
|
Get the most comprehensive stock market coverage daily at 12Stocks.com ➞ Best Stocks Today ➞ Best Stocks Weekly ➞ Best Stocks Year-to-Date ➞ Best Stocks Trends ➞  Best Stocks Today 12Stocks.com Best Nasdaq Stocks ➞ Best S&P 500 Stocks ➞ Best Tech Stocks ➞ Best Biotech Stocks ➞ |
| Detailed Overview of SmallCap Stocks |
| SmallCap Technical Overview, Leaders & Laggards, Top SmallCap ETF Funds & Detailed SmallCap Stocks List, Charts, Trends & More |
| Smallcap: Technical Analysis, Trends & YTD Performance | |
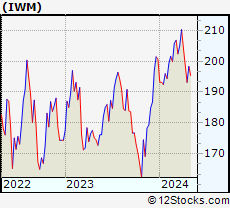
| SmallCap segment as represented by
IWM, an exchange-traded fund [ETF], holds basket of thousands of smallcap stocks from across all major sectors of the US stock market. The smallcap index (contains stocks like Riverbed & Sotheby's) is down by -3.99% and is currently underperforming the overall market by -8.02% year-to-date. Below is a quick view of technical charts and trends: | |
 IWM Weekly Chart |
|
| Long Term Trend: Good | |
| Medium Term Trend: Not Good | |
 IWM Daily Chart |
|
| Short Term Trend: Deteriorating | |
| Overall Trend Score: 44 | |
| YTD Performance: -3.99% | |
| **Trend Scores & Views Are Only For Educational Purposes And Not For Investing | |
| 12Stocks.com: Top Performing Small Cap Index Stocks | ||||||||||||||||||||||||||||||||||||||||||||||||
 The top performing Small Cap Index stocks year to date are
Now, more recently, over last week, the top performing Small Cap Index stocks on the move are


|
||||||||||||||||||||||||||||||||||||||||||||||||
| 12Stocks.com: Investing in Smallcap Index using Exchange Traded Funds | |
|
The following table shows list of key exchange traded funds (ETF) that
help investors track Smallcap index. The following list also includes leveraged ETF funds that track twice or thrice the daily returns of Smallcap indices. Short or inverse ETF funds move in the opposite direction to the index they track and are useful during market pullbacks or during bear markets. Quick View: Move mouse or cursor over ETF symbol (ticker) to view short-term technical chart and over ETF name to view long term chart. Click on ticker or stock name for detailed view. Click on to add stock symbol to your watchlist and to view watchlist. |
12Stocks.com List of ETFs that track Smallcap Index
| Ticker | ETF Name | Watchlist | Recent Price | Smart Investing & Trading Score | Change % | Week % | Year-to-date % |
| IWM | iShares Russell 2000 | | 192.71 | 44 | -0.15 | -3.01 | -3.99% |
| IJR | iShares Core S&P Small-Cap | | 102.18 | 38 | 0.05 | -2.23 | -5.61% |
| VTWO | Vanguard Russell 2000 ETF | | 77.90 | 23 | -0.19 | -3.01 | -3.95% |
| IWN | iShares Russell 2000 Value | | 146.15 | 10 | 0.08 | -2.81 | -5.91% |
| IWO | iShares Russell 2000 Growth | | 247.09 | 36 | -0.37 | -3.24 | -2.03% |
| IJS | iShares S&P Small-Cap 600 Value | | 94.40 | 10 | 0.30 | -1.84 | -8.41% |
| IJT | iShares S&P Small-Cap 600 Growth | | 122.58 | 23 | 0.61 | -1.76 | -2.05% |
| XSLV | PowerShares S&P SmallCap Low Volatil ETF | | 41.62 | 18 | 0.48 | -1.12 | -5.73% |
| SAA | ProShares Ultra SmallCap600 | | 21.71 | 10 | 0.25 | -3.75 | -12.97% |
| SMLV | SPDR SSGA US Small Cap Low Volatil ETF | | 104.02 | 18 | 0.34 | -0.95 | -7.56% |
| SBB | ProShares Short SmallCap600 | | 16.89 | 73 | 0.24 | 2.07 | 6.03% |
| SDD | ProShares UltraShort SmallCap600 | | 20.23 | 73 | -1.80 | 2.01 | 9.79% |
| 12Stocks.com: Charts, Trends, Fundamental Data and Performances of SmallCap Stocks | |
|
We now take in-depth look at all SmallCap stocks including charts, multi-period performances and overall trends (as measured by Smart Investing & Trading Score). One can sort SmallCap stocks (click link to choose) by Daily, Weekly and by Year-to-Date performances. Also, one can sort by size of the company or by market capitalization. |
| Select Your Default Chart Type: | |||||
| |||||
| Click on stock symbol or name for detailed view. Click on to add stock symbol to your watchlist and to view watchlist. Quick View: Move mouse or cursor over "Daily" to quickly view daily technical stock chart and over "Weekly" to view weekly technical stock chart. | |||||

 | ME 23andMe Holding Co. |
| Sector: Health Care | |
| SubSector: Diagnostics & Research | |
| MarketCap: 802 Millions | |
| Recent Price: 0.59 Smart Investing & Trading Score: 69 | |
| Day Percent Change: 65.91% Day Change: 0.23 | |
| Week Change: 33.3% Year-to-date Change: -33.7% | |
| ME Links: Profile News Message Board | |
| Charts:- Daily , Weekly | |
| Add ME to Watchlist: View: Get Complete ME Trend Analysis ➞ | |
 | BMI Badger Meter, Inc. |
| Sector: Technology | |
| SubSector: Scientific & Technical Instruments | |
| MarketCap: 1530.53 Millions | |
| Recent Price: 176.91 Smart Investing & Trading Score: 100 | |
| Day Percent Change: 15.63% Day Change: 23.91 | |
| Week Change: 15.7% Year-to-date Change: 14.6% | |
| BMI Links: Profile News Message Board | |
| Charts:- Daily , Weekly | |
| Add BMI to Watchlist: View: Get Complete BMI Trend Analysis ➞ | |
 | EXFY Expensify, Inc. |
| Sector: Technology | |
| SubSector: Software - Application | |
| MarketCap: 678 Millions | |
| Recent Price: 1.74 Smart Investing & Trading Score: 85 | |
| Day Percent Change: 15.23% Day Change: 0.23 | |
| Week Change: 18.37% Year-to-date Change: -31.0% | |
| EXFY Links: Profile News Message Board | |
| Charts:- Daily , Weekly | |
| Add EXFY to Watchlist: View: Get Complete EXFY Trend Analysis ➞ | |
 | ZURA Zura Bio Limited |
| Sector: Health Care | |
| SubSector: Biotechnology | |
| MarketCap: 242 Millions | |
| Recent Price: 3.48 Smart Investing & Trading Score: 93 | |
| Day Percent Change: 10.99% Day Change: 0.34 | |
| Week Change: 3.72% Year-to-date Change: -25.6% | |
| ZURA Links: Profile News Message Board | |
| Charts:- Daily , Weekly | |
| Add ZURA to Watchlist: View: Get Complete ZURA Trend Analysis ➞ | |
 | VAXX Vaxxinity, Inc. |
| Sector: Health Care | |
| SubSector: Biotechnology | |
| MarketCap: 320 Millions | |
| Recent Price: 0.46 Smart Investing & Trading Score: 25 | |
| Day Percent Change: 10.05% Day Change: 0.04 | |
| Week Change: -5.58% Year-to-date Change: -45.2% | |
| VAXX Links: Profile News Message Board | |
| Charts:- Daily , Weekly | |
| Add VAXX to Watchlist: View: Get Complete VAXX Trend Analysis ➞ | |
 | MEG Montrose Environmental Group, Inc. |
| Sector: Industrials | |
| SubSector: Waste Management | |
| MarketCap: 71627 Millions | |
| Recent Price: 40.46 Smart Investing & Trading Score: 58 | |
| Day Percent Change: 8.91% Day Change: 3.31 | |
| Week Change: -9.4% Year-to-date Change: 25.8% | |
| MEG Links: Profile News Message Board | |
| Charts:- Daily , Weekly | |
| Add MEG to Watchlist: View: Get Complete MEG Trend Analysis ➞ | |
 | CIFR Cipher Mining Inc. |
| Sector: Financials | |
| SubSector: Capital Markets | |
| MarketCap: 712 Millions | |
| Recent Price: 3.71 Smart Investing & Trading Score: 58 | |
| Day Percent Change: 8.65% Day Change: 0.29 | |
| Week Change: -3.14% Year-to-date Change: -9.9% | |
| CIFR Links: Profile News Message Board | |
| Charts:- Daily , Weekly | |
| Add CIFR to Watchlist: View: Get Complete CIFR Trend Analysis ➞ | |
 | NOTE FiscalNote Holdings, Inc. |
| Sector: Technology | |
| SubSector: Information Technology Services | |
| MarketCap: 493 Millions | |
| Recent Price: 1.33 Smart Investing & Trading Score: 68 | |
| Day Percent Change: 8.61% Day Change: 0.10 | |
| Week Change: 6.85% Year-to-date Change: 13.3% | |
| NOTE Links: Profile News Message Board | |
| Charts:- Daily , Weekly | |
| Add NOTE to Watchlist: View: Get Complete NOTE Trend Analysis ➞ | |
 | B Barnes Group Inc. |
| Sector: Industrials | |
| SubSector: Industrial Equipment & Components | |
| MarketCap: 2189.79 Millions | |
| Recent Price: 36.22 Smart Investing & Trading Score: 68 | |
| Day Percent Change: 8.48% Day Change: 2.83 | |
| Week Change: 3.19% Year-to-date Change: 11.0% | |
| B Links: Profile News Message Board | |
| Charts:- Daily , Weekly | |
| Add B to Watchlist: View: Get Complete B Trend Analysis ➞ | |
 | DUOL Duolingo, Inc. |
| Sector: Technology | |
| SubSector: Software - Application | |
| MarketCap: 6070 Millions | |
| Recent Price: 210.24 Smart Investing & Trading Score: 58 | |
| Day Percent Change: 8.01% Day Change: 15.60 | |
| Week Change: -0.38% Year-to-date Change: -7.7% | |
| DUOL Links: Profile News Message Board | |
| Charts:- Daily , Weekly | |
| Add DUOL to Watchlist: View: Get Complete DUOL Trend Analysis ➞ | |
 | BHIL Benson Hill, Inc. |
| Sector: Materials | |
| SubSector: Agricultural Inputs | |
| MarketCap: 236 Millions | |
| Recent Price: 0.18 Smart Investing & Trading Score: 25 | |
| Day Percent Change: 6.91% Day Change: 0.01 | |
| Week Change: 3.08% Year-to-date Change: 4.8% | |
| BHIL Links: Profile News Message Board | |
| Charts:- Daily , Weekly | |
| Add BHIL to Watchlist: View: Get Complete BHIL Trend Analysis ➞ | |
 | BIG Big Lots, Inc. |
| Sector: Services & Goods | |
| SubSector: Discount, Variety Stores | |
| MarketCap: 603.572 Millions | |
| Recent Price: 3.66 Smart Investing & Trading Score: 52 | |
| Day Percent Change: 6.71% Day Change: 0.23 | |
| Week Change: 6.09% Year-to-date Change: -53.0% | |
| BIG Links: Profile News Message Board | |
| Charts:- Daily , Weekly | |
| Add BIG to Watchlist: View: Get Complete BIG Trend Analysis ➞ | |
 | CGEM Cullinan Oncology, Inc. |
| Sector: Health Care | |
| SubSector: Biotechnology | |
| MarketCap: 433 Millions | |
| Recent Price: 18.98 Smart Investing & Trading Score: 100 | |
| Day Percent Change: 6.42% Day Change: 1.14 | |
| Week Change: 13.89% Year-to-date Change: 86.2% | |
| CGEM Links: Profile News Message Board | |
| Charts:- Daily , Weekly | |
| Add CGEM to Watchlist: View: Get Complete CGEM Trend Analysis ➞ | |
 | OSCR Oscar Health, Inc. |
| Sector: Health Care | |
| SubSector: Healthcare Plans | |
| MarketCap: 1790 Millions | |
| Recent Price: 16.53 Smart Investing & Trading Score: 100 | |
| Day Percent Change: 6.37% Day Change: 0.99 | |
| Week Change: 12.14% Year-to-date Change: 81.6% | |
| OSCR Links: Profile News Message Board | |
| Charts:- Daily , Weekly | |
| Add OSCR to Watchlist: View: Get Complete OSCR Trend Analysis ➞ | |
 | AMPX Amprius Technologies, Inc. |
| Sector: Industrials | |
| SubSector: Electrical Equipment & Parts | |
| MarketCap: 608 Millions | |
| Recent Price: 1.84 Smart Investing & Trading Score: 52 | |
| Day Percent Change: 6.07% Day Change: 0.10 | |
| Week Change: -2.39% Year-to-date Change: -63.4% | |
| AMPX Links: Profile News Message Board | |
| Charts:- Daily , Weekly | |
| Add AMPX to Watchlist: View: Get Complete AMPX Trend Analysis ➞ | |
 | APOG Apogee Enterprises, Inc. |
| Sector: Industrials | |
| SubSector: General Building Materials | |
| MarketCap: 510.653 Millions | |
| Recent Price: 59.23 Smart Investing & Trading Score: 100 | |
| Day Percent Change: 5.92% Day Change: 3.31 | |
| Week Change: 3.93% Year-to-date Change: 10.9% | |
| APOG Links: Profile News Message Board | |
| Charts:- Daily , Weekly | |
| Add APOG to Watchlist: View: Get Complete APOG Trend Analysis ➞ | |
 | LIND Lindblad Expeditions Holdings, Inc. |
| Sector: Consumer Staples | |
| SubSector: Recreational Goods, Other | |
| MarketCap: 220.259 Millions | |
| Recent Price: 7.36 Smart Investing & Trading Score: 17 | |
| Day Percent Change: 5.90% Day Change: 0.41 | |
| Week Change: -5.64% Year-to-date Change: -34.7% | |
| LIND Links: Profile News Message Board | |
| Charts:- Daily , Weekly | |
| Add LIND to Watchlist: View: Get Complete LIND Trend Analysis ➞ | |
 | JRVR James River Group Holdings, Ltd. |
| Sector: Financials | |
| SubSector: Property & Casualty Insurance | |
| MarketCap: 978.312 Millions | |
| Recent Price: 9.23 Smart Investing & Trading Score: 59 | |
| Day Percent Change: 5.85% Day Change: 0.51 | |
| Week Change: 9.1% Year-to-date Change: -0.1% | |
| JRVR Links: Profile News Message Board | |
| Charts:- Daily , Weekly | |
| Add JRVR to Watchlist: View: Get Complete JRVR Trend Analysis ➞ | |
 | EHTH eHealth, Inc. |
| Sector: Financials | |
| SubSector: Insurance Brokers | |
| MarketCap: 2813.57 Millions | |
| Recent Price: 4.59 Smart Investing & Trading Score: 42 | |
| Day Percent Change: 5.76% Day Change: 0.25 | |
| Week Change: -5.75% Year-to-date Change: -47.4% | |
| EHTH Links: Profile News Message Board | |
| Charts:- Daily , Weekly | |
| Add EHTH to Watchlist: View: Get Complete EHTH Trend Analysis ➞ | |
 | SLQT SelectQuote, Inc. |
| Sector: Financials | |
| SubSector: Insurance Brokers | |
| MarketCap: 38257 Millions | |
| Recent Price: 1.76 Smart Investing & Trading Score: 63 | |
| Day Percent Change: 5.69% Day Change: 0.09 | |
| Week Change: 3.22% Year-to-date Change: 28.8% | |
| SLQT Links: Profile News Message Board | |
| Charts:- Daily , Weekly | |
| Add SLQT to Watchlist: View: Get Complete SLQT Trend Analysis ➞ | |
 | BLFS BioLife Solutions, Inc. |
| Sector: Health Care | |
| SubSector: Medical Instruments & Supplies | |
| MarketCap: 264.36 Millions | |
| Recent Price: 15.98 Smart Investing & Trading Score: 15 | |
| Day Percent Change: 5.58% Day Change: 0.84 | |
| Week Change: -3.12% Year-to-date Change: -1.6% | |
| BLFS Links: Profile News Message Board | |
| Charts:- Daily , Weekly | |
| Add BLFS to Watchlist: View: Get Complete BLFS Trend Analysis ➞ | |
 | ACCD Accolade, Inc. |
| Sector: Health Care | |
| SubSector: Health Information Services | |
| MarketCap: 32987 Millions | |
| Recent Price: 9.19 Smart Investing & Trading Score: 42 | |
| Day Percent Change: 5.57% Day Change: 0.49 | |
| Week Change: 11.33% Year-to-date Change: -23.6% | |
| ACCD Links: Profile News Message Board | |
| Charts:- Daily , Weekly | |
| Add ACCD to Watchlist: View: Get Complete ACCD Trend Analysis ➞ | |
 | RDW Redwire Corporation |
| Sector: Industrials | |
| SubSector: Aerospace & Defense | |
| MarketCap: 160 Millions | |
| Recent Price: 3.60 Smart Investing & Trading Score: 63 | |
| Day Percent Change: 5.57% Day Change: 0.19 | |
| Week Change: -6.74% Year-to-date Change: 26.3% | |
| RDW Links: Profile News Message Board | |
| Charts:- Daily , Weekly | |
| Add RDW to Watchlist: View: Get Complete RDW Trend Analysis ➞ | |
 | CURV Torrid Holdings Inc. |
| Sector: Services & Goods | |
| SubSector: Apparel Retail | |
| MarketCap: 278 Millions | |
| Recent Price: 4.61 Smart Investing & Trading Score: 47 | |
| Day Percent Change: 5.49% Day Change: 0.24 | |
| Week Change: 3.36% Year-to-date Change: -21.2% | |
| CURV Links: Profile News Message Board | |
| Charts:- Daily , Weekly | |
| Add CURV to Watchlist: View: Get Complete CURV Trend Analysis ➞ | |
 | PIII P3 Health Partners Inc. |
| Sector: Health Care | |
| SubSector: Medical Care Facilities | |
| MarketCap: 944 Millions | |
| Recent Price: 0.53 Smart Investing & Trading Score: 42 | |
| Day Percent Change: 5.46% Day Change: 0.03 | |
| Week Change: -9.78% Year-to-date Change: -64.4% | |
| PIII Links: Profile News Message Board | |
| Charts:- Daily , Weekly | |
| Add PIII to Watchlist: View: Get Complete PIII Trend Analysis ➞ | |
| Too many stocks? View smallcap stocks filtered by marketcap & sector |
| Marketcap: All SmallCap Stocks (default-no microcap), Large, Mid-Range, Small & MicroCap |
| Sector: Tech, Finance, Energy, Staples, Retail, Industrial, Materials, Utilities & Medical |
|
Best Stocks Today 12Stocks.com |
© 2024 12Stocks.com Terms & Conditions Privacy Contact Us
All Information Provided Only For Education And Not To Be Used For Investing or Trading. See Terms & Conditions


One More Thing ... Get Best Stocks Delivered Daily!
Never Ever Miss A Move With Our Top Ten Stocks Lists
Find Best Stocks In Any Market - Bull or Bear Market
Take A Peek At Our Top Ten Stocks Lists: Daily, Weekly, Year-to-Date & Top Trends
Find Best Stocks In Any Market - Bull or Bear Market
Take A Peek At Our Top Ten Stocks Lists: Daily, Weekly, Year-to-Date & Top Trends
Smallcap Stocks With Best Up Trends [0-bearish to 100-bullish]: Badger Meter[100], Cullinan Oncology[100], Oscar Health[100], Apogee Enterprises[100], NextNav [100], Geron [100], Richardson Electronics[100], Seneca Foods[100], Lantheus [100], Macatawa Bank[100], Regional Management[100]
Best Smallcap Stocks Year-to-Date:
Agenus [511.18%], CareMax [417.53%], Janux [348.12%], Viking [248.9%], Alpine Immune[238.6%], Super Micro[230.42%], Arcutis Bio[203.72%], Longboard [184.12%], Vera [161.3%], Avidity Biosciences[159.18%], Hippo [128.32%] Best Smallcap Stocks This Week:
Macatawa Bank[44.47%], 23andMe Holding[33.3%], ProKidney [32%], Snap One[29.73%], Vertex Energy[23.08%], ALX Oncology[22.79%], Vanda [20.63%], Expensify [18.37%], Badger Meter[15.7%], Cullinan Oncology[13.89%], Humacyte [12.67%] Best Smallcap Stocks Daily:
23andMe Holding[65.91%], Vertex Energy[30.72%], Badger Meter[15.63%], Expensify [15.23%], Zura Bio[10.99%], Vaxxinity [10.05%], Vuzix [9.87%], Montrose Environmental[8.91%], Cipher Mining[8.65%], FiscalNote [8.61%], Barnes Group[8.48%]