
 Login Sign Up


| |||||
 |  | ||||

| 12Stocks.com Market Intelligence |
Best SmallCap Stocks
|
| In a hurry? Small Cap Stock Lists: Performance Trends Table, Stock Charts
Sort Small Cap stocks: Daily, Weekly, Year-to-Date, Market Cap & Trends. Filter Small Cap stocks list by sector: Show all, Tech, Finance, Energy, Staples, Retail, Industrial, Materials, Utilities and HealthCare Filter Small Cap stocks list by size: All Large Medium Small and MicroCap |
| 12Stocks.com Small Cap Stocks Performances & Trends Daily | |||||||||
|
|  The overall Smart Investing & Trading Score is 23 (0-bearish to 100-bullish) which puts Small Cap index in short term bearish to neutral trend. The Smart Investing & Trading Score from previous trading session is 13 and an improvement of trend continues.
| ||||||||
Here are the Smart Investing & Trading Scores of the most requested small cap stocks at 12Stocks.com (click stock name for detailed review):
|


| 12Stocks.com: Investing in Smallcap Index with Stocks | |
|
The following table helps investors and traders sort through current performance and trends (as measured by Smart Investing & Trading Score) of various
stocks in the Smallcap Index. Quick View: Move mouse or cursor over stock symbol (ticker) to view short-term technical chart and over stock name to view long term chart. Click on  to add stock symbol to your watchlist and to add stock symbol to your watchlist and  to view watchlist. Click on any ticker or stock name for detailed market intelligence report for that stock. to view watchlist. Click on any ticker or stock name for detailed market intelligence report for that stock. |
12Stocks.com Performance of Stocks in Smallcap Index
| Ticker | Stock Name | Watchlist | Category | Recent Price | Smart Investing & Trading Score | Change % | YTD Change% |
| PLUS | ePlus |   | Technology | 75.37 | 13 | 0.12 | -5.60% |
| IMAX | IMAX | | Services & Goods | 17.13 | 88 | 0.12 | 14.05% |
| HLLY | Holley | | Services & Goods | 4.18 | 37 | 0.12 | -15.81% |
| PTLO | Portillos | | Services & Goods | 12.11 | 17 | 0.12 | -24.55% |
| AMWD | American Woodmark | | Consumer Staples | 90.20 | 10 | 0.11 | -2.85% |
| MAX | MediaAlpha | | Technology | 18.58 | 48 | 0.11 | 67.09% |
| EVCM | EverCommerce | | Technology | 8.83 | 42 | 0.11 | -20.63% |
| ALIT | Alight | | Technology | 9.12 | 63 | 0.11 | 7.17% |
| SM | SM Energy | | Energy | 48.09 | 36 | 0.10 | 24.20% |
| BLX | Banco Latinoamericano | | Financials | 29.59 | 63 | 0.10 | 19.60% |
| CEIX | CONSOL Energy | | Materials | 84.08 | 32 | 0.10 | -16.36% |
| PCVX | Vaxcyte | | Health Care | 60.71 | 10 | 0.10 | -3.28% |
| TH | Target Hospitality | | Industrials | 10.89 | 86 | 0.09 | 11.92% |
| PLXS | Plexus | | Technology | 93.24 | 20 | 0.06 | -13.77% |
| NWLI | National Western | | Financials | 487.51 | 41 | 0.06 | 0.93% |
| MMI | Marcus & Millichap | | Financials | 31.02 | 7 | 0.06 | -28.98% |
| AVNS | Avanos Medical | | Health Care | 18.71 | 35 | 0.05 | -16.58% |
| VTS | Vitesse Energy | | Energy | 23.00 | 43 | 0.04 | 3.88% |
| AGYS | Agilysys | | Technology | 81.78 | 28 | 0.04 | -3.58% |
| BLMN | Bloomin | | Services & Goods | 27.04 | 36 | 0.04 | -3.94% |
| ADUS | Addus HomeCare | | Health Care | 97.19 | 61 | 0.03 | 4.67% |
| MDC | M.D.C | | Industrials | 62.98 | 57 | 0.00 | 13.99% |
| JBLU | JetBlue Airways | | Transports | 7.11 | 68 | 0.00 | 28.11% |
| STRA | Strategic Education | | Services & Goods | 98.11 | 51 | 0.00 | 6.21% |
| KAMN | Kaman | | Industrials | 45.99 | 70 | 0.00 | 92.03% |


| Too many stocks? View smallcap stocks filtered by marketcap & sector |
| Marketcap: All SmallCap Stocks (default-no microcap), Large, Mid-Range, Small |
| Smallcap Sector: Tech, Finance, Energy, Staples, Retail, Industrial, Materials, & Medical |
|
Get the most comprehensive stock market coverage daily at 12Stocks.com ➞ Best Stocks Today ➞ Best Stocks Weekly ➞ Best Stocks Year-to-Date ➞ Best Stocks Trends ➞  Best Stocks Today 12Stocks.com Best Nasdaq Stocks ➞ Best S&P 500 Stocks ➞ Best Tech Stocks ➞ Best Biotech Stocks ➞ |
| Detailed Overview of SmallCap Stocks |
| SmallCap Technical Overview, Leaders & Laggards, Top SmallCap ETF Funds & Detailed SmallCap Stocks List, Charts, Trends & More |
| Smallcap: Technical Analysis, Trends & YTD Performance | |
| SmallCap segment as represented by
IWM, an exchange-traded fund [ETF], holds basket of thousands of smallcap stocks from across all major sectors of the US stock market. The smallcap index (contains stocks like Riverbed & Sotheby's) is down by -3.77% and is currently underperforming the overall market by -7.15% year-to-date. Below is a quick view of technical charts and trends: | |
 IWM Weekly Chart |
|
| Long Term Trend: Good | |
| Medium Term Trend: Not Good | |
 IWM Daily Chart |
|
| Short Term Trend: Deteriorating | |
| Overall Trend Score: 23 | |
| YTD Performance: -3.77% | |
| **Trend Scores & Views Are Only For Educational Purposes And Not For Investing | |
| 12Stocks.com: Top Performing Small Cap Index Stocks | ||||||||||||||||||||||||||||||||||||||||||||||||
 The top performing Small Cap Index stocks year to date are
Now, more recently, over last week, the top performing Small Cap Index stocks on the move are


|
||||||||||||||||||||||||||||||||||||||||||||||||
| 12Stocks.com: Investing in Smallcap Index using Exchange Traded Funds | |
|
The following table shows list of key exchange traded funds (ETF) that
help investors track Smallcap index. The following list also includes leveraged ETF funds that track twice or thrice the daily returns of Smallcap indices. Short or inverse ETF funds move in the opposite direction to the index they track and are useful during market pullbacks or during bear markets. Quick View: Move mouse or cursor over ETF symbol (ticker) to view short-term technical chart and over ETF name to view long term chart. Click on ticker or stock name for detailed view. Click on to add stock symbol to your watchlist and to view watchlist. |
12Stocks.com List of ETFs that track Smallcap Index
| Ticker | ETF Name | Watchlist | Recent Price | Smart Investing & Trading Score | Change % | Week % | Year-to-date % |
| IWM | iShares Russell 2000 | | 193.14 | 23 | 0.16 | -2.79 | -3.77% |
| IJR | iShares Core S&P Small-Cap | | 103.22 | 31 | 0.86 | -1.23 | -4.65% |
| IWN | iShares Russell 2000 Value | | 147.78 | 31 | 0.99 | -1.73 | -4.86% |
| VTWO | Vanguard Russell 2000 ETF | | 78.08 | 23 | 0.17 | -2.79 | -3.72% |
| IWO | iShares Russell 2000 Growth | | 245.29 | 23 | -0.67 | -3.94 | -2.75% |
| IJS | iShares S&P Small-Cap 600 Value | | 95.61 | 32 | 1.16 | -0.58 | -7.24% |
| IJT | iShares S&P Small-Cap 600 Growth | | 122.21 | 31 | 0.53 | -2.06 | -2.34% |
| XSLV | PowerShares S&P SmallCap Low Volatil ETF | | 42.18 | 42 | 1.27 | 0.21 | -4.46% |
| SAA | ProShares Ultra SmallCap600 | | 21.80 | 18 | 0.83 | -3.37 | -12.63% |
| SMLV | SPDR SSGA US Small Cap Low Volatil ETF | | 106.09 | 37 | 2.18 | 1.03 | -5.71% |
| SDD | ProShares UltraShort SmallCap600 | | 20.34 | 76 | -1.69 | 2.57 | 10.38% |
| SBB | ProShares Short SmallCap600 | | 16.84 | 76 | -0.82 | 1.77 | 5.71% |
| 12Stocks.com: Charts, Trends, Fundamental Data and Performances of SmallCap Stocks | |
|
We now take in-depth look at all SmallCap stocks including charts, multi-period performances and overall trends (as measured by Smart Investing & Trading Score). One can sort SmallCap stocks (click link to choose) by Daily, Weekly and by Year-to-Date performances. Also, one can sort by size of the company or by market capitalization. |
| Select Your Default Chart Type: | |||||
| |||||
| Click on stock symbol or name for detailed view. Click on to add stock symbol to your watchlist and to view watchlist. Quick View: Move mouse or cursor over "Daily" to quickly view daily technical stock chart and over "Weekly" to view weekly technical stock chart. | |||||

 | PLUS ePlus inc. |
| Sector: Technology | |
| SubSector: Application Software | |
| MarketCap: 728.262 Millions | |
| Recent Price: 75.37 Smart Investing & Trading Score: 13 | |
| Day Percent Change: 0.12% Day Change: 0.09 | |
| Week Change: -2.21% Year-to-date Change: -5.6% | |
| PLUS Links: Profile News Message Board | |
| Charts:- Daily , Weekly | |
| Add PLUS to Watchlist: View: Get Complete PLUS Trend Analysis ➞ | |
 | IMAX IMAX Corporation |
| Sector: Services & Goods | |
| SubSector: Entertainment - Diversified | |
| MarketCap: 874.237 Millions | |
| Recent Price: 17.13 Smart Investing & Trading Score: 88 | |
| Day Percent Change: 0.12% Day Change: 0.02 | |
| Week Change: 4.26% Year-to-date Change: 14.1% | |
| IMAX Links: Profile News Message Board | |
| Charts:- Daily , Weekly | |
| Add IMAX to Watchlist: View: Get Complete IMAX Trend Analysis ➞ | |
 | HLLY Holley Inc. |
| Sector: Services & Goods | |
| SubSector: Auto Parts | |
| MarketCap: 469 Millions | |
| Recent Price: 4.18 Smart Investing & Trading Score: 37 | |
| Day Percent Change: 0.12% Day Change: 0.00 | |
| Week Change: -0.71% Year-to-date Change: -15.8% | |
| HLLY Links: Profile News Message Board | |
| Charts:- Daily , Weekly | |
| Add HLLY to Watchlist: View: Get Complete HLLY Trend Analysis ➞ | |
 | PTLO Portillos Inc. |
| Sector: Services & Goods | |
| SubSector: Restaurants | |
| MarketCap: 1590 Millions | |
| Recent Price: 12.11 Smart Investing & Trading Score: 17 | |
| Day Percent Change: 0.12% Day Change: 0.01 | |
| Week Change: -6.27% Year-to-date Change: -24.6% | |
| PTLO Links: Profile News Message Board | |
| Charts:- Daily , Weekly | |
| Add PTLO to Watchlist: View: Get Complete PTLO Trend Analysis ➞ | |
 | AMWD American Woodmark Corporation |
| Sector: Consumer Staples | |
| SubSector: Home Furnishings & Fixtures | |
| MarketCap: 958.435 Millions | |
| Recent Price: 90.20 Smart Investing & Trading Score: 10 | |
| Day Percent Change: 0.11% Day Change: 0.10 | |
| Week Change: -6.06% Year-to-date Change: -2.9% | |
| AMWD Links: Profile News Message Board | |
| Charts:- Daily , Weekly | |
| Add AMWD to Watchlist: View: Get Complete AMWD Trend Analysis ➞ | |
 | MAX MediaAlpha, Inc. |
| Sector: Technology | |
| SubSector: Internet Content & Information | |
| MarketCap: 22537 Millions | |
| Recent Price: 18.58 Smart Investing & Trading Score: 48 | |
| Day Percent Change: 0.11% Day Change: 0.02 | |
| Week Change: -7.38% Year-to-date Change: 67.1% | |
| MAX Links: Profile News Message Board | |
| Charts:- Daily , Weekly | |
| Add MAX to Watchlist: View: Get Complete MAX Trend Analysis ➞ | |
 | EVCM EverCommerce Inc. |
| Sector: Technology | |
| SubSector: Software - Infrastructure | |
| MarketCap: 2210 Millions | |
| Recent Price: 8.83 Smart Investing & Trading Score: 42 | |
| Day Percent Change: 0.11% Day Change: 0.01 | |
| Week Change: -1.34% Year-to-date Change: -20.6% | |
| EVCM Links: Profile News Message Board | |
| Charts:- Daily , Weekly | |
| Add EVCM to Watchlist: View: Get Complete EVCM Trend Analysis ➞ | |
 | ALIT Alight, Inc. |
| Sector: Technology | |
| SubSector: Software - Application | |
| MarketCap: 5130 Millions | |
| Recent Price: 9.12 Smart Investing & Trading Score: 63 | |
| Day Percent Change: 0.11% Day Change: 0.01 | |
| Week Change: -1.08% Year-to-date Change: 7.2% | |
| ALIT Links: Profile News Message Board | |
| Charts:- Daily , Weekly | |
| Add ALIT to Watchlist: View: Get Complete ALIT Trend Analysis ➞ | |
 | SM SM Energy Company |
| Sector: Energy | |
| SubSector: Independent Oil & Gas | |
| MarketCap: 137.593 Millions | |
| Recent Price: 48.09 Smart Investing & Trading Score: 36 | |
| Day Percent Change: 0.10% Day Change: 0.05 | |
| Week Change: -5.2% Year-to-date Change: 24.2% | |
| SM Links: Profile News Message Board | |
| Charts:- Daily , Weekly | |
| Add SM to Watchlist: View: Get Complete SM Trend Analysis ➞ | |
 | BLX Banco Latinoamericano de Comercio Exterior, S.A |
| Sector: Financials | |
| SubSector: Foreign Money Center Banks | |
| MarketCap: 390.471 Millions | |
| Recent Price: 29.59 Smart Investing & Trading Score: 63 | |
| Day Percent Change: 0.10% Day Change: 0.03 | |
| Week Change: 0.58% Year-to-date Change: 19.6% | |
| BLX Links: Profile News Message Board | |
| Charts:- Daily , Weekly | |
| Add BLX to Watchlist: View: Get Complete BLX Trend Analysis ➞ | |
 | CEIX CONSOL Energy Inc. |
| Sector: Materials | |
| SubSector: Industrial Metals & Minerals | |
| MarketCap: 196.81 Millions | |
| Recent Price: 84.08 Smart Investing & Trading Score: 32 | |
| Day Percent Change: 0.10% Day Change: 0.08 | |
| Week Change: 0.56% Year-to-date Change: -16.4% | |
| CEIX Links: Profile News Message Board | |
| Charts:- Daily , Weekly | |
| Add CEIX to Watchlist: View: Get Complete CEIX Trend Analysis ➞ | |
 | PCVX Vaxcyte, Inc. |
| Sector: Health Care | |
| SubSector: Biotechnology | |
| MarketCap: 13887 Millions | |
| Recent Price: 60.71 Smart Investing & Trading Score: 10 | |
| Day Percent Change: 0.10% Day Change: 0.06 | |
| Week Change: -1.89% Year-to-date Change: -3.3% | |
| PCVX Links: Profile News Message Board | |
| Charts:- Daily , Weekly | |
| Add PCVX to Watchlist: View: Get Complete PCVX Trend Analysis ➞ | |
 | TH Target Hospitality Corp. |
| Sector: Industrials | |
| SubSector: Conglomerates | |
| MarketCap: 218.048 Millions | |
| Recent Price: 10.89 Smart Investing & Trading Score: 86 | |
| Day Percent Change: 0.09% Day Change: 0.01 | |
| Week Change: 1.68% Year-to-date Change: 11.9% | |
| TH Links: Profile News Message Board | |
| Charts:- Daily , Weekly | |
| Add TH to Watchlist: View: Get Complete TH Trend Analysis ➞ | |
 | PLXS Plexus Corp. |
| Sector: Technology | |
| SubSector: Printed Circuit Boards | |
| MarketCap: 1457.15 Millions | |
| Recent Price: 93.24 Smart Investing & Trading Score: 20 | |
| Day Percent Change: 0.06% Day Change: 0.06 | |
| Week Change: -2.46% Year-to-date Change: -13.8% | |
| PLXS Links: Profile News Message Board | |
| Charts:- Daily , Weekly | |
| Add PLXS to Watchlist: View: Get Complete PLXS Trend Analysis ➞ | |
 | NWLI National Western Life Group, Inc. |
| Sector: Financials | |
| SubSector: Life Insurance | |
| MarketCap: 529 Millions | |
| Recent Price: 487.51 Smart Investing & Trading Score: 41 | |
| Day Percent Change: 0.06% Day Change: 0.30 | |
| Week Change: -0.71% Year-to-date Change: 0.9% | |
| NWLI Links: Profile News Message Board | |
| Charts:- Daily , Weekly | |
| Add NWLI to Watchlist: View: Get Complete NWLI Trend Analysis ➞ | |
 | MMI Marcus & Millichap, Inc. |
| Sector: Financials | |
| SubSector: Real Estate Development | |
| MarketCap: 1005.19 Millions | |
| Recent Price: 31.02 Smart Investing & Trading Score: 7 | |
| Day Percent Change: 0.06% Day Change: 0.02 | |
| Week Change: -4.11% Year-to-date Change: -29.0% | |
| MMI Links: Profile News Message Board | |
| Charts:- Daily , Weekly | |
| Add MMI to Watchlist: View: Get Complete MMI Trend Analysis ➞ | |
 | AVNS Avanos Medical, Inc. |
| Sector: Health Care | |
| SubSector: Medical Instruments & Supplies | |
| MarketCap: 1229.6 Millions | |
| Recent Price: 18.71 Smart Investing & Trading Score: 35 | |
| Day Percent Change: 0.05% Day Change: 0.01 | |
| Week Change: 1.08% Year-to-date Change: -16.6% | |
| AVNS Links: Profile News Message Board | |
| Charts:- Daily , Weekly | |
| Add AVNS to Watchlist: View: Get Complete AVNS Trend Analysis ➞ | |
 | VTS Vitesse Energy, Inc. |
| Sector: Energy | |
| SubSector: Oil & Gas E&P | |
| MarketCap: 639 Millions | |
| Recent Price: 23.00 Smart Investing & Trading Score: 43 | |
| Day Percent Change: 0.04% Day Change: 0.01 | |
| Week Change: -1.63% Year-to-date Change: 3.9% | |
| VTS Links: Profile News Message Board | |
| Charts:- Daily , Weekly | |
| Add VTS to Watchlist: View: Get Complete VTS Trend Analysis ➞ | |
 | AGYS Agilysys, Inc. |
| Sector: Technology | |
| SubSector: Application Software | |
| MarketCap: 391.862 Millions | |
| Recent Price: 81.78 Smart Investing & Trading Score: 28 | |
| Day Percent Change: 0.04% Day Change: 0.03 | |
| Week Change: -0.74% Year-to-date Change: -3.6% | |
| AGYS Links: Profile News Message Board | |
| Charts:- Daily , Weekly | |
| Add AGYS to Watchlist: View: Get Complete AGYS Trend Analysis ➞ | |
 | BLMN Bloomin Brands, Inc. |
| Sector: Services & Goods | |
| SubSector: Restaurants | |
| MarketCap: 503.47 Millions | |
| Recent Price: 27.04 Smart Investing & Trading Score: 36 | |
| Day Percent Change: 0.04% Day Change: 0.01 | |
| Week Change: 2% Year-to-date Change: -3.9% | |
| BLMN Links: Profile News Message Board | |
| Charts:- Daily , Weekly | |
| Add BLMN to Watchlist: View: Get Complete BLMN Trend Analysis ➞ | |
 | ADUS Addus HomeCare Corporation |
| Sector: Health Care | |
| SubSector: Home Health Care | |
| MarketCap: 994.795 Millions | |
| Recent Price: 97.19 Smart Investing & Trading Score: 61 | |
| Day Percent Change: 0.03% Day Change: 0.03 | |
| Week Change: -0.67% Year-to-date Change: 4.7% | |
| ADUS Links: Profile News Message Board | |
| Charts:- Daily , Weekly | |
| Add ADUS to Watchlist: View: Get Complete ADUS Trend Analysis ➞ | |
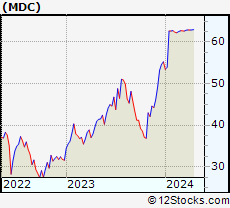 | MDC M.D.C. Holdings, Inc. |
| Sector: Industrials | |
| SubSector: Residential Construction | |
| MarketCap: 1606.26 Millions | |
| Recent Price: 62.98 Smart Investing & Trading Score: 57 | |
| Day Percent Change: 0.00% Day Change: 0.00 | |
| Week Change: 0.11% Year-to-date Change: 14.0% | |
| MDC Links: Profile News Message Board | |
| Charts:- Daily , Weekly | |
| Add MDC to Watchlist: View: Get Complete MDC Trend Analysis ➞ | |
 | JBLU JetBlue Airways Corporation |
| Sector: Transports | |
| SubSector: Regional Airlines | |
| MarketCap: 2383.1 Millions | |
| Recent Price: 7.11 Smart Investing & Trading Score: 68 | |
| Day Percent Change: 0.00% Day Change: 0.00 | |
| Week Change: 5.33% Year-to-date Change: 28.1% | |
| JBLU Links: Profile News Message Board | |
| Charts:- Daily , Weekly | |
| Add JBLU to Watchlist: View: Get Complete JBLU Trend Analysis ➞ | |
 | STRA Strategic Education, Inc. |
| Sector: Services & Goods | |
| SubSector: Education & Training Services | |
| MarketCap: 2621.56 Millions | |
| Recent Price: 98.11 Smart Investing & Trading Score: 51 | |
| Day Percent Change: 0.00% Day Change: 0.00 | |
| Week Change: -0.35% Year-to-date Change: 6.2% | |
| STRA Links: Profile News Message Board | |
| Charts:- Daily , Weekly | |
| Add STRA to Watchlist: View: Get Complete STRA Trend Analysis ➞ | |
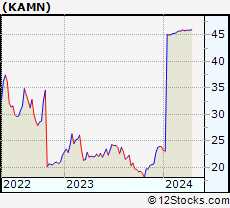 | KAMN Kaman Corporation |
| Sector: Industrials | |
| SubSector: Aerospace/Defense Products & Services | |
| MarketCap: 1154.01 Millions | |
| Recent Price: 45.99 Smart Investing & Trading Score: 70 | |
| Day Percent Change: 0.00% Day Change: 0.00 | |
| Week Change: 0.26% Year-to-date Change: 92.0% | |
| KAMN Links: Profile News Message Board | |
| Charts:- Daily , Weekly | |
| Add KAMN to Watchlist: View: Get Complete KAMN Trend Analysis ➞ | |
| Too many stocks? View smallcap stocks filtered by marketcap & sector |
| Marketcap: All SmallCap Stocks (default-no microcap), Large, Mid-Range, Small & MicroCap |
| Sector: Tech, Finance, Energy, Staples, Retail, Industrial, Materials, Utilities & Medical |
|
Best Stocks Today 12Stocks.com |
© 2024 12Stocks.com Terms & Conditions Privacy Contact Us
All Information Provided Only For Education And Not To Be Used For Investing or Trading. See Terms & Conditions


One More Thing ... Get Best Stocks Delivered Daily!
Never Ever Miss A Move With Our Top Ten Stocks Lists
Find Best Stocks In Any Market - Bull or Bear Market
Take A Peek At Our Top Ten Stocks Lists: Daily, Weekly, Year-to-Date & Top Trends
Find Best Stocks In Any Market - Bull or Bear Market
Take A Peek At Our Top Ten Stocks Lists: Daily, Weekly, Year-to-Date & Top Trends
Smallcap Stocks With Best Up Trends [0-bearish to 100-bullish]: Vertex Energy[100], BancFirst [100], Calavo Growers[100], Old Second[100], Excelerate Energy[100], Gannett Co[100], Core Molding[100], Angel Oak[100], Tejon Ranch[100], United Fire[100], Victory Capital[100]
Best Smallcap Stocks Year-to-Date:
Agenus [541.38%], CareMax [429.9%], Janux [353.14%], Viking [240.78%], Alpine Immune[238.94%], Longboard [185.43%], Arcutis Bio[181.42%], Avidity Biosciences[153.65%], Super Micro[151.06%], Vera [145.48%], Stoke [129.66%] Best Smallcap Stocks This Week:
Macatawa Bank[47.34%], Vertex Energy[43.27%], Snap One[29.73%], Humacyte [28.47%], Vanda [24.03%], ALX Oncology[22.49%], ContextLogic [16.8%], ProKidney [16.57%], Calavo Growers[16.24%], Badger Meter[15.61%], Accolade [13.45%] Best Smallcap Stocks Daily:
Tellurian [28.11%], Origin Materials[19.59%], Metropolitan Bank[18.01%], Genelux [14.25%], Humacyte [14.02%], Vertex Energy[13.74%], Chemung Financial[10.29%], Gevo [10.14%], Riot Blockchain[10.13%], Marathon Patent[9.78%], Emergent BioSolutions[9.68%]