
 Login Sign Up


| |||||
 |  | ||||

| 12Stocks.com Market Intelligence |
Best SmallCap Stocks
|
| In a hurry? Small Cap Stock Lists: Performance Trends Table, Stock Charts
Sort Small Cap stocks: Daily, Weekly, Year-to-Date, Market Cap & Trends. Filter Small Cap stocks list by sector: Show all, Tech, Finance, Energy, Staples, Retail, Industrial, Materials, Utilities and HealthCare Filter Small Cap stocks list by size: All Large Medium Small and MicroCap |
| 12Stocks.com Small Cap Stocks Performances & Trends Daily | |||||||||
|
|  The overall Smart Investing & Trading Score is 56 (0-bearish to 100-bullish) which puts Small Cap index in short term neutral trend. The Smart Investing & Trading Score from previous trading session is 44 and hence an improvement of trend.
| ||||||||
Here are the Smart Investing & Trading Scores of the most requested small cap stocks at 12Stocks.com (click stock name for detailed review):
|


| 12Stocks.com: Investing in Smallcap Index with Stocks | |
|
The following table helps investors and traders sort through current performance and trends (as measured by Smart Investing & Trading Score) of various
stocks in the Smallcap Index. Quick View: Move mouse or cursor over stock symbol (ticker) to view short-term technical chart and over stock name to view long term chart. Click on  to add stock symbol to your watchlist and to add stock symbol to your watchlist and  to view watchlist. Click on any ticker or stock name for detailed market intelligence report for that stock. to view watchlist. Click on any ticker or stock name for detailed market intelligence report for that stock. |
12Stocks.com Performance of Stocks in Smallcap Index
| Ticker | Stock Name | Watchlist | Category | Recent Price | Smart Investing & Trading Score | Change % | YTD Change% |
| EYPT | EyePoint |   | Health Care | 16.72 | 25 | 4.50 | -27.65% |
| VHI | Valhi | | Materials | 15.00 | 53 | 4.46 | -1.25% |
| CSTL | Castle Biosciences | | Health Care | 20.37 | 54 | 4.46 | -5.61% |
| FSLY | Fastly | | Technology | 12.95 | 37 | 4.44 | -27.25% |
| DZSI | DASAN Zhone | | Technology | 1.18 | 49 | 4.42 | -40.10% |
| LMND | Lemonade | | Financials | 17.81 | 95 | 4.37 | 10.38% |
| CYH | Community Health | | Health Care | 3.39 | 74 | 4.31 | 8.31% |
| ATGE | Adtalem Global | | Services & Goods | 49.68 | 34 | 4.30 | -15.73% |
| AKRO | Akero | | Health Care | 19.72 | 27 | 4.26 | -15.55% |
| SVRA | Savara | | Health Care | 4.42 | 7 | 4.25 | -6.06% |
| ASAN | Asana | | Technology | 15.08 | 64 | 4.22 | -20.67% |
| UHG | United Homes | | Services & Goods | 6.67 | 42 | 4.22 | -20.50% |
| MOD | Modine | | Consumer Staples | 96.74 | 70 | 4.21 | 62.04% |
| CMPO | CompoSecure | | Industrials | 6.97 | 68 | 4.19 | 27.42% |
| THRD | Third Harmonic | | Health Care | 10.85 | 68 | 4.13 | -1.50% |
| GSHD | Goosehead Insurance | | Financials | 55.47 | 37 | 4.12 | -26.82% |
| DYN | Dyne | | Health Care | 24.67 | 20 | 4.11 | 85.49% |
| CPS | Cooper-Standard | | Consumer Staples | 16.00 | 17 | 4.10 | -18.12% |
| AMRK | A-Mark Precious | | Financials | 40.12 | 78 | 4.10 | 32.63% |
| TREE | LendingTree | | Financials | 37.92 | 63 | 4.09 | 25.07% |
| ONTO | Onto Innovation | | Technology | 189.77 | 50 | 4.08 | 24.11% |
| OMI | Owens & Minor | | Services & Goods | 25.09 | 61 | 4.02 | 30.20% |
| BW | Babcock & Wilcox Enterprises | | Industrials | 1.04 | 54 | 4.00 | -28.77% |
| BLFS | BioLife Solutions | | Health Care | 17.53 | 93 | 3.97 | 7.88% |
| DMRC | Digimarc | | Technology | 22.37 | 35 | 3.95 | -38.07% |


| Too many stocks? View smallcap stocks filtered by marketcap & sector |
| Marketcap: All SmallCap Stocks (default-no microcap), Large, Mid-Range, Small |
| Smallcap Sector: Tech, Finance, Energy, Staples, Retail, Industrial, Materials, & Medical |
|
Get the most comprehensive stock market coverage daily at 12Stocks.com ➞ Best Stocks Today ➞ Best Stocks Weekly ➞ Best Stocks Year-to-Date ➞ Best Stocks Trends ➞  Best Stocks Today 12Stocks.com Best Nasdaq Stocks ➞ Best S&P 500 Stocks ➞ Best Tech Stocks ➞ Best Biotech Stocks ➞ |
| Detailed Overview of SmallCap Stocks |
| SmallCap Technical Overview, Leaders & Laggards, Top SmallCap ETF Funds & Detailed SmallCap Stocks List, Charts, Trends & More |
| Smallcap: Technical Analysis, Trends & YTD Performance | |
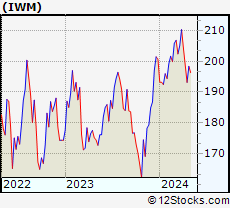
| SmallCap segment as represented by
IWM, an exchange-traded fund [ETF], holds basket of thousands of smallcap stocks from across all major sectors of the US stock market. The smallcap index (contains stocks like Riverbed & Sotheby's) is down by -1.16% and is currently underperforming the overall market by -7.3% year-to-date. Below is a quick view of technical charts and trends: | |
 IWM Weekly Chart |
|
| Long Term Trend: Good | |
| Medium Term Trend: Not Good | |
 IWM Daily Chart |
|
| Short Term Trend: Very Good | |
| Overall Trend Score: 56 | |
| YTD Performance: -1.16% | |
| **Trend Scores & Views Are Only For Educational Purposes And Not For Investing | |
| 12Stocks.com: Top Performing Small Cap Index Stocks | ||||||||||||||||||||||||||||||||||||||||||||||||
 The top performing Small Cap Index stocks year to date are
Now, more recently, over last week, the top performing Small Cap Index stocks on the move are


|
||||||||||||||||||||||||||||||||||||||||||||||||
| 12Stocks.com: Investing in Smallcap Index using Exchange Traded Funds | |
|
The following table shows list of key exchange traded funds (ETF) that
help investors track Smallcap index. The following list also includes leveraged ETF funds that track twice or thrice the daily returns of Smallcap indices. Short or inverse ETF funds move in the opposite direction to the index they track and are useful during market pullbacks or during bear markets. Quick View: Move mouse or cursor over ETF symbol (ticker) to view short-term technical chart and over ETF name to view long term chart. Click on ticker or stock name for detailed view. Click on to add stock symbol to your watchlist and to view watchlist. |
12Stocks.com List of ETFs that track Smallcap Index
| Ticker | ETF Name | Watchlist | Recent Price | Smart Investing & Trading Score | Change % | Week % | Year-to-date % |
| IWM | iShares Russell 2000 | | 198.39 | 56 | 0.97 | 2.72 | -1.16% |
| IJR | iShares Core S&P Small-Cap | | 105.65 | 85 | 0.75 | 2.35 | -2.4% |
| VTWO | Vanguard Russell 2000 ETF | | 80.28 | 70 | 1.04 | 2.82 | -1.01% |
| IWN | iShares Russell 2000 Value | | 151.14 | 75 | 0.64 | 2.27 | -2.7% |
| IWO | iShares Russell 2000 Growth | | 253.09 | 58 | 1.29 | 3.18 | 0.34% |
| IJS | iShares S&P Small-Cap 600 Value | | 97.19 | 67 | 0.52 | 1.65 | -5.7% |
| IJT | iShares S&P Small-Cap 600 Growth | | 126.16 | 70 | 0.88 | 3.23 | 0.82% |
| XSLV | PowerShares S&P SmallCap Low Volatil ETF | | 42.72 | 80 | 0.42 | 1.28 | -3.24% |
| SAA | ProShares Ultra SmallCap600 | | 23.04 | 65 | 1.65 | 5.67 | -7.68% |
| SBB | ProShares Short SmallCap600 | | 16.39 | 33 | -0.70 | -2.7 | 2.86% |
| SDD | ProShares UltraShort SmallCap600 | | 19.35 | 35 | -1.17 | -4.87 | 5.01% |
| SMLV | SPDR SSGA US Small Cap Low Volatil ETF | | 107.52 | 80 | 0.18 | 1.35 | -4.44% |
| 12Stocks.com: Charts, Trends, Fundamental Data and Performances of SmallCap Stocks | |
|
We now take in-depth look at all SmallCap stocks including charts, multi-period performances and overall trends (as measured by Smart Investing & Trading Score). One can sort SmallCap stocks (click link to choose) by Daily, Weekly and by Year-to-Date performances. Also, one can sort by size of the company or by market capitalization. |
| Select Your Default Chart Type: | |||||
| |||||
| Click on stock symbol or name for detailed view. Click on to add stock symbol to your watchlist and to view watchlist. Quick View: Move mouse or cursor over "Daily" to quickly view daily technical stock chart and over "Weekly" to view weekly technical stock chart. | |||||

 | EYPT EyePoint Pharmaceuticals, Inc. |
| Sector: Health Care | |
| SubSector: Biotechnology | |
| MarketCap: 125.085 Millions | |
| Recent Price: 16.72 Smart Investing & Trading Score: 25 | |
| Day Percent Change: 4.50% Day Change: 0.72 | |
| Week Change: -5.35% Year-to-date Change: -27.7% | |
| EYPT Links: Profile News Message Board | |
| Charts:- Daily , Weekly | |
| Add EYPT to Watchlist: View: Get Complete EYPT Trend Analysis ➞ | |
 | VHI Valhi, Inc. |
| Sector: Materials | |
| SubSector: Chemicals - Major Diversified | |
| MarketCap: 394.336 Millions | |
| Recent Price: 15.00 Smart Investing & Trading Score: 53 | |
| Day Percent Change: 4.46% Day Change: 0.64 | |
| Week Change: -3.23% Year-to-date Change: -1.3% | |
| VHI Links: Profile News Message Board | |
| Charts:- Daily , Weekly | |
| Add VHI to Watchlist: View: Get Complete VHI Trend Analysis ➞ | |
 | CSTL Castle Biosciences, Inc. |
| Sector: Health Care | |
| SubSector: Medical Laboratories & Research | |
| MarketCap: 545 Millions | |
| Recent Price: 20.37 Smart Investing & Trading Score: 54 | |
| Day Percent Change: 4.46% Day Change: 0.87 | |
| Week Change: 5.65% Year-to-date Change: -5.6% | |
| CSTL Links: Profile News Message Board | |
| Charts:- Daily , Weekly | |
| Add CSTL to Watchlist: View: Get Complete CSTL Trend Analysis ➞ | |
 | FSLY Fastly, Inc. |
| Sector: Technology | |
| SubSector: Application Software | |
| MarketCap: 1973.72 Millions | |
| Recent Price: 12.95 Smart Investing & Trading Score: 37 | |
| Day Percent Change: 4.44% Day Change: 0.55 | |
| Week Change: 5.28% Year-to-date Change: -27.3% | |
| FSLY Links: Profile News Message Board | |
| Charts:- Daily , Weekly | |
| Add FSLY to Watchlist: View: Get Complete FSLY Trend Analysis ➞ | |
 | DZSI DASAN Zhone Solutions, Inc. |
| Sector: Technology | |
| SubSector: Communication Equipment | |
| MarketCap: 90.0539 Millions | |
| Recent Price: 1.18 Smart Investing & Trading Score: 49 | |
| Day Percent Change: 4.42% Day Change: 0.05 | |
| Week Change: 0.85% Year-to-date Change: -40.1% | |
| DZSI Links: Profile News Message Board | |
| Charts:- Daily , Weekly | |
| Add DZSI to Watchlist: View: Get Complete DZSI Trend Analysis ➞ | |
 | LMND Lemonade, Inc. |
| Sector: Financials | |
| SubSector: Insurance Property & Casualty | |
| MarketCap: 56457 Millions | |
| Recent Price: 17.81 Smart Investing & Trading Score: 95 | |
| Day Percent Change: 4.37% Day Change: 0.75 | |
| Week Change: 10.73% Year-to-date Change: 10.4% | |
| LMND Links: Profile News Message Board | |
| Charts:- Daily , Weekly | |
| Add LMND to Watchlist: View: Get Complete LMND Trend Analysis ➞ | |
 | CYH Community Health Systems, Inc. |
| Sector: Health Care | |
| SubSector: Hospitals | |
| MarketCap: 371.546 Millions | |
| Recent Price: 3.39 Smart Investing & Trading Score: 74 | |
| Day Percent Change: 4.31% Day Change: 0.14 | |
| Week Change: 18.53% Year-to-date Change: 8.3% | |
| CYH Links: Profile News Message Board | |
| Charts:- Daily , Weekly | |
| Add CYH to Watchlist: View: Get Complete CYH Trend Analysis ➞ | |
 | ATGE Adtalem Global Education Inc. |
| Sector: Services & Goods | |
| SubSector: Education & Training Services | |
| MarketCap: 1273.86 Millions | |
| Recent Price: 49.68 Smart Investing & Trading Score: 34 | |
| Day Percent Change: 4.30% Day Change: 2.05 | |
| Week Change: 7.23% Year-to-date Change: -15.7% | |
| ATGE Links: Profile News Message Board | |
| Charts:- Daily , Weekly | |
| Add ATGE to Watchlist: View: Get Complete ATGE Trend Analysis ➞ | |
 | AKRO Akero Therapeutics, Inc. |
| Sector: Health Care | |
| SubSector: Biotechnology | |
| MarketCap: 675.085 Millions | |
| Recent Price: 19.72 Smart Investing & Trading Score: 27 | |
| Day Percent Change: 4.26% Day Change: 0.80 | |
| Week Change: -5.01% Year-to-date Change: -15.6% | |
| AKRO Links: Profile News Message Board | |
| Charts:- Daily , Weekly | |
| Add AKRO to Watchlist: View: Get Complete AKRO Trend Analysis ➞ | |
 | SVRA Savara Inc. |
| Sector: Health Care | |
| SubSector: Biotechnology | |
| MarketCap: 80.3785 Millions | |
| Recent Price: 4.42 Smart Investing & Trading Score: 7 | |
| Day Percent Change: 4.25% Day Change: 0.18 | |
| Week Change: -8.21% Year-to-date Change: -6.1% | |
| SVRA Links: Profile News Message Board | |
| Charts:- Daily , Weekly | |
| Add SVRA to Watchlist: View: Get Complete SVRA Trend Analysis ➞ | |
 | ASAN Asana, Inc. |
| Sector: Technology | |
| SubSector: Software Application | |
| MarketCap: 45087 Millions | |
| Recent Price: 15.08 Smart Investing & Trading Score: 64 | |
| Day Percent Change: 4.22% Day Change: 0.61 | |
| Week Change: 10.88% Year-to-date Change: -20.7% | |
| ASAN Links: Profile News Message Board | |
| Charts:- Daily , Weekly | |
| Add ASAN to Watchlist: View: Get Complete ASAN Trend Analysis ➞ | |
 | UHG United Homes Group, Inc. |
| Sector: Services & Goods | |
| SubSector: Residential Construction | |
| MarketCap: 566 Millions | |
| Recent Price: 6.67 Smart Investing & Trading Score: 42 | |
| Day Percent Change: 4.22% Day Change: 0.27 | |
| Week Change: 5.04% Year-to-date Change: -20.5% | |
| UHG Links: Profile News Message Board | |
| Charts:- Daily , Weekly | |
| Add UHG to Watchlist: View: Get Complete UHG Trend Analysis ➞ | |
 | MOD Modine Manufacturing Company |
| Sector: Consumer Staples | |
| SubSector: Auto Parts | |
| MarketCap: 177.339 Millions | |
| Recent Price: 96.74 Smart Investing & Trading Score: 70 | |
| Day Percent Change: 4.21% Day Change: 3.91 | |
| Week Change: 15.59% Year-to-date Change: 62.0% | |
| MOD Links: Profile News Message Board | |
| Charts:- Daily , Weekly | |
| Add MOD to Watchlist: View: Get Complete MOD Trend Analysis ➞ | |
 | CMPO CompoSecure, Inc. |
| Sector: Industrials | |
| SubSector: Metal Fabrication | |
| MarketCap: 535 Millions | |
| Recent Price: 6.97 Smart Investing & Trading Score: 68 | |
| Day Percent Change: 4.19% Day Change: 0.28 | |
| Week Change: 6.74% Year-to-date Change: 27.4% | |
| CMPO Links: Profile News Message Board | |
| Charts:- Daily , Weekly | |
| Add CMPO to Watchlist: View: Get Complete CMPO Trend Analysis ➞ | |
 | THRD Third Harmonic Bio, Inc. |
| Sector: Health Care | |
| SubSector: Biotechnology | |
| MarketCap: 190 Millions | |
| Recent Price: 10.85 Smart Investing & Trading Score: 68 | |
| Day Percent Change: 4.13% Day Change: 0.43 | |
| Week Change: -7.11% Year-to-date Change: -1.5% | |
| THRD Links: Profile News Message Board | |
| Charts:- Daily , Weekly | |
| Add THRD to Watchlist: View: Get Complete THRD Trend Analysis ➞ | |
 | GSHD Goosehead Insurance, Inc |
| Sector: Financials | |
| SubSector: Insurance Brokers | |
| MarketCap: 1863.57 Millions | |
| Recent Price: 55.47 Smart Investing & Trading Score: 37 | |
| Day Percent Change: 4.12% Day Change: 2.20 | |
| Week Change: -4.08% Year-to-date Change: -26.8% | |
| GSHD Links: Profile News Message Board | |
| Charts:- Daily , Weekly | |
| Add GSHD to Watchlist: View: Get Complete GSHD Trend Analysis ➞ | |
 | DYN Dyne Therapeutics, Inc. |
| Sector: Health Care | |
| SubSector: Biotechnology | |
| MarketCap: 88487 Millions | |
| Recent Price: 24.67 Smart Investing & Trading Score: 20 | |
| Day Percent Change: 4.11% Day Change: 0.98 | |
| Week Change: 3.39% Year-to-date Change: 85.5% | |
| DYN Links: Profile News Message Board | |
| Charts:- Daily , Weekly | |
| Add DYN to Watchlist: View: Get Complete DYN Trend Analysis ➞ | |
 | CPS Cooper-Standard Holdings Inc. |
| Sector: Consumer Staples | |
| SubSector: Auto Parts | |
| MarketCap: 184.339 Millions | |
| Recent Price: 16.00 Smart Investing & Trading Score: 17 | |
| Day Percent Change: 4.10% Day Change: 0.63 | |
| Week Change: 1.59% Year-to-date Change: -18.1% | |
| CPS Links: Profile News Message Board | |
| Charts:- Daily , Weekly | |
| Add CPS to Watchlist: View: Get Complete CPS Trend Analysis ➞ | |
 | AMRK A-Mark Precious Metals, Inc. |
| Sector: Financials | |
| SubSector: Investment Brokerage - National | |
| MarketCap: 60.2805 Millions | |
| Recent Price: 40.12 Smart Investing & Trading Score: 78 | |
| Day Percent Change: 4.10% Day Change: 1.58 | |
| Week Change: 5.63% Year-to-date Change: 32.6% | |
| AMRK Links: Profile News Message Board | |
| Charts:- Daily , Weekly | |
| Add AMRK to Watchlist: View: Get Complete AMRK Trend Analysis ➞ | |
 | TREE LendingTree, Inc. |
| Sector: Financials | |
| SubSector: Mortgage Investment | |
| MarketCap: 2745.99 Millions | |
| Recent Price: 37.92 Smart Investing & Trading Score: 63 | |
| Day Percent Change: 4.09% Day Change: 1.49 | |
| Week Change: 11.1% Year-to-date Change: 25.1% | |
| TREE Links: Profile News Message Board | |
| Charts:- Daily , Weekly | |
| Add TREE to Watchlist: View: Get Complete TREE Trend Analysis ➞ | |
 | ONTO Onto Innovation Inc. |
| Sector: Technology | |
| SubSector: Semiconductor Equipment & Materials | |
| MarketCap: 1187.18 Millions | |
| Recent Price: 189.77 Smart Investing & Trading Score: 50 | |
| Day Percent Change: 4.08% Day Change: 7.44 | |
| Week Change: 12.03% Year-to-date Change: 24.1% | |
| ONTO Links: Profile News Message Board | |
| Charts:- Daily , Weekly | |
| Add ONTO to Watchlist: View: Get Complete ONTO Trend Analysis ➞ | |
 | OMI Owens & Minor, Inc. |
| Sector: Services & Goods | |
| SubSector: Medical Equipment Wholesale | |
| MarketCap: 403.92 Millions | |
| Recent Price: 25.09 Smart Investing & Trading Score: 61 | |
| Day Percent Change: 4.02% Day Change: 0.97 | |
| Week Change: 1.21% Year-to-date Change: 30.2% | |
| OMI Links: Profile News Message Board | |
| Charts:- Daily , Weekly | |
| Add OMI to Watchlist: View: Get Complete OMI Trend Analysis ➞ | |
 | BW Babcock & Wilcox Enterprises, Inc. |
| Sector: Industrials | |
| SubSector: Industrial Electrical Equipment | |
| MarketCap: 59.0879 Millions | |
| Recent Price: 1.04 Smart Investing & Trading Score: 54 | |
| Day Percent Change: 4.00% Day Change: 0.04 | |
| Week Change: 12.08% Year-to-date Change: -28.8% | |
| BW Links: Profile News Message Board | |
| Charts:- Daily , Weekly | |
| Add BW to Watchlist: View: Get Complete BW Trend Analysis ➞ | |
 | BLFS BioLife Solutions, Inc. |
| Sector: Health Care | |
| SubSector: Medical Instruments & Supplies | |
| MarketCap: 264.36 Millions | |
| Recent Price: 17.53 Smart Investing & Trading Score: 93 | |
| Day Percent Change: 3.97% Day Change: 0.67 | |
| Week Change: 10.53% Year-to-date Change: 7.9% | |
| BLFS Links: Profile News Message Board | |
| Charts:- Daily , Weekly | |
| Add BLFS to Watchlist: View: Get Complete BLFS Trend Analysis ➞ | |
 | DMRC Digimarc Corporation |
| Sector: Technology | |
| SubSector: Information Technology Services | |
| MarketCap: 222.268 Millions | |
| Recent Price: 22.37 Smart Investing & Trading Score: 35 | |
| Day Percent Change: 3.95% Day Change: 0.85 | |
| Week Change: -0.97% Year-to-date Change: -38.1% | |
| DMRC Links: Profile News Message Board | |
| Charts:- Daily , Weekly | |
| Add DMRC to Watchlist: View: Get Complete DMRC Trend Analysis ➞ | |
| Too many stocks? View smallcap stocks filtered by marketcap & sector |
| Marketcap: All SmallCap Stocks (default-no microcap), Large, Mid-Range, Small & MicroCap |
| Sector: Tech, Finance, Energy, Staples, Retail, Industrial, Materials, Utilities & Medical |
|
Best Stocks Today 12Stocks.com |
© 2024 12Stocks.com Terms & Conditions Privacy Contact Us
All Information Provided Only For Education And Not To Be Used For Investing or Trading. See Terms & Conditions


One More Thing ... Get Best Stocks Delivered Daily!
Never Ever Miss A Move With Our Top Ten Stocks Lists
Find Best Stocks In Any Market - Bull or Bear Market
Take A Peek At Our Top Ten Stocks Lists: Daily, Weekly, Year-to-Date & Top Trends
Find Best Stocks In Any Market - Bull or Bear Market
Take A Peek At Our Top Ten Stocks Lists: Daily, Weekly, Year-to-Date & Top Trends
Smallcap Stocks With Best Up Trends [0-bearish to 100-bullish]: Cullinan Oncology[100], NextNav [100], MBIA [100], Reservoir Media[100], Braemar Hotels[100], B. Riley[100], Pactiv Evergreen[100], Wolverine World[100], Haemonetics [100], Benchmark Electronics[100], Uniti Group[100]
Best Smallcap Stocks Year-to-Date:
CareMax [568.04%], Janux [341.65%], Viking [299.3%], Alpine Immune[239.21%], Longboard [222.09%], Super Micro[201.81%], Avidity Biosciences[166.81%], Arcutis Bio[161.92%], Vera [156.27%], Cullinan Oncology[147.08%], Hippo [141.6%] Best Smallcap Stocks This Week:
Matterport [170.98%], B. Riley[83.84%], Cullinan Oncology[60.86%], Seres [48.22%], Zura Bio[38.67%], Universal Logistics[36.27%], Tutor Perini[33.89%], IGM Biosciences[30.83%], Riot Blockchain[30.61%], Impinj [29.79%], Sonic Automotive[28.14%] Best Smallcap Stocks Daily:
Universal Logistics[38.80%], Zura Bio[31.90%], Cullinan Oncology[30.86%], Tutor Perini[28.01%], IGM Biosciences[23.62%], U.S. Silica[21.67%], Maxeon Solar[20.17%], Exponent [19.40%], TPI Composites[16.32%], OptimizeRx [14.84%], Solaris Oilfield[13.95%]