
 Login Sign Up


| |||||
 |  | ||||

| 12Stocks.com Market Intelligence |
Best SmallCap Stocks
|
| In a hurry? Small Cap Stock Lists: Performance Trends Table, Stock Charts
Sort Small Cap stocks: Daily, Weekly, Year-to-Date, Market Cap & Trends. Filter Small Cap stocks list by sector: Show all, Tech, Finance, Energy, Staples, Retail, Industrial, Materials, Utilities and HealthCare Filter Small Cap stocks list by size: All Large Medium Small and MicroCap |
| 12Stocks.com Small Cap Stocks Performances & Trends Daily | |||||||||
|
|  The overall Smart Investing & Trading Score is 26 (0-bearish to 100-bullish) which puts Small Cap index in short term bearish to neutral trend. The Smart Investing & Trading Score from previous trading session is 31 and a deterioration of trend continues.
| ||||||||
Here are the Smart Investing & Trading Scores of the most requested small cap stocks at 12Stocks.com (click stock name for detailed review):
|


| 12Stocks.com: Investing in Smallcap Index with Stocks | |
|
The following table helps investors and traders sort through current performance and trends (as measured by Smart Investing & Trading Score) of various
stocks in the Smallcap Index. Quick View: Move mouse or cursor over stock symbol (ticker) to view short-term technical chart and over stock name to view long term chart. Click on  to add stock symbol to your watchlist and to add stock symbol to your watchlist and  to view watchlist. Click on any ticker or stock name for detailed market intelligence report for that stock. to view watchlist. Click on any ticker or stock name for detailed market intelligence report for that stock. |
12Stocks.com Performance of Stocks in Smallcap Index
| Ticker | Stock Name | Watchlist | Category | Recent Price | Smart Investing & Trading Score | Change % | YTD Change% |
| TMP | Tompkins Financial |   | Financials | 43.74 | 28 | -1.09 | -27.38% |
| MYRG | MYR Group | | Industrials | 164.90 | 36 | -1.09 | 14.02% |
| SEM | Select Medical | | Health Care | 27.29 | 36 | -1.09 | 16.13% |
| ANIP | ANI | | Health Care | 65.58 | 36 | -1.09 | 18.92% |
| NARI | Inari Medical | | Health Care | 39.06 | 10 | -1.09 | -39.85% |
| RLYB | Rallybio | | Health Care | 1.81 | 46 | -1.09 | -23.31% |
| FRME | First Merchants | | Financials | 32.50 | 10 | -1.10 | -12.35% |
| BLKB | Blackbaud | | Technology | 78.26 | 67 | -1.10 | -9.73% |
| CLW | Clearwater Paper | | Consumer Staples | 39.56 | 46 | -1.10 | 9.52% |
| KW | Kennedy-Wilson | | Financials | 8.09 | 20 | -1.10 | -34.65% |
| HGV | Hilton Grand | | Services & Goods | 43.22 | 36 | -1.10 | 7.57% |
| SITC | SITE Centers | | Financials | 13.50 | 36 | -1.10 | -0.95% |
| GRND | Grindr | | Technology | 9.92 | 46 | -1.10 | 10.71% |
| PRK | Park National | | Financials | 124.30 | 23 | -1.11 | -6.44% |
| LXU | LSB Industries | | Materials | 8.01 | 36 | -1.11 | -13.96% |
| ASUR | Asure | | Technology | 7.10 | 0 | -1.11 | -25.42% |
| QNST | QuinStreet | | Technology | 16.93 | 36 | -1.11 | 32.06% |
| AX | Axos Financial | | Financials | 48.96 | 0 | -1.11 | -10.33% |
| AIN | Albany | | Industrials | 88.48 | 23 | -1.12 | -9.92% |
| AGM | Federal Agricultural | | Financials | 177.31 | 0 | -1.12 | -7.27% |
| ALG | Alamo Group | | Industrials | 212.74 | 18 | -1.12 | 1.21% |
| RDW | Redwire | | Industrials | 3.52 | 41 | -1.12 | 23.51% |
| SNCY | Sun Country | | Industrials | 14.14 | 46 | -1.12 | -10.59% |
| SXT | Sensient | | Materials | 68.28 | 36 | -1.13 | 3.45% |
| CCBG | Capital City | | Financials | 25.90 | 0 | -1.13 | -12.01% |


| Too many stocks? View smallcap stocks filtered by marketcap & sector |
| Marketcap: All SmallCap Stocks (default-no microcap), Large, Mid-Range, Small |
| Smallcap Sector: Tech, Finance, Energy, Staples, Retail, Industrial, Materials, & Medical |
|
Get the most comprehensive stock market coverage daily at 12Stocks.com ➞ Best Stocks Today ➞ Best Stocks Weekly ➞ Best Stocks Year-to-Date ➞ Best Stocks Trends ➞  Best Stocks Today 12Stocks.com Best Nasdaq Stocks ➞ Best S&P 500 Stocks ➞ Best Tech Stocks ➞ Best Biotech Stocks ➞ |
| Detailed Overview of SmallCap Stocks |
| SmallCap Technical Overview, Leaders & Laggards, Top SmallCap ETF Funds & Detailed SmallCap Stocks List, Charts, Trends & More |
| Smallcap: Technical Analysis, Trends & YTD Performance | |
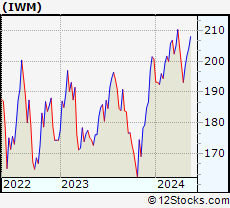
| SmallCap segment as represented by
IWM, an exchange-traded fund [ETF], holds basket of thousands of smallcap stocks from across all major sectors of the US stock market. The smallcap index (contains stocks like Riverbed & Sotheby's) is down by -2.82% and is currently underperforming the overall market by -7.84% year-to-date. Below is a quick view of technical charts and trends: | |
 IWM Weekly Chart |
|
| Long Term Trend: Good | |
| Medium Term Trend: Not Good | |
 IWM Daily Chart |
|
| Short Term Trend: Not Good | |
| Overall Trend Score: 26 | |
| YTD Performance: -2.82% | |
| **Trend Scores & Views Are Only For Educational Purposes And Not For Investing | |
| 12Stocks.com: Top Performing Small Cap Index Stocks | ||||||||||||||||||||||||||||||||||||||||||||||||
 The top performing Small Cap Index stocks year to date are
Now, more recently, over last week, the top performing Small Cap Index stocks on the move are


|
||||||||||||||||||||||||||||||||||||||||||||||||
| 12Stocks.com: Investing in Smallcap Index using Exchange Traded Funds | |
|
The following table shows list of key exchange traded funds (ETF) that
help investors track Smallcap index. The following list also includes leveraged ETF funds that track twice or thrice the daily returns of Smallcap indices. Short or inverse ETF funds move in the opposite direction to the index they track and are useful during market pullbacks or during bear markets. Quick View: Move mouse or cursor over ETF symbol (ticker) to view short-term technical chart and over ETF name to view long term chart. Click on ticker or stock name for detailed view. Click on to add stock symbol to your watchlist and to view watchlist. |
12Stocks.com List of ETFs that track Smallcap Index
| Ticker | ETF Name | Watchlist | Recent Price | Smart Investing & Trading Score | Change % | Week % | Year-to-date % |
| IWM | iShares Russell 2000 | | 195.06 | 26 | -0.37 | -1.83 | -2.82% |
| IJR | iShares Core S&P Small-Cap | | 102.72 | 0 | -0.79 | -1.71 | -5.1% |
| VTWO | Vanguard Russell 2000 ETF | | 78.70 | 26 | -0.67 | -2.02 | -2.96% |
| IWN | iShares Russell 2000 Value | | 147.16 | 13 | -0.97 | -2.14 | -5.26% |
| IWO | iShares Russell 2000 Growth | | 250.26 | 26 | -0.31 | -2 | -0.78% |
| IJS | iShares S&P Small-Cap 600 Value | | 94.41 | 0 | -0.83 | -1.83 | -8.4% |
| IJT | iShares S&P Small-Cap 600 Growth | | 122.23 | 13 | -1.04 | -2.04 | -2.33% |
| SBB | ProShares Short SmallCap600 | | 16.84 | 100 | 2.62 | 1.77 | 5.71% |
| SDD | ProShares UltraShort SmallCap600 | | 20.23 | 100 | 0.00 | 2.01 | 9.79% |
| SAA | ProShares Ultra SmallCap600 | | 21.81 | 0 | -2.76 | -3.33 | -12.59% |
| SMLV | SPDR SSGA US Small Cap Low Volatil ETF | | 103.84 | 0 | -0.85 | -1.12 | -7.71% |
| XSLV | PowerShares S&P SmallCap Low Volatil ETF | | 41.62 | 0 | -0.63 | -1.13 | -5.74% |
| 12Stocks.com: Charts, Trends, Fundamental Data and Performances of SmallCap Stocks | |
|
We now take in-depth look at all SmallCap stocks including charts, multi-period performances and overall trends (as measured by Smart Investing & Trading Score). One can sort SmallCap stocks (click link to choose) by Daily, Weekly and by Year-to-Date performances. Also, one can sort by size of the company or by market capitalization. |
| Select Your Default Chart Type: | |||||
| |||||
| Click on stock symbol or name for detailed view. Click on to add stock symbol to your watchlist and to view watchlist. Quick View: Move mouse or cursor over "Daily" to quickly view daily technical stock chart and over "Weekly" to view weekly technical stock chart. | |||||

 | TMP Tompkins Financial Corporation |
| Sector: Financials | |
| SubSector: Regional - Northeast Banks | |
| MarketCap: 1144.79 Millions | |
| Recent Price: 43.74 Smart Investing & Trading Score: 28 | |
| Day Percent Change: -1.09% Day Change: -0.48 | |
| Week Change: -1.33% Year-to-date Change: -27.4% | |
| TMP Links: Profile News Message Board | |
| Charts:- Daily , Weekly | |
| Add TMP to Watchlist: View: Get Complete TMP Trend Analysis ➞ | |
 | MYRG MYR Group Inc. |
| Sector: Industrials | |
| SubSector: General Contractors | |
| MarketCap: 405.363 Millions | |
| Recent Price: 164.90 Smart Investing & Trading Score: 36 | |
| Day Percent Change: -1.09% Day Change: -1.81 | |
| Week Change: -2.63% Year-to-date Change: 14.0% | |
| MYRG Links: Profile News Message Board | |
| Charts:- Daily , Weekly | |
| Add MYRG to Watchlist: View: Get Complete MYRG Trend Analysis ➞ | |
 | SEM Select Medical Holdings Corporation |
| Sector: Health Care | |
| SubSector: Hospitals | |
| MarketCap: 1765.96 Millions | |
| Recent Price: 27.29 Smart Investing & Trading Score: 36 | |
| Day Percent Change: -1.09% Day Change: -0.30 | |
| Week Change: -2.74% Year-to-date Change: 16.1% | |
| SEM Links: Profile News Message Board | |
| Charts:- Daily , Weekly | |
| Add SEM to Watchlist: View: Get Complete SEM Trend Analysis ➞ | |
 | ANIP ANI Pharmaceuticals, Inc. |
| Sector: Health Care | |
| SubSector: Biotechnology | |
| MarketCap: 489.285 Millions | |
| Recent Price: 65.58 Smart Investing & Trading Score: 36 | |
| Day Percent Change: -1.09% Day Change: -0.72 | |
| Week Change: -1.95% Year-to-date Change: 18.9% | |
| ANIP Links: Profile News Message Board | |
| Charts:- Daily , Weekly | |
| Add ANIP to Watchlist: View: Get Complete ANIP Trend Analysis ➞ | |
 | NARI Inari Medical, Inc. |
| Sector: Health Care | |
| SubSector: Medical Devices | |
| MarketCap: 33287 Millions | |
| Recent Price: 39.06 Smart Investing & Trading Score: 10 | |
| Day Percent Change: -1.09% Day Change: -0.43 | |
| Week Change: -4.22% Year-to-date Change: -39.9% | |
| NARI Links: Profile News Message Board | |
| Charts:- Daily , Weekly | |
| Add NARI to Watchlist: View: Get Complete NARI Trend Analysis ➞ | |
 | RLYB Rallybio Corporation |
| Sector: Health Care | |
| SubSector: Biotechnology | |
| MarketCap: 226 Millions | |
| Recent Price: 1.81 Smart Investing & Trading Score: 46 | |
| Day Percent Change: -1.09% Day Change: -0.02 | |
| Week Change: -17.73% Year-to-date Change: -23.3% | |
| RLYB Links: Profile News Message Board | |
| Charts:- Daily , Weekly | |
| Add RLYB to Watchlist: View: Get Complete RLYB Trend Analysis ➞ | |
 | FRME First Merchants Corporation |
| Sector: Financials | |
| SubSector: Regional - Midwest Banks | |
| MarketCap: 1490.4 Millions | |
| Recent Price: 32.50 Smart Investing & Trading Score: 10 | |
| Day Percent Change: -1.10% Day Change: -0.36 | |
| Week Change: -2.2% Year-to-date Change: -12.4% | |
| FRME Links: Profile News Message Board | |
| Charts:- Daily , Weekly | |
| Add FRME to Watchlist: View: Get Complete FRME Trend Analysis ➞ | |
 | BLKB Blackbaud, Inc. |
| Sector: Technology | |
| SubSector: Business Software & Services | |
| MarketCap: 2838.48 Millions | |
| Recent Price: 78.26 Smart Investing & Trading Score: 67 | |
| Day Percent Change: -1.10% Day Change: -0.87 | |
| Week Change: 2.01% Year-to-date Change: -9.7% | |
| BLKB Links: Profile News Message Board | |
| Charts:- Daily , Weekly | |
| Add BLKB to Watchlist: View: Get Complete BLKB Trend Analysis ➞ | |
 | CLW Clearwater Paper Corporation |
| Sector: Consumer Staples | |
| SubSector: Paper & Paper Products | |
| MarketCap: 416.803 Millions | |
| Recent Price: 39.56 Smart Investing & Trading Score: 46 | |
| Day Percent Change: -1.10% Day Change: -0.44 | |
| Week Change: -1.4% Year-to-date Change: 9.5% | |
| CLW Links: Profile News Message Board | |
| Charts:- Daily , Weekly | |
| Add CLW to Watchlist: View: Get Complete CLW Trend Analysis ➞ | |
 | KW Kennedy-Wilson Holdings, Inc. |
| Sector: Financials | |
| SubSector: Property Management | |
| MarketCap: 2025.42 Millions | |
| Recent Price: 8.09 Smart Investing & Trading Score: 20 | |
| Day Percent Change: -1.10% Day Change: -0.09 | |
| Week Change: -3.11% Year-to-date Change: -34.7% | |
| KW Links: Profile News Message Board | |
| Charts:- Daily , Weekly | |
| Add KW to Watchlist: View: Get Complete KW Trend Analysis ➞ | |
 | HGV Hilton Grand Vacations Inc. |
| Sector: Services & Goods | |
| SubSector: Resorts & Casinos | |
| MarketCap: 1333.04 Millions | |
| Recent Price: 43.22 Smart Investing & Trading Score: 36 | |
| Day Percent Change: -1.10% Day Change: -0.48 | |
| Week Change: -0.71% Year-to-date Change: 7.6% | |
| HGV Links: Profile News Message Board | |
| Charts:- Daily , Weekly | |
| Add HGV to Watchlist: View: Get Complete HGV Trend Analysis ➞ | |
 | SITC SITE Centers Corp. |
| Sector: Financials | |
| SubSector: REIT - Retail | |
| MarketCap: 1449.54 Millions | |
| Recent Price: 13.50 Smart Investing & Trading Score: 36 | |
| Day Percent Change: -1.10% Day Change: -0.15 | |
| Week Change: -2.17% Year-to-date Change: -1.0% | |
| SITC Links: Profile News Message Board | |
| Charts:- Daily , Weekly | |
| Add SITC to Watchlist: View: Get Complete SITC Trend Analysis ➞ | |
 | GRND Grindr Inc. |
| Sector: Technology | |
| SubSector: Software - Application | |
| MarketCap: 929 Millions | |
| Recent Price: 9.92 Smart Investing & Trading Score: 46 | |
| Day Percent Change: -1.10% Day Change: -0.11 | |
| Week Change: -3.13% Year-to-date Change: 10.7% | |
| GRND Links: Profile News Message Board | |
| Charts:- Daily , Weekly | |
| Add GRND to Watchlist: View: Get Complete GRND Trend Analysis ➞ | |
 | PRK Park National Corporation |
| Sector: Financials | |
| SubSector: Regional - Midwest Banks | |
| MarketCap: 1416.6 Millions | |
| Recent Price: 124.30 Smart Investing & Trading Score: 23 | |
| Day Percent Change: -1.11% Day Change: -1.40 | |
| Week Change: -0.74% Year-to-date Change: -6.4% | |
| PRK Links: Profile News Message Board | |
| Charts:- Daily , Weekly | |
| Add PRK to Watchlist: View: Get Complete PRK Trend Analysis ➞ | |
 | LXU LSB Industries, Inc. |
| Sector: Materials | |
| SubSector: Chemicals - Major Diversified | |
| MarketCap: 51.7736 Millions | |
| Recent Price: 8.01 Smart Investing & Trading Score: 36 | |
| Day Percent Change: -1.11% Day Change: -0.09 | |
| Week Change: -1.84% Year-to-date Change: -14.0% | |
| LXU Links: Profile News Message Board | |
| Charts:- Daily , Weekly | |
| Add LXU to Watchlist: View: Get Complete LXU Trend Analysis ➞ | |
 | ASUR Asure Software, Inc. |
| Sector: Technology | |
| SubSector: Business Software & Services | |
| MarketCap: 103.758 Millions | |
| Recent Price: 7.10 Smart Investing & Trading Score: 0 | |
| Day Percent Change: -1.11% Day Change: -0.08 | |
| Week Change: -2.74% Year-to-date Change: -25.4% | |
| ASUR Links: Profile News Message Board | |
| Charts:- Daily , Weekly | |
| Add ASUR to Watchlist: View: Get Complete ASUR Trend Analysis ➞ | |
 | QNST QuinStreet, Inc. |
| Sector: Technology | |
| SubSector: Internet Software & Services | |
| MarketCap: 411.791 Millions | |
| Recent Price: 16.93 Smart Investing & Trading Score: 36 | |
| Day Percent Change: -1.11% Day Change: -0.19 | |
| Week Change: -1.74% Year-to-date Change: 32.1% | |
| QNST Links: Profile News Message Board | |
| Charts:- Daily , Weekly | |
| Add QNST to Watchlist: View: Get Complete QNST Trend Analysis ➞ | |
 | AX Axos Financial, Inc. |
| Sector: Financials | |
| SubSector: Savings & Loans | |
| MarketCap: 1037.3 Millions | |
| Recent Price: 48.96 Smart Investing & Trading Score: 0 | |
| Day Percent Change: -1.11% Day Change: -0.55 | |
| Week Change: -1.35% Year-to-date Change: -10.3% | |
| AX Links: Profile News Message Board | |
| Charts:- Daily , Weekly | |
| Add AX to Watchlist: View: Get Complete AX Trend Analysis ➞ | |
 | AIN Albany International Corp. |
| Sector: Industrials | |
| SubSector: Textile Industrial | |
| MarketCap: 1538.4 Millions | |
| Recent Price: 88.48 Smart Investing & Trading Score: 23 | |
| Day Percent Change: -1.12% Day Change: -1.00 | |
| Week Change: -1.18% Year-to-date Change: -9.9% | |
| AIN Links: Profile News Message Board | |
| Charts:- Daily , Weekly | |
| Add AIN to Watchlist: View: Get Complete AIN Trend Analysis ➞ | |
 | AGM Federal Agricultural Mortgage Corporation |
| Sector: Financials | |
| SubSector: Credit Services | |
| MarketCap: 542.008 Millions | |
| Recent Price: 177.31 Smart Investing & Trading Score: 0 | |
| Day Percent Change: -1.12% Day Change: -2.00 | |
| Week Change: -2.53% Year-to-date Change: -7.3% | |
| AGM Links: Profile News Message Board | |
| Charts:- Daily , Weekly | |
| Add AGM to Watchlist: View: Get Complete AGM Trend Analysis ➞ | |
 | ALG Alamo Group Inc. |
| Sector: Industrials | |
| SubSector: Farm & Construction Machinery | |
| MarketCap: 964.107 Millions | |
| Recent Price: 212.74 Smart Investing & Trading Score: 18 | |
| Day Percent Change: -1.12% Day Change: -2.41 | |
| Week Change: -0.54% Year-to-date Change: 1.2% | |
| ALG Links: Profile News Message Board | |
| Charts:- Daily , Weekly | |
| Add ALG to Watchlist: View: Get Complete ALG Trend Analysis ➞ | |
 | RDW Redwire Corporation |
| Sector: Industrials | |
| SubSector: Aerospace & Defense | |
| MarketCap: 160 Millions | |
| Recent Price: 3.52 Smart Investing & Trading Score: 41 | |
| Day Percent Change: -1.12% Day Change: -0.04 | |
| Week Change: -8.81% Year-to-date Change: 23.5% | |
| RDW Links: Profile News Message Board | |
| Charts:- Daily , Weekly | |
| Add RDW to Watchlist: View: Get Complete RDW Trend Analysis ➞ | |
 | SNCY Sun Country Airlines Holdings, Inc. |
| Sector: Industrials | |
| SubSector: Airlines | |
| MarketCap: 1230 Millions | |
| Recent Price: 14.14 Smart Investing & Trading Score: 46 | |
| Day Percent Change: -1.12% Day Change: -0.16 | |
| Week Change: -0.84% Year-to-date Change: -10.6% | |
| SNCY Links: Profile News Message Board | |
| Charts:- Daily , Weekly | |
| Add SNCY to Watchlist: View: Get Complete SNCY Trend Analysis ➞ | |
 | SXT Sensient Technologies Corporation |
| Sector: Materials | |
| SubSector: Specialty Chemicals | |
| MarketCap: 1961.37 Millions | |
| Recent Price: 68.28 Smart Investing & Trading Score: 36 | |
| Day Percent Change: -1.13% Day Change: -0.78 | |
| Week Change: -0.06% Year-to-date Change: 3.5% | |
| SXT Links: Profile News Message Board | |
| Charts:- Daily , Weekly | |
| Add SXT to Watchlist: View: Get Complete SXT Trend Analysis ➞ | |
 | CCBG Capital City Bank Group, Inc. |
| Sector: Financials | |
| SubSector: Regional - Mid-Atlantic Banks | |
| MarketCap: 314.459 Millions | |
| Recent Price: 25.90 Smart Investing & Trading Score: 0 | |
| Day Percent Change: -1.13% Day Change: -0.30 | |
| Week Change: -0.6% Year-to-date Change: -12.0% | |
| CCBG Links: Profile News Message Board | |
| Charts:- Daily , Weekly | |
| Add CCBG to Watchlist: View: Get Complete CCBG Trend Analysis ➞ | |
| Too many stocks? View smallcap stocks filtered by marketcap & sector |
| Marketcap: All SmallCap Stocks (default-no microcap), Large, Mid-Range, Small & MicroCap |
| Sector: Tech, Finance, Energy, Staples, Retail, Industrial, Materials, Utilities & Medical |
|
Best Stocks Today 12Stocks.com |
© 2024 12Stocks.com Terms & Conditions Privacy Contact Us
All Information Provided Only For Education And Not To Be Used For Investing or Trading. See Terms & Conditions


One More Thing ... Get Best Stocks Delivered Daily!
Never Ever Miss A Move With Our Top Ten Stocks Lists
Find Best Stocks In Any Market - Bull or Bear Market
Take A Peek At Our Top Ten Stocks Lists: Daily, Weekly, Year-to-Date & Top Trends
Find Best Stocks In Any Market - Bull or Bear Market
Take A Peek At Our Top Ten Stocks Lists: Daily, Weekly, Year-to-Date & Top Trends
Smallcap Stocks With Best Up Trends [0-bearish to 100-bullish]: Macatawa Bank[100], ProKidney [100], Intra-Cellular Therapies[100], Warrior Met[100], IMAX [100], Boot Barn[100], Argan [100], Encore Wire[100], Core Molding[100], Oscar Health[95], Mercury General[95]
Best Smallcap Stocks Year-to-Date:
CareMax [506.19%], Janux [369.99%], Viking [259.22%], Super Micro[243.41%], Alpine Immune[238.71%], Arcutis Bio[212.38%], Longboard [198.85%], Vera [174.87%], Avidity Biosciences[164.49%], Veritone [140.11%], Stoke [136.88%] Best Smallcap Stocks This Week:
ProKidney [56%], Macatawa Bank[42.54%], Snap One[29.3%], Intra-Cellular Therapies[21.21%], Escalade [15.03%], ALX Oncology[11.51%], Encore Wire[11.12%], Warrior Met[9.13%], Super Micro[8.65%], NextNav [8.1%], Envestnet [7.85%] Best Smallcap Stocks Daily:
Macatawa Bank[37.66%], ProKidney [30.62%], Intra-Cellular Therapies[23.30%], System1 [21.93%], Escalade [16.11%], NextNav [13.54%], ALX Oncology[12.72%], Allbirds [10.78%], Super Micro[10.58%], Mondee [9.57%], Nuvectis Pharma[9.44%]