
 Login Sign Up


| |||||
 |  | ||||

| 12Stocks.com Market Intelligence |
Best SmallCap Stocks
|
| In a hurry? Small Cap Stock Lists: Performance Trends Table, Stock Charts
Sort Small Cap stocks: Daily, Weekly, Year-to-Date, Market Cap & Trends. Filter Small Cap stocks list by sector: Show all, Tech, Finance, Energy, Staples, Retail, Industrial, Materials, Utilities and HealthCare Filter Small Cap stocks list by size: All Large Medium Small and MicroCap |
| 12Stocks.com Small Cap Stocks Performances & Trends Daily | |||||||||
|
|  The overall Smart Investing & Trading Score is 58 (0-bearish to 100-bullish) which puts Small Cap index in short term neutral trend. The Smart Investing & Trading Score from previous trading session is 63 and hence a deterioration of trend.
| ||||||||
Here are the Smart Investing & Trading Scores of the most requested small cap stocks at 12Stocks.com (click stock name for detailed review):
|


| 12Stocks.com: Investing in Smallcap Index with Stocks | |
|
The following table helps investors and traders sort through current performance and trends (as measured by Smart Investing & Trading Score) of various
stocks in the Smallcap Index. Quick View: Move mouse or cursor over stock symbol (ticker) to view short-term technical chart and over stock name to view long term chart. Click on  to add stock symbol to your watchlist and to add stock symbol to your watchlist and  to view watchlist. Click on any ticker or stock name for detailed market intelligence report for that stock. to view watchlist. Click on any ticker or stock name for detailed market intelligence report for that stock. |
12Stocks.com Performance of Stocks in Smallcap Index
| Ticker | Stock Name | Watchlist | Category | Recent Price | Smart Investing & Trading Score | Change % | YTD Change% |
| BANC | Banc of California |   | Financials | 14.09 | 17 | 1.00 | 4.91% |
| KN | Knowles | | Technology | 16.14 | 67 | 1.00 | -9.88% |
| CNDT | Conduent | | Technology | 3.06 | 10 | 0.99 | -16.16% |
| GOCO | GoHealth | | Financials | 10.24 | 22 | 0.99 | -22.01% |
| PLPC | Preformed Line | | Industrials | 124.48 | 43 | 0.98 | -7.01% |
| FNLC | First Bancorp | | Financials | 22.74 | 37 | 0.98 | -19.42% |
| JXN | Jackson Financial | | Financials | 70.21 | 100 | 0.98 | 36.60% |
| TTGT | TechTarget | | Technology | 27.54 | 35 | 0.97 | -21.01% |
| PEB | Pebblebrook Hotel | | Financials | 15.60 | 88 | 0.97 | -2.38% |
| SAVA | Cassava Sciences | | Health Care | 20.75 | 30 | 0.97 | -7.82% |
| FHTX | Foghorn | | Health Care | 5.21 | 46 | 0.97 | -18.78% |
| NRDY | Nerdy | | Technology | 2.60 | 17 | 0.97 | -24.45% |
| CARS | Cars.com | | Services & Goods | 16.86 | 49 | 0.96 | -11.12% |
| HWC | Hancock Whitney | | Financials | 46.44 | 73 | 0.96 | -4.42% |
| KNSA | Kiniksa | | Health Care | 17.85 | 40 | 0.96 | 1.77% |
| BMEA | Biomea Fusion | | Health Care | 11.07 | 17 | 0.96 | -24.35% |
| PBI | Pitney Bowes | | Consumer Staples | 4.24 | 90 | 0.95 | -3.64% |
| CSV | Carriage Services | | Services & Goods | 25.42 | 100 | 0.95 | 1.64% |
| CCOI | Cogent | | Technology | 64.93 | 57 | 0.95 | -14.63% |
| PNM | PNM Resources | | Utilities | 36.63 | 45 | 0.94 | -11.95% |
| SWX | Southwest Gas | | Utilities | 75.25 | 76 | 0.94 | 18.78% |
| RGNX | REGENXBIO | | Health Care | 16.05 | 43 | 0.94 | -10.58% |
| AXL | American Axle | | Consumer Staples | 7.56 | 74 | 0.93 | -14.19% |
| SMMF | Summit Financial | | Financials | 27.56 | 55 | 0.93 | -10.22% |
| CZNC | Citizens & Northern | | Financials | 18.05 | 74 | 0.92 | -19.55% |


| Too many stocks? View smallcap stocks filtered by marketcap & sector |
| Marketcap: All SmallCap Stocks (default-no microcap), Large, Mid-Range, Small |
| Smallcap Sector: Tech, Finance, Energy, Staples, Retail, Industrial, Materials, & Medical |
|
Get the most comprehensive stock market coverage daily at 12Stocks.com ➞ Best Stocks Today ➞ Best Stocks Weekly ➞ Best Stocks Year-to-Date ➞ Best Stocks Trends ➞  Best Stocks Today 12Stocks.com Best Nasdaq Stocks ➞ Best S&P 500 Stocks ➞ Best Tech Stocks ➞ Best Biotech Stocks ➞ |
| Detailed Overview of SmallCap Stocks |
| SmallCap Technical Overview, Leaders & Laggards, Top SmallCap ETF Funds & Detailed SmallCap Stocks List, Charts, Trends & More |
| Smallcap: Technical Analysis, Trends & YTD Performance | |
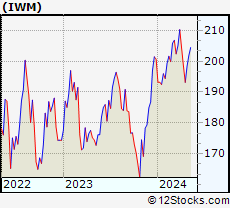
| SmallCap segment as represented by
IWM, an exchange-traded fund [ETF], holds basket of thousands of smallcap stocks from across all major sectors of the US stock market. The smallcap index (contains stocks like Riverbed & Sotheby's) is down by -1.51% and is currently underperforming the overall market by -7.17% year-to-date. Below is a quick view of technical charts and trends: | |
 IWM Weekly Chart |
|
| Long Term Trend: Good | |
| Medium Term Trend: Not Good | |
 IWM Daily Chart |
|
| Short Term Trend: Very Good | |
| Overall Trend Score: 58 | |
| YTD Performance: -1.51% | |
| **Trend Scores & Views Are Only For Educational Purposes And Not For Investing | |
| 12Stocks.com: Top Performing Small Cap Index Stocks | ||||||||||||||||||||||||||||||||||||||||||||||||
 The top performing Small Cap Index stocks year to date are
Now, more recently, over last week, the top performing Small Cap Index stocks on the move are


|
||||||||||||||||||||||||||||||||||||||||||||||||
| 12Stocks.com: Investing in Smallcap Index using Exchange Traded Funds | |
|
The following table shows list of key exchange traded funds (ETF) that
help investors track Smallcap index. The following list also includes leveraged ETF funds that track twice or thrice the daily returns of Smallcap indices. Short or inverse ETF funds move in the opposite direction to the index they track and are useful during market pullbacks or during bear markets. Quick View: Move mouse or cursor over ETF symbol (ticker) to view short-term technical chart and over ETF name to view long term chart. Click on ticker or stock name for detailed view. Click on to add stock symbol to your watchlist and to view watchlist. |
12Stocks.com List of ETFs that track Smallcap Index
| Ticker | ETF Name | Watchlist | Recent Price | Smart Investing & Trading Score | Change % | Week % | Year-to-date % |
| IWM | iShares Russell 2000 | | 197.68 | 58 | -0.45 | 2.35 | -1.51% |
| IJR | iShares Core S&P Small-Cap | | 105.71 | 85 | -0.24 | 2.41 | -2.35% |
| VTWO | Vanguard Russell 2000 ETF | | 79.95 | 48 | -0.42 | 2.39 | -1.42% |
| IWN | iShares Russell 2000 Value | | 151.28 | 75 | -0.30 | 2.37 | -2.61% |
| IWO | iShares Russell 2000 Growth | | 251.27 | 58 | -0.44 | 2.44 | -0.38% |
| IJS | iShares S&P Small-Cap 600 Value | | 97.71 | 45 | -0.43 | 2.2 | -5.2% |
| IJT | iShares S&P Small-Cap 600 Growth | | 125.60 | 48 | -0.10 | 2.77 | 0.37% |
| XSLV | PowerShares S&P SmallCap Low Volatil ETF | | 42.81 | 48 | -0.57 | 1.48 | -3.05% |
| SBB | ProShares Short SmallCap600 | | 16.37 | 33 | -0.02 | -2.79 | 2.76% |
| SMLV | SPDR SSGA US Small Cap Low Volatil ETF | | 108.43 | 73 | -0.31 | 2.21 | -3.63% |
| SAA | ProShares Ultra SmallCap600 | | 23.01 | 58 | -0.60 | 5.55 | -7.78% |
| SDD | ProShares UltraShort SmallCap600 | | 19.49 | 42 | 1.35 | -4.18 | 5.77% |
| 12Stocks.com: Charts, Trends, Fundamental Data and Performances of SmallCap Stocks | |
|
We now take in-depth look at all SmallCap stocks including charts, multi-period performances and overall trends (as measured by Smart Investing & Trading Score). One can sort SmallCap stocks (click link to choose) by Daily, Weekly and by Year-to-Date performances. Also, one can sort by size of the company or by market capitalization. |
| Select Your Default Chart Type: | |||||
| |||||
| Click on stock symbol or name for detailed view. Click on to add stock symbol to your watchlist and to view watchlist. Quick View: Move mouse or cursor over "Daily" to quickly view daily technical stock chart and over "Weekly" to view weekly technical stock chart. | |||||

 | BANC Banc of California, Inc. |
| Sector: Financials | |
| SubSector: Regional - Pacific Banks | |
| MarketCap: 459.929 Millions | |
| Recent Price: 14.09 Smart Investing & Trading Score: 17 | |
| Day Percent Change: 1.00% Day Change: 0.14 | |
| Week Change: 1.66% Year-to-date Change: 4.9% | |
| BANC Links: Profile News Message Board | |
| Charts:- Daily , Weekly | |
| Add BANC to Watchlist: View: Get Complete BANC Trend Analysis ➞ | |
 | KN Knowles Corporation |
| Sector: Technology | |
| SubSector: Communication Equipment | |
| MarketCap: 1231.39 Millions | |
| Recent Price: 16.14 Smart Investing & Trading Score: 67 | |
| Day Percent Change: 1.00% Day Change: 0.16 | |
| Week Change: 5.77% Year-to-date Change: -9.9% | |
| KN Links: Profile News Message Board | |
| Charts:- Daily , Weekly | |
| Add KN to Watchlist: View: Get Complete KN Trend Analysis ➞ | |
 | CNDT Conduent Incorporated |
| Sector: Technology | |
| SubSector: Information Technology Services | |
| MarketCap: 514.968 Millions | |
| Recent Price: 3.06 Smart Investing & Trading Score: 10 | |
| Day Percent Change: 0.99% Day Change: 0.03 | |
| Week Change: 0% Year-to-date Change: -16.2% | |
| CNDT Links: Profile News Message Board | |
| Charts:- Daily , Weekly | |
| Add CNDT to Watchlist: View: Get Complete CNDT Trend Analysis ➞ | |
 | GOCO GoHealth, Inc. |
| Sector: Financials | |
| SubSector: Insurance Brokers | |
| MarketCap: 44157 Millions | |
| Recent Price: 10.24 Smart Investing & Trading Score: 22 | |
| Day Percent Change: 0.99% Day Change: 0.10 | |
| Week Change: 1.09% Year-to-date Change: -22.0% | |
| GOCO Links: Profile News Message Board | |
| Charts:- Daily , Weekly | |
| Add GOCO to Watchlist: View: Get Complete GOCO Trend Analysis ➞ | |
 | PLPC Preformed Line Products Company |
| Sector: Industrials | |
| SubSector: Industrial Electrical Equipment | |
| MarketCap: 221.779 Millions | |
| Recent Price: 124.48 Smart Investing & Trading Score: 43 | |
| Day Percent Change: 0.98% Day Change: 1.21 | |
| Week Change: -0.14% Year-to-date Change: -7.0% | |
| PLPC Links: Profile News Message Board | |
| Charts:- Daily , Weekly | |
| Add PLPC to Watchlist: View: Get Complete PLPC Trend Analysis ➞ | |
 | FNLC The First Bancorp, Inc. |
| Sector: Financials | |
| SubSector: Regional - Northeast Banks | |
| MarketCap: 264.799 Millions | |
| Recent Price: 22.74 Smart Investing & Trading Score: 37 | |
| Day Percent Change: 0.98% Day Change: 0.22 | |
| Week Change: -1.09% Year-to-date Change: -19.4% | |
| FNLC Links: Profile News Message Board | |
| Charts:- Daily , Weekly | |
| Add FNLC to Watchlist: View: Get Complete FNLC Trend Analysis ➞ | |
 | JXN Jackson Financial Inc. |
| Sector: Financials | |
| SubSector: Insurance - Life | |
| MarketCap: 2460 Millions | |
| Recent Price: 70.21 Smart Investing & Trading Score: 100 | |
| Day Percent Change: 0.98% Day Change: 0.68 | |
| Week Change: 7.68% Year-to-date Change: 36.6% | |
| JXN Links: Profile News Message Board | |
| Charts:- Daily , Weekly | |
| Add JXN to Watchlist: View: Get Complete JXN Trend Analysis ➞ | |
 | TTGT TechTarget, Inc. |
| Sector: Technology | |
| SubSector: Internet Information Providers | |
| MarketCap: 560.78 Millions | |
| Recent Price: 27.54 Smart Investing & Trading Score: 35 | |
| Day Percent Change: 0.97% Day Change: 0.27 | |
| Week Change: 1.34% Year-to-date Change: -21.0% | |
| TTGT Links: Profile News Message Board | |
| Charts:- Daily , Weekly | |
| Add TTGT to Watchlist: View: Get Complete TTGT Trend Analysis ➞ | |
 | PEB Pebblebrook Hotel Trust |
| Sector: Financials | |
| SubSector: REIT - Hotel/Motel | |
| MarketCap: 1472.84 Millions | |
| Recent Price: 15.60 Smart Investing & Trading Score: 88 | |
| Day Percent Change: 0.97% Day Change: 0.15 | |
| Week Change: 6.63% Year-to-date Change: -2.4% | |
| PEB Links: Profile News Message Board | |
| Charts:- Daily , Weekly | |
| Add PEB to Watchlist: View: Get Complete PEB Trend Analysis ➞ | |
 | SAVA Cassava Sciences, Inc. |
| Sector: Health Care | |
| SubSector: Biotechnology | |
| MarketCap: 86.6785 Millions | |
| Recent Price: 20.75 Smart Investing & Trading Score: 30 | |
| Day Percent Change: 0.97% Day Change: 0.20 | |
| Week Change: 5.81% Year-to-date Change: -7.8% | |
| SAVA Links: Profile News Message Board | |
| Charts:- Daily , Weekly | |
| Add SAVA to Watchlist: View: Get Complete SAVA Trend Analysis ➞ | |
 | FHTX Foghorn Therapeutics Inc. |
| Sector: Health Care | |
| SubSector: Biotechnology | |
| MarketCap: 74487 Millions | |
| Recent Price: 5.21 Smart Investing & Trading Score: 46 | |
| Day Percent Change: 0.97% Day Change: 0.05 | |
| Week Change: -10.25% Year-to-date Change: -18.8% | |
| FHTX Links: Profile News Message Board | |
| Charts:- Daily , Weekly | |
| Add FHTX to Watchlist: View: Get Complete FHTX Trend Analysis ➞ | |
 | NRDY Nerdy, Inc. |
| Sector: Technology | |
| SubSector: Software - Application | |
| MarketCap: 683 Millions | |
| Recent Price: 2.60 Smart Investing & Trading Score: 17 | |
| Day Percent Change: 0.97% Day Change: 0.03 | |
| Week Change: 2.57% Year-to-date Change: -24.5% | |
| NRDY Links: Profile News Message Board | |
| Charts:- Daily , Weekly | |
| Add NRDY to Watchlist: View: Get Complete NRDY Trend Analysis ➞ | |
 | CARS Cars.com Inc. |
| Sector: Services & Goods | |
| SubSector: Auto Dealerships | |
| MarketCap: 290.321 Millions | |
| Recent Price: 16.86 Smart Investing & Trading Score: 49 | |
| Day Percent Change: 0.96% Day Change: 0.16 | |
| Week Change: 2.55% Year-to-date Change: -11.1% | |
| CARS Links: Profile News Message Board | |
| Charts:- Daily , Weekly | |
| Add CARS to Watchlist: View: Get Complete CARS Trend Analysis ➞ | |
 | HWC Hancock Whitney Corporation |
| Sector: Financials | |
| SubSector: Regional - Southeast Banks | |
| MarketCap: 1438.55 Millions | |
| Recent Price: 46.44 Smart Investing & Trading Score: 73 | |
| Day Percent Change: 0.96% Day Change: 0.44 | |
| Week Change: 4.93% Year-to-date Change: -4.4% | |
| HWC Links: Profile News Message Board | |
| Charts:- Daily , Weekly | |
| Add HWC to Watchlist: View: Get Complete HWC Trend Analysis ➞ | |
 | KNSA Kiniksa Pharmaceuticals, Ltd. |
| Sector: Health Care | |
| SubSector: Biotechnology | |
| MarketCap: 780.285 Millions | |
| Recent Price: 17.85 Smart Investing & Trading Score: 40 | |
| Day Percent Change: 0.96% Day Change: 0.17 | |
| Week Change: 5.43% Year-to-date Change: 1.8% | |
| KNSA Links: Profile News Message Board | |
| Charts:- Daily , Weekly | |
| Add KNSA to Watchlist: View: Get Complete KNSA Trend Analysis ➞ | |
 | BMEA Biomea Fusion, Inc. |
| Sector: Health Care | |
| SubSector: Biotechnology | |
| MarketCap: 818 Millions | |
| Recent Price: 11.07 Smart Investing & Trading Score: 17 | |
| Day Percent Change: 0.96% Day Change: 0.10 | |
| Week Change: 2.07% Year-to-date Change: -24.4% | |
| BMEA Links: Profile News Message Board | |
| Charts:- Daily , Weekly | |
| Add BMEA to Watchlist: View: Get Complete BMEA Trend Analysis ➞ | |
 | PBI Pitney Bowes Inc. |
| Sector: Consumer Staples | |
| SubSector: Business Equipment | |
| MarketCap: 408.067 Millions | |
| Recent Price: 4.24 Smart Investing & Trading Score: 90 | |
| Day Percent Change: 0.95% Day Change: 0.04 | |
| Week Change: 6.27% Year-to-date Change: -3.6% | |
| PBI Links: Profile News Message Board | |
| Charts:- Daily , Weekly | |
| Add PBI to Watchlist: View: Get Complete PBI Trend Analysis ➞ | |
 | CSV Carriage Services, Inc. |
| Sector: Services & Goods | |
| SubSector: Personal Services | |
| MarketCap: 304.725 Millions | |
| Recent Price: 25.42 Smart Investing & Trading Score: 100 | |
| Day Percent Change: 0.95% Day Change: 0.24 | |
| Week Change: 5.92% Year-to-date Change: 1.6% | |
| CSV Links: Profile News Message Board | |
| Charts:- Daily , Weekly | |
| Add CSV to Watchlist: View: Get Complete CSV Trend Analysis ➞ | |
 | CCOI Cogent Communications Holdings, Inc. |
| Sector: Technology | |
| SubSector: Diversified Communication Services | |
| MarketCap: 3868.14 Millions | |
| Recent Price: 64.93 Smart Investing & Trading Score: 57 | |
| Day Percent Change: 0.95% Day Change: 0.61 | |
| Week Change: 2.59% Year-to-date Change: -14.6% | |
| CCOI Links: Profile News Message Board | |
| Charts:- Daily , Weekly | |
| Add CCOI to Watchlist: View: Get Complete CCOI Trend Analysis ➞ | |
 | PNM PNM Resources, Inc. |
| Sector: Utilities | |
| SubSector: Diversified Utilities | |
| MarketCap: 2755.3 Millions | |
| Recent Price: 36.63 Smart Investing & Trading Score: 45 | |
| Day Percent Change: 0.94% Day Change: 0.34 | |
| Week Change: 0.05% Year-to-date Change: -12.0% | |
| PNM Links: Profile News Message Board | |
| Charts:- Daily , Weekly | |
| Add PNM to Watchlist: View: Get Complete PNM Trend Analysis ➞ | |
 | SWX Southwest Gas Holdings, Inc. |
| Sector: Utilities | |
| SubSector: Gas Utilities | |
| MarketCap: 3427.87 Millions | |
| Recent Price: 75.25 Smart Investing & Trading Score: 76 | |
| Day Percent Change: 0.94% Day Change: 0.70 | |
| Week Change: 2.41% Year-to-date Change: 18.8% | |
| SWX Links: Profile News Message Board | |
| Charts:- Daily , Weekly | |
| Add SWX to Watchlist: View: Get Complete SWX Trend Analysis ➞ | |
 | RGNX REGENXBIO Inc. |
| Sector: Health Care | |
| SubSector: Biotechnology | |
| MarketCap: 1232.85 Millions | |
| Recent Price: 16.05 Smart Investing & Trading Score: 43 | |
| Day Percent Change: 0.94% Day Change: 0.15 | |
| Week Change: 2.29% Year-to-date Change: -10.6% | |
| RGNX Links: Profile News Message Board | |
| Charts:- Daily , Weekly | |
| Add RGNX to Watchlist: View: Get Complete RGNX Trend Analysis ➞ | |
 | AXL American Axle & Manufacturing Holdings, Inc. |
| Sector: Consumer Staples | |
| SubSector: Auto Parts | |
| MarketCap: 407.139 Millions | |
| Recent Price: 7.56 Smart Investing & Trading Score: 74 | |
| Day Percent Change: 0.93% Day Change: 0.07 | |
| Week Change: 6.78% Year-to-date Change: -14.2% | |
| AXL Links: Profile News Message Board | |
| Charts:- Daily , Weekly | |
| Add AXL to Watchlist: View: Get Complete AXL Trend Analysis ➞ | |
 | SMMF Summit Financial Group, Inc. |
| Sector: Financials | |
| SubSector: Regional - Mid-Atlantic Banks | |
| MarketCap: 228.959 Millions | |
| Recent Price: 27.56 Smart Investing & Trading Score: 55 | |
| Day Percent Change: 0.93% Day Change: 0.25 | |
| Week Change: 1.31% Year-to-date Change: -10.2% | |
| SMMF Links: Profile News Message Board | |
| Charts:- Daily , Weekly | |
| Add SMMF to Watchlist: View: Get Complete SMMF Trend Analysis ➞ | |
 | CZNC Citizens & Northern Corporation |
| Sector: Financials | |
| SubSector: Regional - Mid-Atlantic Banks | |
| MarketCap: 274.459 Millions | |
| Recent Price: 18.05 Smart Investing & Trading Score: 74 | |
| Day Percent Change: 0.92% Day Change: 0.17 | |
| Week Change: 1.78% Year-to-date Change: -19.6% | |
| CZNC Links: Profile News Message Board | |
| Charts:- Daily , Weekly | |
| Add CZNC to Watchlist: View: Get Complete CZNC Trend Analysis ➞ | |
| Too many stocks? View smallcap stocks filtered by marketcap & sector |
| Marketcap: All SmallCap Stocks (default-no microcap), Large, Mid-Range, Small & MicroCap |
| Sector: Tech, Finance, Energy, Staples, Retail, Industrial, Materials, Utilities & Medical |
|
Best Stocks Today 12Stocks.com |
© 2024 12Stocks.com Terms & Conditions Privacy Contact Us
All Information Provided Only For Education And Not To Be Used For Investing or Trading. See Terms & Conditions


One More Thing ... Get Best Stocks Delivered Daily!
Never Ever Miss A Move With Our Top Ten Stocks Lists
Find Best Stocks In Any Market - Bull or Bear Market
Take A Peek At Our Top Ten Stocks Lists: Daily, Weekly, Year-to-Date & Top Trends
Find Best Stocks In Any Market - Bull or Bear Market
Take A Peek At Our Top Ten Stocks Lists: Daily, Weekly, Year-to-Date & Top Trends
Smallcap Stocks With Best Up Trends [0-bearish to 100-bullish]: B. Riley[100], Ribbon [100], Group 1[100], Trustmark [100], MBIA [100], Integer [100], EchoStar [100], Vishay Inter[100], Comstock Resources[100], Jamf Holding[100], SunOpta [100]
Best Smallcap Stocks Year-to-Date:
CareMax [574.23%], Janux [352.07%], Viking [249.44%], Alpine Immune[239.13%], Longboard [223.4%], Avidity Biosciences[177.71%], Arcutis Bio[171.21%], Super Micro[165.69%], Vera [149.61%], Hippo [130.79%], Y-mAbs [123.75%] Best Smallcap Stocks This Week:
Matterport [166.09%], B. Riley[49.37%], Seres [30.29%], Riot Blockchain[30.07%], CareMax [27.24%], Ribbon [25.78%], ProKidney [23.28%], SoundHound AI[22.54%], Cipher Mining[22.14%], Hibbett Sports[21.56%], Cullinan Oncology[20.69%] Best Smallcap Stocks Daily:
B. Riley[37.48%], Ribbon [26.26%], Babcock & Wilcox Enterprises[15.57%], Cullinan Oncology[13.55%], Amneal [12.41%], Gritstone Oncology[11.01%], Comtech Tele[10.76%], Innodata [9.76%], Navitas Semiconductor[8.83%], Eyenovia [8.68%], K12 [8.64%]